
Integrating Tech
Mapping the impact of the schoolyard on watershed health
Mapping the impact of the schoolyard on watershed health
By Emily J. Rees
Hardware, software, and websites for use in the classroom
Situated in Northwest Ohio, our schoolyard is located within the Maumee River and Western Lake Erie watersheds. The total amount of phosphorus, the product of agricultural and manufacturing businesses from approximately 6,586 square miles (10,500 square kilometers), transported by the Maumee River to Lake Erie is of particular concern with respect to algae blooms (McDill 1952; Smith, King, and Williams 2015). Our schoolyard also produces runoff, which flows into two streams, one unnamed on the western edge of the property and Gordon Creek on the east, eventually draining into the Maumee River and Lake Erie. The idea that our schoolyard actions impact local watershed health drove the development of a participatory mapping project—a map-making process incorporating community needs and understanding. As suggested by Mears (2012), participatory mapping projects may promote student learning in a variety of disciplines and encourage care for the environment, while connecting students with the local community.
During a no-cost, inquiry-based participatory mapping project, my students led the investigation by determining what elements of the schoolyard to explore while documenting discoveries on a collaborative Google My Map (see Resources). To focus the student investigation, I gave students the objective of determining how the schoolyard impacts the local watershed by making observations showcasing previously learned vocabulary (runoff, erosion, point, and nonpoint source pollution).
In this participatory mapping activity, students were expected to apply their knowledge of the following previously learned concepts: 1.Water moves through Earth’s spheres (lithosphere, biosphere, hydrosphere, atmosphere). 2.The movement of water over Earth’s surface may cause soil erosion. 3.Earth’s topography influences the movement of surface water, with areas of high elevation outlining regional drainage basins. 4.Runoff may carry sediment and chemicals into local waterways, impacting water quality and aquatic species.
What is Google My Maps?
Google My Maps is a user-friendly online platform that allows individuals to create personalized, sharable maps using existing Google data. Users can pin data (text, photographs, or videos) onto a Google map of their region and color-code this information to enhance clarity.
Use in the classroom
Google My Maps is an accessible platform for use in the science classroom, allowing students to visually share data on a specific research topic or from outdoor education experiences. Using Google My Maps in the classroom can enhance the learning of science by visually placing student data into the framework of their community and allowing teachers to assess student understanding.
Tutorials
Video tutorials for creating a Google My Map are available on YouTube; see for suggestions.
Teacher background: Listening to our community
Prior to introducing the topic to my students, I met with several community stakeholders to determine specific community concerns regarding local watershed health. In meeting with these community members, including our school building supervisor and the county watershed education coordinator, I learned about the drainage pattern of our schoolyard. Water quality concerns expressed by community members focused on potential nonpoint source pollutants (e.g., failing septic tanks, manure storage, and chemical fertilizer application). These conversations also served to support classroom learning, as they gave me the confidence to explain to students how the rate of schoolyard runoff is managed through a catch-basin system and identify specific areas of concern for students to consider. In developing your own participatory mapping projects, you might consider incorporating students into these community conversations as part of your lesson plan.
Days 1 and 2: Student brainstorming
To begin this project, I engaged students in an inquiry-based brainstorming activity as we explored the grounds of our schoolyard. Supervised by at least one teacher, students were directed to explore portions of the schoolyard in groups of three or four to identify examples of previously learned class concepts (e.g., pollution sources and erosion). To guide student observations, students were challenged to consider the question: “How does our schoolyard impact local water quality?” As we walked the property, groups recorded observations and noted on a Brainstorming Watershed Mapping handout (see Figure 1) any central questions or themes around which the map could center.
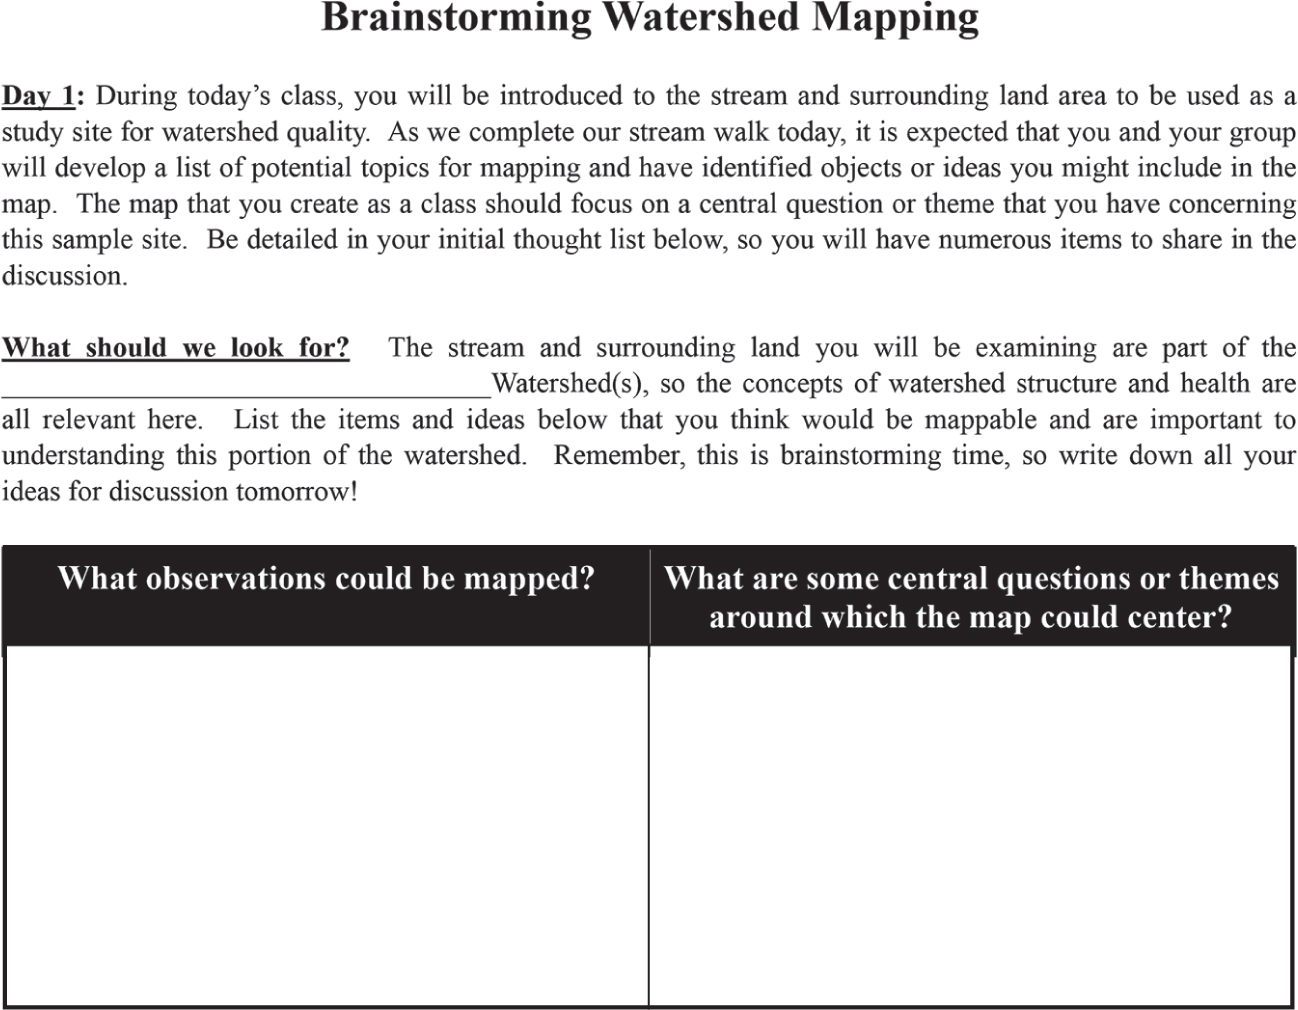
Students were expected to integrate previously learned hydrologic cycle concepts and consider how their notes might help inform general community understanding of watershed health. Examples of observations made by students during this brainstorming session include species found in the schoolyard, trash, and areas of bare soil. This brainstorming challenge further served as a method of formative assessment, as I was able to determine whether my students could take our learning of hydrologic cycle concepts and apply them to a real-life environment. Did they see and identify erosion on the bank of the retention pond? Did they understand the significance of catch basins and their association with runoff and nonpoint pollution? Observations of student discussions during the exploration period and a review of brainstorming handouts revealed that students were able to identify areas within the schoolyard associated with evaluating water quality. Examples of student observations included plastic bottles, cardboard, and plastic bags in the stream; areas of bare soil around the school retention pond; and a series of catch basins throughout the school property.
Day 3: Student decision-making discussion
During this class period, students engaged in whole-class discussions, sharing observations and ideas for layers of information (categorized data that are visually displayed when selected) to be included on the participatory map. As each group identified observations it found critical to understanding how our schoolyard impacts the local watershed, many emphasizing litter and human impact, I recorded these ideas on the Smartboard. Following a class review of each major observation, the class selected through a hand vote the topic it was most interested in investigating further. Prior to voting, I informed each class period of the investigation topics selected by earlier class periods to ensure each class identified one unique idea on which to focus its layer of the participatory map. Selected topics for exploration included point and nonpoint pollution sources, catch-basin locations and retention pond water quality, surrounding land use, and erosion with respect to “indicator species”—a term that refers to how species within the water can indicate water quality. For example, a water sample containing species highly sensitive to pollution would indicate “excellent” water quality.
Days 4–7: Participatory map data collection
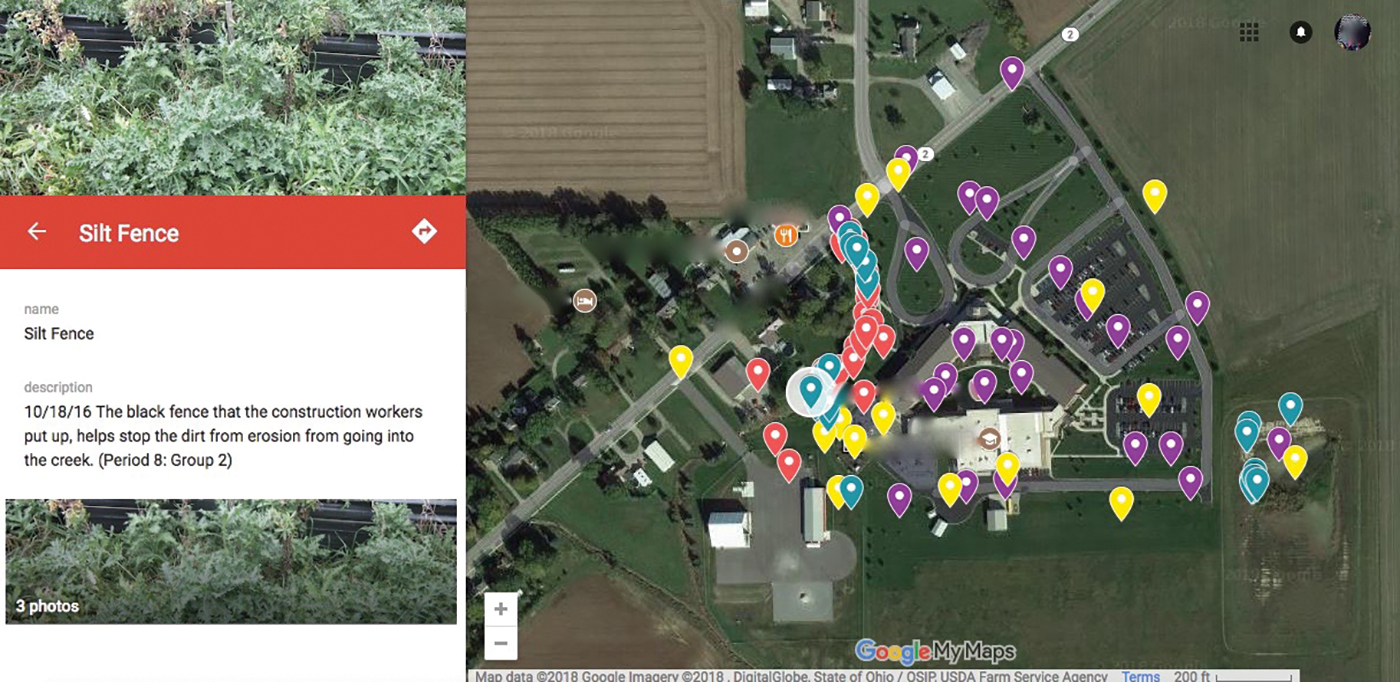
Student collection of Google My Map data followed decisions made by each class period with regard to making observations and gathering schoolyard evidence. Class periods first identified the areas of the schoolyard most appropriate for collecting data on the selected topic (map layer). Locations, shown on the map, included the adjacent unnamed stream, school parking lot and lawn, schoolyard border, and retention pond. In each location, observations relevant to the selected topic were photographed and written descriptions were recorded on the provided handout and paper map (see Figure 2; see “Field Safety Notes” on p. 32 for safety information). A group focusing on collecting data for the erosion layer of the map, for example, photographed a silt fence installed for a state construction project near the adjacent stream and wrote a detailed description of the location and materials observed.
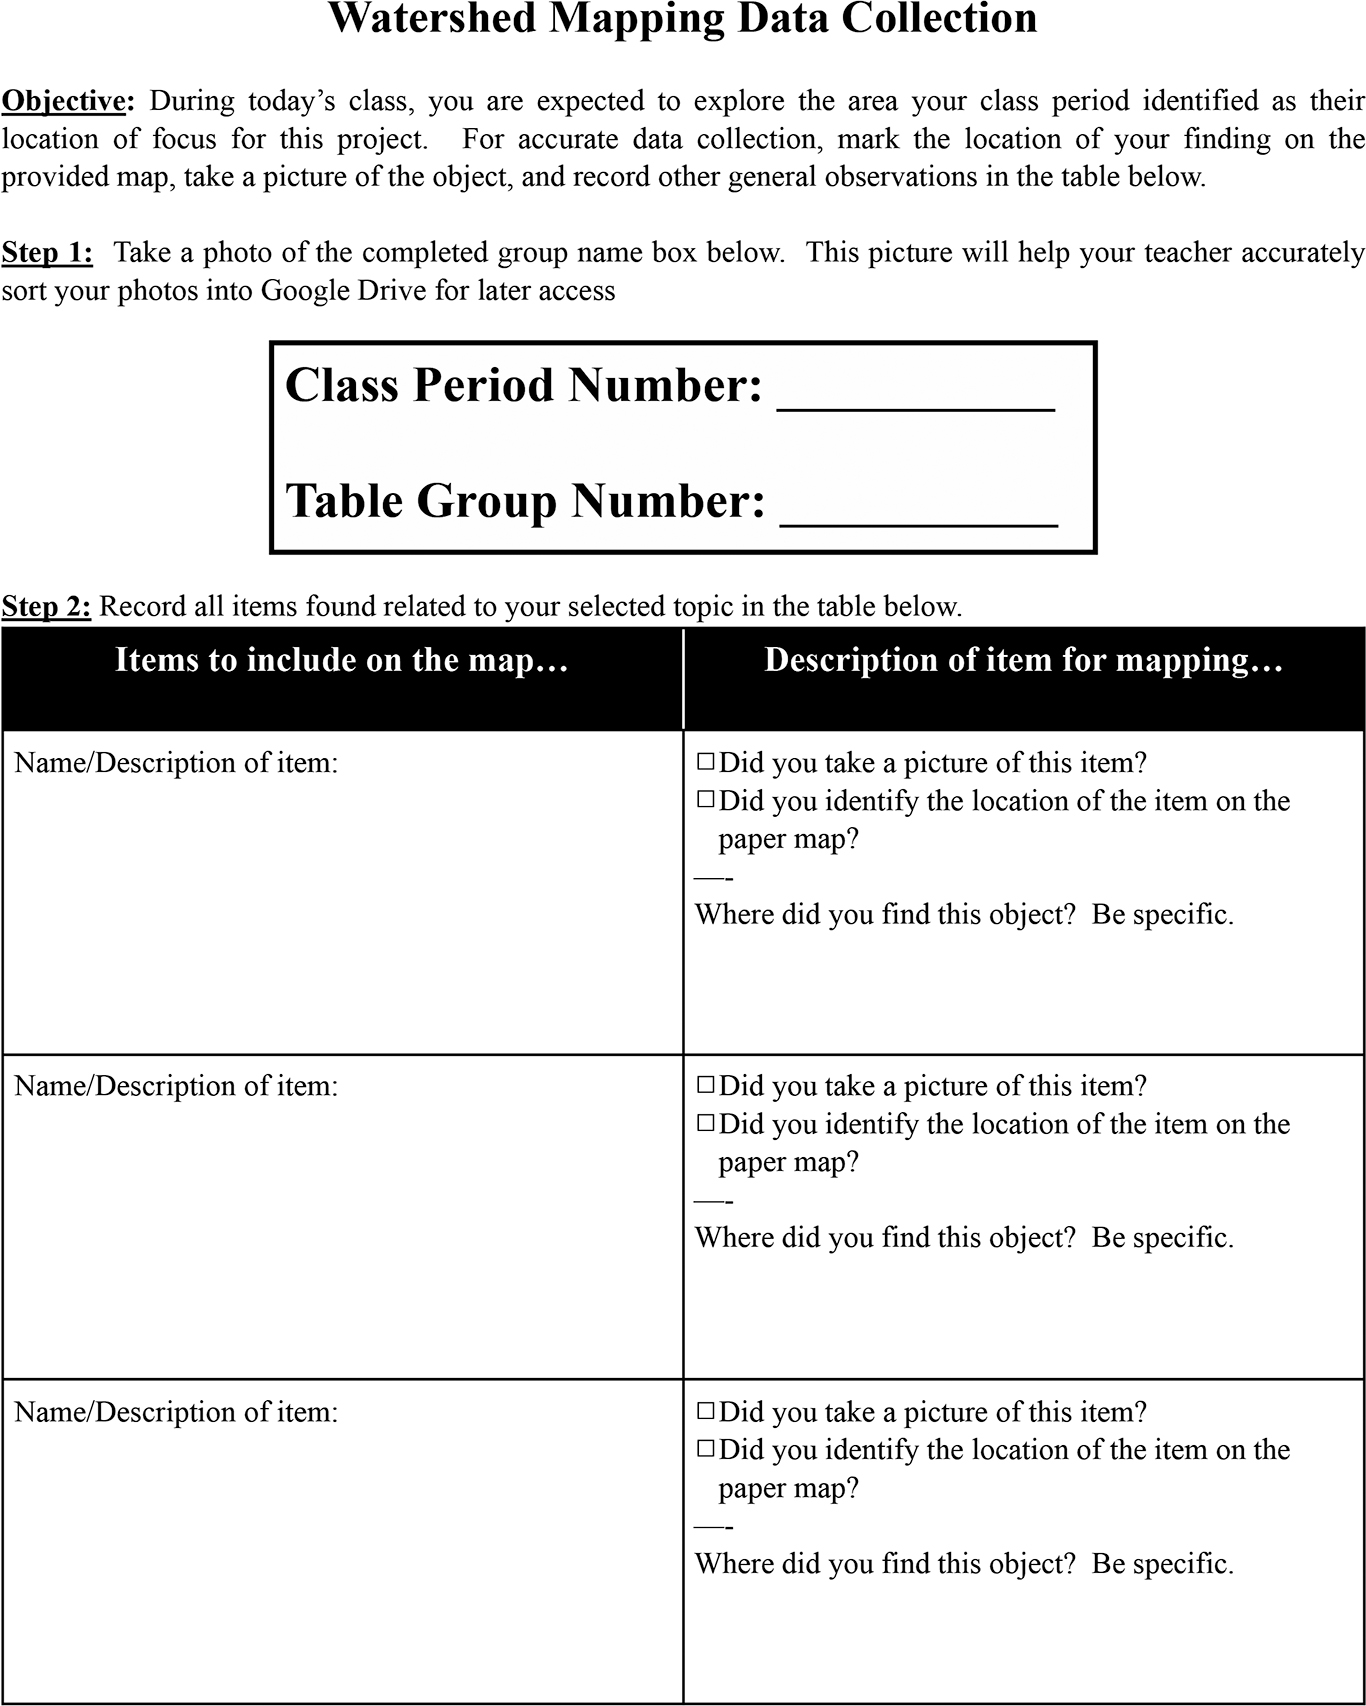
As participatory mapping emphasizes the importance of incorporating community voice, it was important that I allowed my students to determine what was relevant to their investigation of water quality within the scope of their class topic. The class period exploring point and nonpoint pollution sources along the unnamed stream, for example, photographed pieces of trash found along the bank and marked the location of each item on the paper map. Later, while working in table groups to document schoolyard evidence relating to their selected class topic, students combined these observations into one Google My Map layer.
To make data collection easier, ensure that each group has access to a camera by borrowing from the library media center or allowing use of student devices (cell phones, iPods, digital cameras). Discuss this project with your technology director, as he or she may be able to assist you with accessing additional technology for data collection. For example, my students were able to collaborate with the school superintendent to use a drone to capture aerial images of the property. The recording of student observations and photographs provided an additional opportunity for formative assessment, as I was able to quickly evaluate real-life conceptual understanding through these written descriptions and items selected for photographic evidence. For example, when developing written observations for photographed examples of pollution, students would occasionally insert a conjecture as to how a piece of trash may have ended up in the stream. These opinions showcased student critical thinking about the movement of water or human action, but also identified an opportunity for me to review the nature of nonpoint source pollution (i.e., we cannot easily identify the origin of the observed pollutants).
To enhance student learning and data quality, class periods collaborated with a representative from the county soil and water conservation district. To arrange this opportunity, I e-mailed the soil and water conservation district’s education coordinator outlining the goal of the project and my interest in hands-on student data collection. The representative was eager to provide specific content support, which included the use of a physical model to help students better understand pollution sources, conducting water quality and sedimentation testing, and performing kick-net tests to investigate macroinvertebrate species within the identified stream and retention pond.
When designing your own participatory mapping project, I encourage you to reach out to relevant local organizations for content and data collection support. For outdoor education projects, your county soil and water conservation district, regional Environmental Protection Agency office, state university extension, or state department of natural resources would be great places to begin your network of contacts. In reaching out to these organizations, I found it helpful to identify the education coordinator and to present my ideas in written form via e-mail. I have often experienced that these representatives are eager to collaborate with school districts, have ready-made resources, and are able to share additional contact or programming ideas.
Days 8–10: Participatory Google My Map development
To facilitate the development of the Google My Map, I uploaded all student photos to a shared Google Drive at the end of the data collection period. As we used school digital cameras for this project, I uploaded student photos to Google Drive by inserting the SD cards into my laptop. If using cell phones/iPods/iPads, students could individually upload pictures directly to Google Drive from the device. Class periods then worked collaboratively in table groups to add data points to the Google My Maps document, with each class selecting a pin color to identify specific areas of focus. All blue pins on the map, for example, indicated the location of an area of erosion and included a student photograph and written description (see Figure 3 for sample student entries). With each class developing one layer of data, the collaborative map explores the impact of our schoolyard through four different perspectives. As this map was developed to be shareable with others outside our classroom, student groups were given daily feedback for necessary spelling and clarity issues. At the end of each class period, I reviewed group posts to the Google My Maps and recorded feedback in a word processing document. This feedback was then printed and distributed to students at the start of the next class period. With the printed document, groups were able to work collaboratively to make corrections and check off each item upon completion. This daily review of map data points also provided another opportunity for formative assessment.
Summative assessment
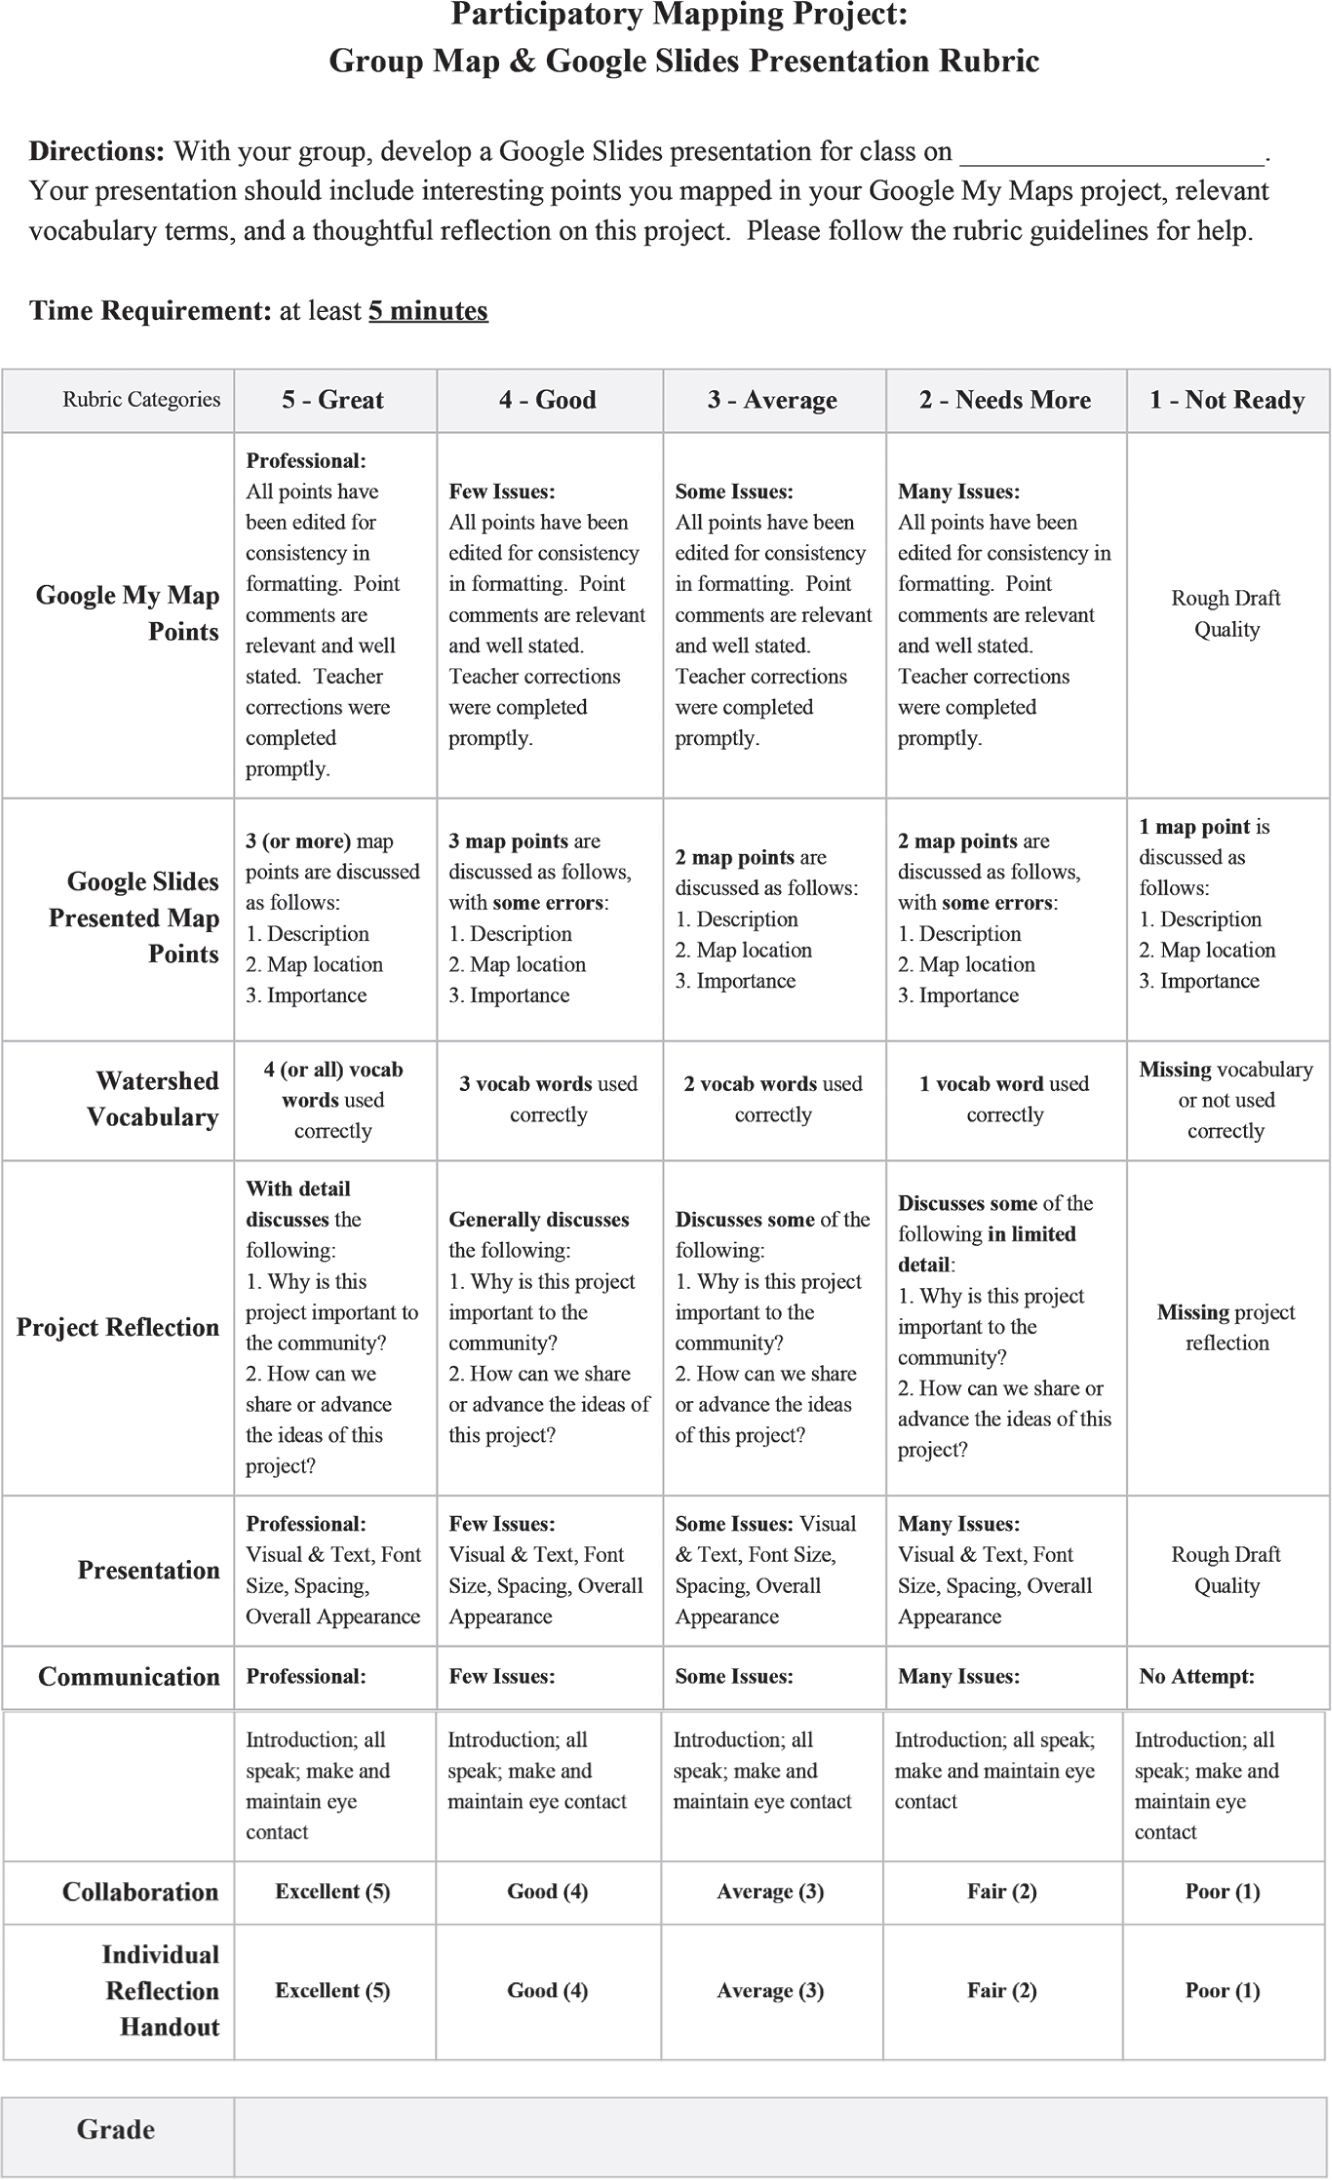
Student understanding of the human impact on water quality was formally assessed through the development of a Google Slides presentation by each student group. Presentations needed to include a detailed discussion of at least three interesting points added by the group to the Google My Maps project, appropriate incorporation of relevant vocabulary terms, and a thoughtful reflection on the project and its importance to the community. An OrangeSlice rubric (a Google Docs add-on) was developed to generate a summative score for each student that considered the addition of Google My Maps data points, presentation discussion, and individual reflection handout (see Figure 4). For developing your own OrangeSlice rubric, this add-on may be found by searching the “Add-On” menu in the Google Docs toolbar. When grading, this add-on will open a sidebar that allows you to grade directly in your custom rubric as you scroll through student work. The completed rubric and teacher comments are inserted into the student work, with the final score indicated. For help creating an OrangeSlice rubric, YouTube tutorials are available to assist with initial rubric development (see Resources).
Accommodating student learning needs
Throughout this project, students worked in mixed-ability table groups, allowing for a supportive and collaborative environment. At each stage of the project, students were expected to participate actively by fulfilling a daily group job. These jobs included a writer (recording brainstorming ideas or observations), a photographer (collecting map data point evidence), an online contributor pinning Google My Maps data, a slide creator for the Google Slides presentation, and a proofreader. Daily feedback provided students the opportunity to address areas needing improvement, and the extended time frame supported all students in their completion of project requirements. Though no students participating in this project had a physical disability, the collaborative and flexible nature of participatory mapping supports individualized modifications while maintaining meaningful peer engagement.
Reflection
Although this project clearly addresses the ecological concern of watershed health by evaluating pollution, runoff management, land use, and erosion, my students’ reflection responses suggested recognition of the social impact of this issue. When asked why this watershed impact map was important, students suggested that it might help community members understand how they can limit their watershed impact, particularly when applying fertilizers to lawns and fields. Such student responses highlight the important social aspect of maintaining watershed health and a growing interest in community engagement, as related to the social and ecological issue of watershed health.
Seeing the curiosity and critical collaborative thinking skills develop in my students throughout this lesson, participatory mapping became my gateway experience to meaningfully and confidently engaging them in their community. Since completing this participatory mapping project, my students have continued to explore their schoolyard through lessons on nature photography, additional water quality testing, and exploration of our retention pond as a developing wetland environment. The simple step of reaching out and establishing a connection with the county watershed education coordinator has allowed me the opportunity to integrate into my curriculum additional hands-on learning opportunities and to view our community from a different perspective.
Connecting to the Next Generation Science Standards (NGSS Lead States 2013)
- The chart below makes one set of connections between the instruction outlined in this article and the <i/>. Other valid connections are likely; however, space restrictions prevent us from listing all possibilities.
- The materials, lessons, and activities outlined in the article are just one step toward reaching the performance expectation listed below.
Standard
MS-ESS3 Earth and Human Activity
www.nextgenscience.org/dci-arrangement/ms-ess3-earth-and-human-activity
Performance Expectation
MS-ESS3-3. Apply scientific principles to design a method for monitoring and minimizing a human impact on the environment.
Connections to the Common Core State Standards (NGAC and CCSSO 2010)
ELA/Literacy
CCSS.ELA-LITERACY.RST.6-8.7: Integrate quantitative or technical information expressed in words in a text with a version of that information expressed visually (e.g., in a flowchart, diagram, model, graph, or table).