
feature
How Hot Is It?
Primary students practice reading thermometers to investigate weather
Learning about the weather is always fun for students. Even the youngest of learners have experienced rain, sunshine, heat, and cold. Children know that sometimes it’s warm enough to run around outside barefoot, and at other times they must wear a jacket to go outside to play. Weather is always around us, and observing and recording weather patterns allows children to better understand the world they live in.
Science standards suggest students begin observing and recording weather conditions as early as kindergarten. This can be as simple as documenting cloud cover and sunshine, but by the end of elementary school, students are expected to have developed sophisticated skills of analyzing and predicting weather patterns. During the K–2 years, it is recommended that students understand that, “Weather is the combination of sunlight, wind, snow or rain, and temperature in a particular region and time,” and that, “people record weather patterns over time” (NGSS Lead States 2013). While Next Generation Science Standards (NGSS) for weather observations start in kindergarten, we presented this lesson to first graders to meet our state standards for science (which includes reading thermometers), and also to tie to our first-grade math curriculum. Working with the thermometers helped reinforce math skills for developing number sense with numbers up to one hundred.
To observe and record temperature, students must first know how to read a thermometer. While there are different kinds of thermometers for exploring heat energy, we started students with reading a liquid tube thermometer for this investigation. Observing a traditional thermometer rise and fall with temperature helps students understand that hot things expand and cool things contract, a prerequisite for later understanding how hot air expands and rises to form areas of low pressure, while cold air contracts and sinks in high pressure systems. This is also an important foundational idea for understanding energy, which is emphasized in the NGSS as a specific crosscutting concept.
The format we used is the 5E Instructional Model (Bybee et al. 2006), in which students activate prior knowledge and build experiences before introducing vocabulary or explaining science concepts. What follows is an overview of the instructional activity we implemented to introduce our students to the concept of measuring, collecting, and recording temperature data as part of our unit on weather. The activities introduced here involved approximately one week of instructional time. However, the application of the skill learned was a valuable and important part of reading and recording temperatures for the remainder of the school year. Table 1 summarizes the activities and guiding questions asked at each stage of the 5E Instructional model, including differentiation strategies that can be implemented throughout the lesson.
Safety Precautions
- Use alcohol (never mercury) thermometers with students. All mercury instrumentation and mercury compounds need to be removed from labs appropriately. There are mercury thermometer exchange programs at the local and state levels, commercial hazardous waste vendors, and science laboratory equipment/supply houses.
- Select thermometers in which the glass tube is firmly embedded in a plastic casing. The liquid inside is ethyl alcohol and not dangerous to touch, but if an accident occurs, make sure that the liquid does not get into eyes or is not ingested.
- Make sure the warm water used in the Explore stage is not hot enough to scald students. “Bath” temperature is plenty warm enough for observing the thermometers.
Engage
We introduced our unit by presenting students with a hand boiler, which is a toy filled with liquid in a curved glass tube. When one holds this toy, the fluid inside begins to evaporate, causing the liquid to rise up the tube. This really got the attention of our first graders, who exclaimed, “It’s Magic!” They observed the liquid bubbling up and down the tube as the bulb was held and released in our hands. Because the glass is so fragile, we recommend this as a teacher demonstration, rather than allowing students to hold it.
We then introduced something more familiar, a thermometer, to activate prior knowledge and move the lesson forward. Students recognized the thermometers and explained that they tell “how hot” they are but didn’t mention their use as a weather instrument. We asked how the thermometer was like the hand boiler and how it was different. Students responded that both have colored liquid and a glass tube, and the liquid “goes up” the tube. However, the hand boiler has a curly section while the thermometer tube is straight, and only the thermometer has numbers. They were unable to explain how the thermometer works.
Explore
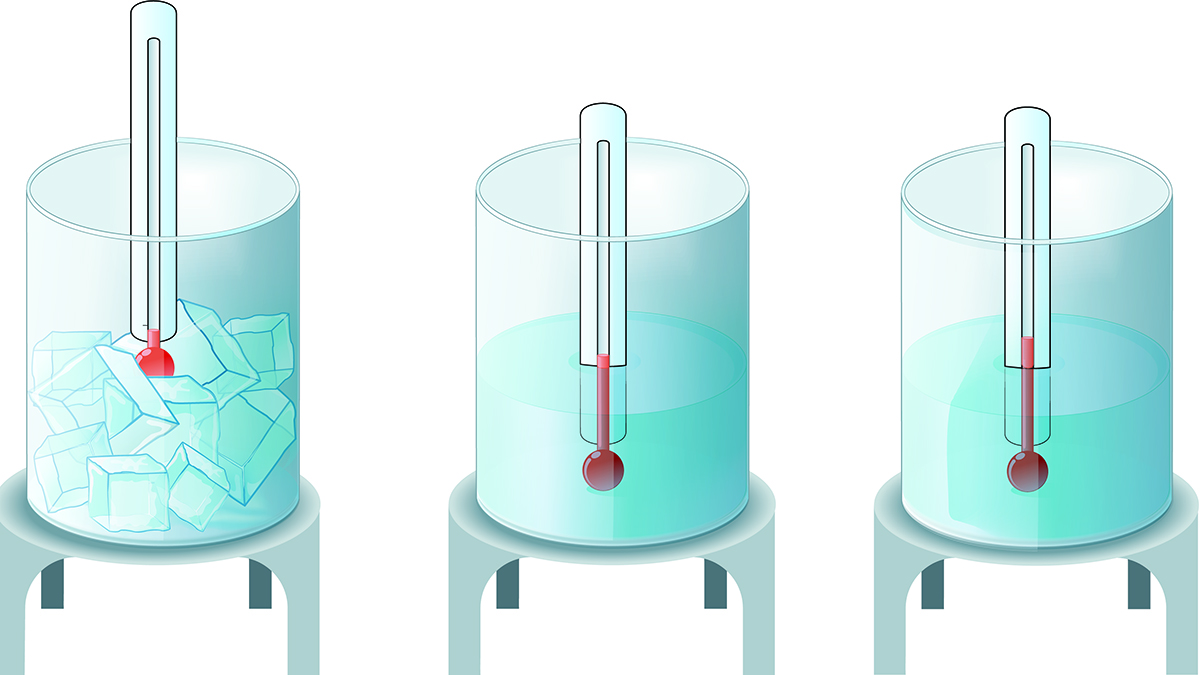
For students to understand how a thermometer works, they must be able to observe thermometers in use. To give our students this experience, we provided cups of water at different temperatures and large outdoor thermometers to explore the effect of temperature on thermometers. We chose thermometers with big numbers for tiny hands (https://tinyurl.com/yxbdzmls) and made certain they were appropriate for outdoor use, as we continued using these same thermometers in the activities that follow. We used ice water in one cup, room temperature water in a second cup, and in the third and final cup, we used warm water. At each table, students were given the three cups of water and a thermometer and asked to observe what happened when they put the thermometer in each cup, and what happened when it was moved from cup to cup. To help students identify what type of water was in each cup, we placed the three cups on a piece of paper with three different sections. The first had a graphic of an ice cube with the word “cold,” the middle column had a picture of a cup with water and the words “room temperature,” and the third section has a picture of a cup showing lines rising from the top with the word “warm” (see Figure 1). Students noted that the liquid in the tube changed as it moved from cup to cup, and that in the warm water the liquid rose in the tube, as it had in the hand boiler; cold water caused the liquid in the tube to “go down.”
It is important to remember during this stage that students are exploring and building a conceptual foundation for understanding how thermometers can be used to measure temperature. Be sure to ask guiding questions to help them understand how thermometers work, building on the crosscutting concept of cause and effect. It isn’t important at this stage that students be able to answer all questions asked but that they become aware that there are numbers on the thermometer and that they do serve an important function.
To guide learning and provide a means for formative assessment as the lesson progresses, this is an excellent time to start an anchor chart to conceptualize student experiences and assist them in making the leap to understanding the science terms and concepts that will be developed throughout the lesson. List what students have discovered about thermometers and how they work. Include an illustration of the parts of a thermometer and their observations. Adding to the anchor chart as students’ progress through the lesson can serve as a valuable formative assessment.
Explain
Once our students had a concrete experience with thermometers, it was time to explain how they work. To help students construct their own explanations based on observations, this is the time to provide vocabulary and key terms to put their experiences into scientific terminology. As our students described what they observed, we asked questions (see Table 1) and reinforced causality by explaining that when the water was cold, the liquid in the thermometer contracted and went down in the tube. We then asked what caused the liquid to expand and rise to which they responded, “when it got hot.” We then explained the terms expand and contract to describe how the liquid moves up and down the tube and had students act out these new words with hand and arm movements to reinforce the vocabulary.
At this point, our students were ready to be introduced to how to read a thermometer. Our students asked what the “F” and “C” were for and how the numbers provide information about temperature. While not the focus of our lesson, we explained that the “F” and “C” represent two different ways of measuring how hot or cold something is. We introduced the terms Fahrenheit and Celsius and explained that while Celsius is the scientific way of measuring, Fahrenheit is the scale that our students will hear used most often to measure temperature. We then introduced how to read a thermometer by using the height of the liquid in the tube and the corresponding numbers to provide us with temperature information for measuring and analyzing weather data as required by our state standards.
Helping students to build conceptual knowledge by explaining their own experiences and using correct vocabulary will build a long-lasting and scientifically appropriate understanding of the concept. Reinforcing by reading nonfiction books will help tie in reading skills for informational text. Therefore, we expanded our students’ understandings using different modalities, including both a short video about how thermometers work (see Online Resources) and the book, Temperature: Heating Up and Cooling Down by Darlene Stille (2004). Before moving on, be sure to add information to your class anchor chart to formatively assess students’ new understandings of the concepts and skills presented.
Elaborate
During this stage of the 5E Instructional Cycle, students practiced what they learned. Our students engaged in a variety of activities to help them build on their new understandings and to meet the performance expectations identified in the standards. First, we introduced “demonstration thermometers” to give students practice reading thermometers. While these can be purchased online, we found large, inexpensive and student-friendly versions at the dollar store that were a hit with our students. A creative teacher could also create these out of cardboard and ribbons! Students were paired up to set and read their thermometers by quizzing their partners. We first modeled the activity and then released them to practice. We found that since there are a lot of numbers on the thermometer, including a range of numbers that they didn’t yet have number sense to understand, students were asked to read the temperature to the nearest 10 degrees. Later in the year or with more advanced students, it might be appropriate to read accurate temperatures by counting lines between the 10-degree intervals on the thermometers.
After students had practiced reading a thermometer in pairs, we had them do a “Measure the Room” activity for additional practice and as a formative assessment. Thermometer graphics were printed with various temperatures indicated, and then hidden around the room. Students participated in a scavenger hunt activity in which they had to find and read the thermometers. Our students were engaged and demonstrated that most were able to independently read a thermometer to the nearest 10 degrees. This activity allowed us to see who needed more practice and if there were any misconceptions evident.
The performance standard indicates that students should measure and record actual weather conditions, and by this point we felt confident that students were ready to apply their skills in real-world applications. We installed a thermometer outside the classroom window where students could observe and record the temperature each day. Every morning, students checked the temperature, filled in the thermometer on a class chart, and wrote in the actual temperature indicated. As a class, we created a tally chart to track temperature ranges for the month, and a histogram to show trends in temperature ranges over a period of time, which integrated with skills we were learning in math. Eventually, students will compare monthly charts from different seasons to identify weather patterns throughout the year. You may prefer your students create a line graph to chart data over time, but for us, the histogram was the better chart to reinforce the math skills we were working on at the time.
Evaluate
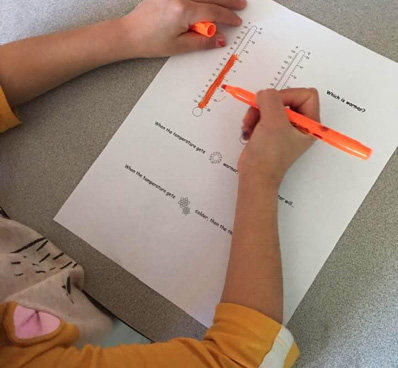
While we were formatively evaluating students at each stage of instruction through questioning and updating the class anchor chart, we also introduced an additional evaluation once we felt they had mastered reading the thermometer. In this activity we provided students with a handout of two different thermometers and asked them to color in the image to indicate two different temperatures. Students had to compare the two temperatures and construct an explanation of what would happen to the thermometers if the temperature got hotter or colder. Students responded by describing that, “the liquid is higher up the tube when it gets hot,” and compared number values, such as “70 is bigger than 10.” By reading student responses, we were able to determine that students understood how thermometers work and how to read them. While explanations didn’t reflect an understanding of Fahrenheit vs. Celsius, the groundwork has now been laid for building toward that advanced concept.
Our learning goal was for students to observe, record, and track daily temperature readings over time. This correlates to our state standard, which calls for our students to observe, measure, and record weather data with simple instruments. As a summative assessment of this goal, our students kept a record of temperature observations individually for several days after we completed our whole-group investigations. Students were expected to read the thermometer each morning as they arrived and record the data in their science journals along with comments about other weather conditions such as clouds and precipitation. At the end of the week, they were expected to summarize the weather conditions and how they changed throughout the week. We evaluated student progress by evaluating whether the student was able to (1) make observations about weather conditions including temperature, cloud cover and precipitation, (2) describe variations in temperature and weather conditions that occurred during the week, and (3) Support their claim about weather variations during the week using data collected.
Extending the Lesson
In many ways, we extended students’ understanding of temperature. We discussed the temperature at the poles while working on a research project about Arctic animals, what a thermometer would do there, and what the cold would feel like. We also showed students the weather app on our cell phone and pulled up the temperature randomly throughout the course of a single day to observe changes. We also gathered temperature data from other places as some of our ELL students are very interested in what conditions are like in other countries.
While collecting data over extended periods of time, we switched from tube to digital thermometers and used weather apps to investigate temperature variations during the day. However, because students started with the tube thermometers, we feel they had a much better understanding of the data they collected once this transition was made, such as relative temperature ranges for hot and cold. Long-term data collection allows for identifying seasonal patterns; however, for the scope of this lesson, we were limited to data collection during a single season.
During the course of instruction, we feel our students met our learning goal, which was to learn to read a thermometer as a practical application in studying weather patterns. Our students are now ready to move on to more advanced concepts with weather, and to learn about energy as they begin exploring heat transfer in future grades. ●
Online Resources
Reading a thermometer video for children to learn www.youtube.com/watch?v=Q48kxEzwubQ
Donna Governor (donna.governor@ung.edu) is an assistant professor of science education at the University of North Georgia in Dahlonega, Georgia, and Amanda Carter is a special education teacher at Colbert Elementary School in Madison County, Georgia.
5E Earth & Space Science Elementary