
feature
Making Sense of Apparent Brightness
An integrated approach for fifth graders
Science and Children—November/December 2022 (Volume 60, Issue 2)
By Alexis Kaczor, Laura Robertson, Jamie Price, Lindsay Lester, and Ryan Nivens
Most teachers will admit to enjoying teaching some standards more than others—and maybe even a little bit of dread at certain times of the year. In fifth grade, we found teaching the standard on the apparent brightness of the Sun (5-ESS1-1) to be a challenging and frustrating experience due to the abstract nature of the standard and generally low interest of our students. Even though we had previously used hands-on learning activities involving flashlights to model the phenomenon, the results were less than stellar. However, all of that changed when we decided to integrate math standards on graphing points in the coordinate plane (5.G.A.1 and 5.G.A.2) and added a claim, evidence, and reasoning (CER) response. The result was a lively analysis of data in a real-world context, thoughtful discussions about word choice when making observations, and engaging arguments from evidence. Now we look forward to this standard and our integrated approach every year.
Day 1 (45 minutes)
Conducting the Activity
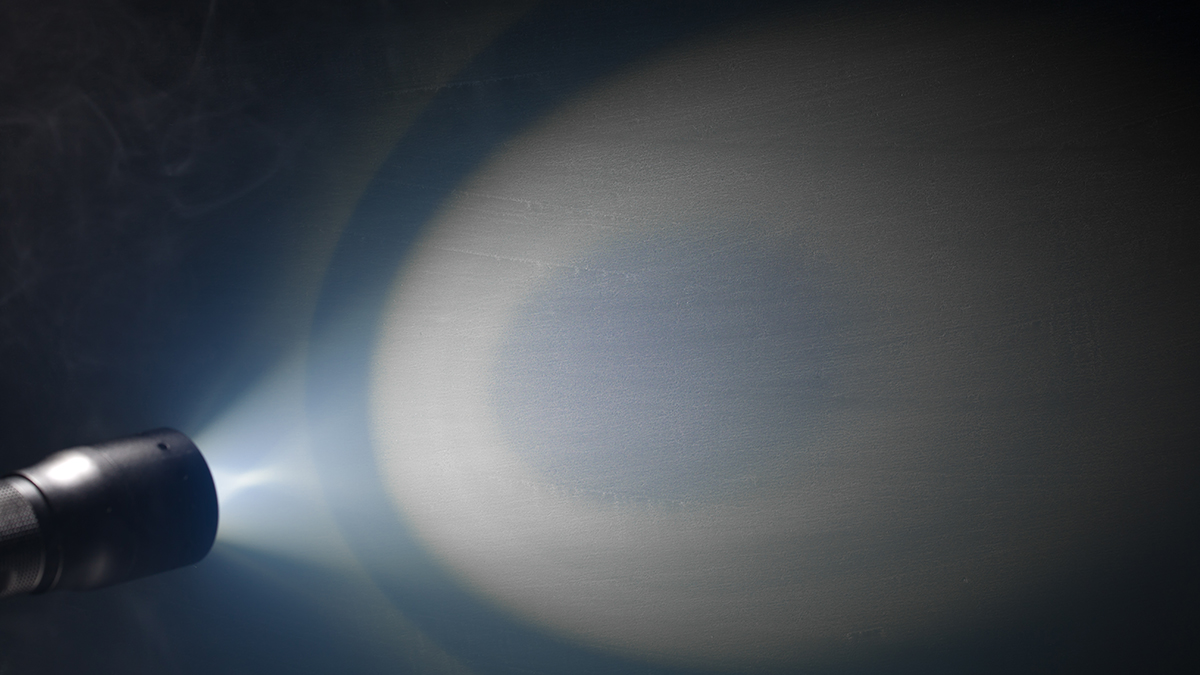
To begin our investigation of apparent brightness, students conducted a lab in which they observed the change in the diameter of a beam of light as a flashlight was moved away from the wall (see Figure 1). The materials for this lab were low cost and easy to gather (see Figure 2). Instead of using rulers or measuring tapes, we opted to use paper rulers with quarter-inch markings. This allowed students to focus on the areas we wanted to emphasize (i.e., data collection with the purpose of graphing ordered pairs in the first quadrant) and not get slowed down by issues of measurement precision. We went over the directions for the lab together and asked students to share their predictions orally for what they thought would happen.
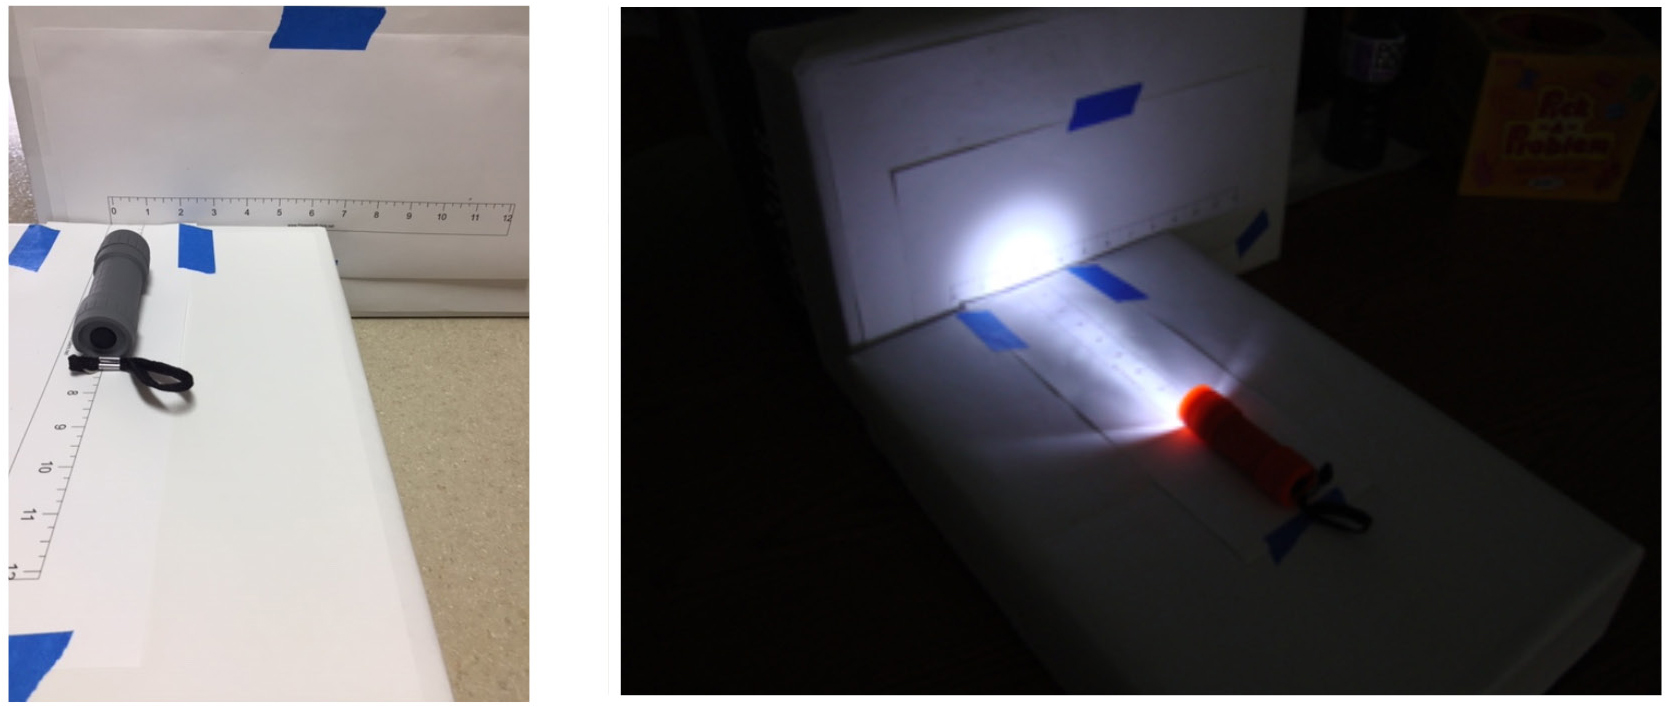
Lab setup.
Materials list (per student group).
- Flashlight
- 2 paper rulers with quarter-inch markings
- Tape
- Textbook (to prop up flashlight)
Safety First!
Keep the flashlights pointed at the wall and away from eyes and faces.
After a reminder about working with the flashlights safely and keeping them pointed at the wall and away from eyes and faces, the students worked in small groups of three to four to conduct their experiments and collect data. Students set up their labs on the floor around the classroom, and we turned off the lights and closed the blinds to make it easier to measure the diameter of the beam of light. Our classroom has molding around the base of the wall, so students placed a textbook (or two) under their flashlights in order for the light to hit a flat surface.
We noticed during the lab that some student groups struggled to control variables such as keeping the flashlight aimed straight at the wall and removing other objects from the path of the light (e.g., lab sheets and other items on the classroom floor). Rather than intervening with suggestions or questions that could guide students to correct these issues, we deferred to the students’ collaborative methods and noted our observations for the upcoming discussions of data. We made another important observation as we circulated around the room, asking students about their predictions and how those compared to what they were observing. We noticed that many students would alternately use the words bigger and brighter when describing what was happening. We made plans to address this on the following day when we analyzed the data.
Day 2 (45 minutes)
Integrating Math
Since the students were new to graphing points in the coordinate plane, we began day 2 with a discussion about how to graphically represent data that has two numerical variables. By building on students’ prior experiences graphing categorical data, we had a lively discussion about what to do when we have two numbers to graph. We also asked students what kinds of data displays they had seen that would be helpful in representing the data from the flashlight lab. As a group, the students agreed that a graph that had two sets of numbers (i.e., numbers on the x- and y-axes) would work for their data.
We passed out graph paper with prelabeled number lines for the axes but had the class discuss how to label our axes using the headings from their data tables. We made sure that all students had the independent variable (distance from the wall) on the x-axis and the dependent variable (diameter of the beam) on the y-axis. Then we modeled for students how to count over on the x-axis and up on the y-axis to graph a point. Students then plotted their data on their graphs.
We took pictures of some students’ graphs and displayed them on the board for the class to analyze and discuss (Figure 3). We began the analysis by asking students to show what points on the graphs meant using the flashlights and rulers from the lab. If we pointed to a point on the graph, students would move the flashlight a certain distance from the wall and explain what the resulting diameter of the beam of light was. In this way, students moved back and forth between physical and graphical models of the lab data and made connections to the real-world scenario that the data represented. We then asked students to put their hands in the air and “trace” the shape of points on each graph starting on the left and moving to the right. When we asked students to describe the overall pattern in the data, one student succinctly summarized it by saying, “Generally, the pattern is that it goes up” while making a motion with his arm tracing the shape of the line. Students noted that the graphs all looked a little bit different and some graphs had “bumps” and “flat lines” that differed from others. One student added to the discussion that “there were probably differences in how each group collected their data, but we still saw the same pattern in the graphs.”
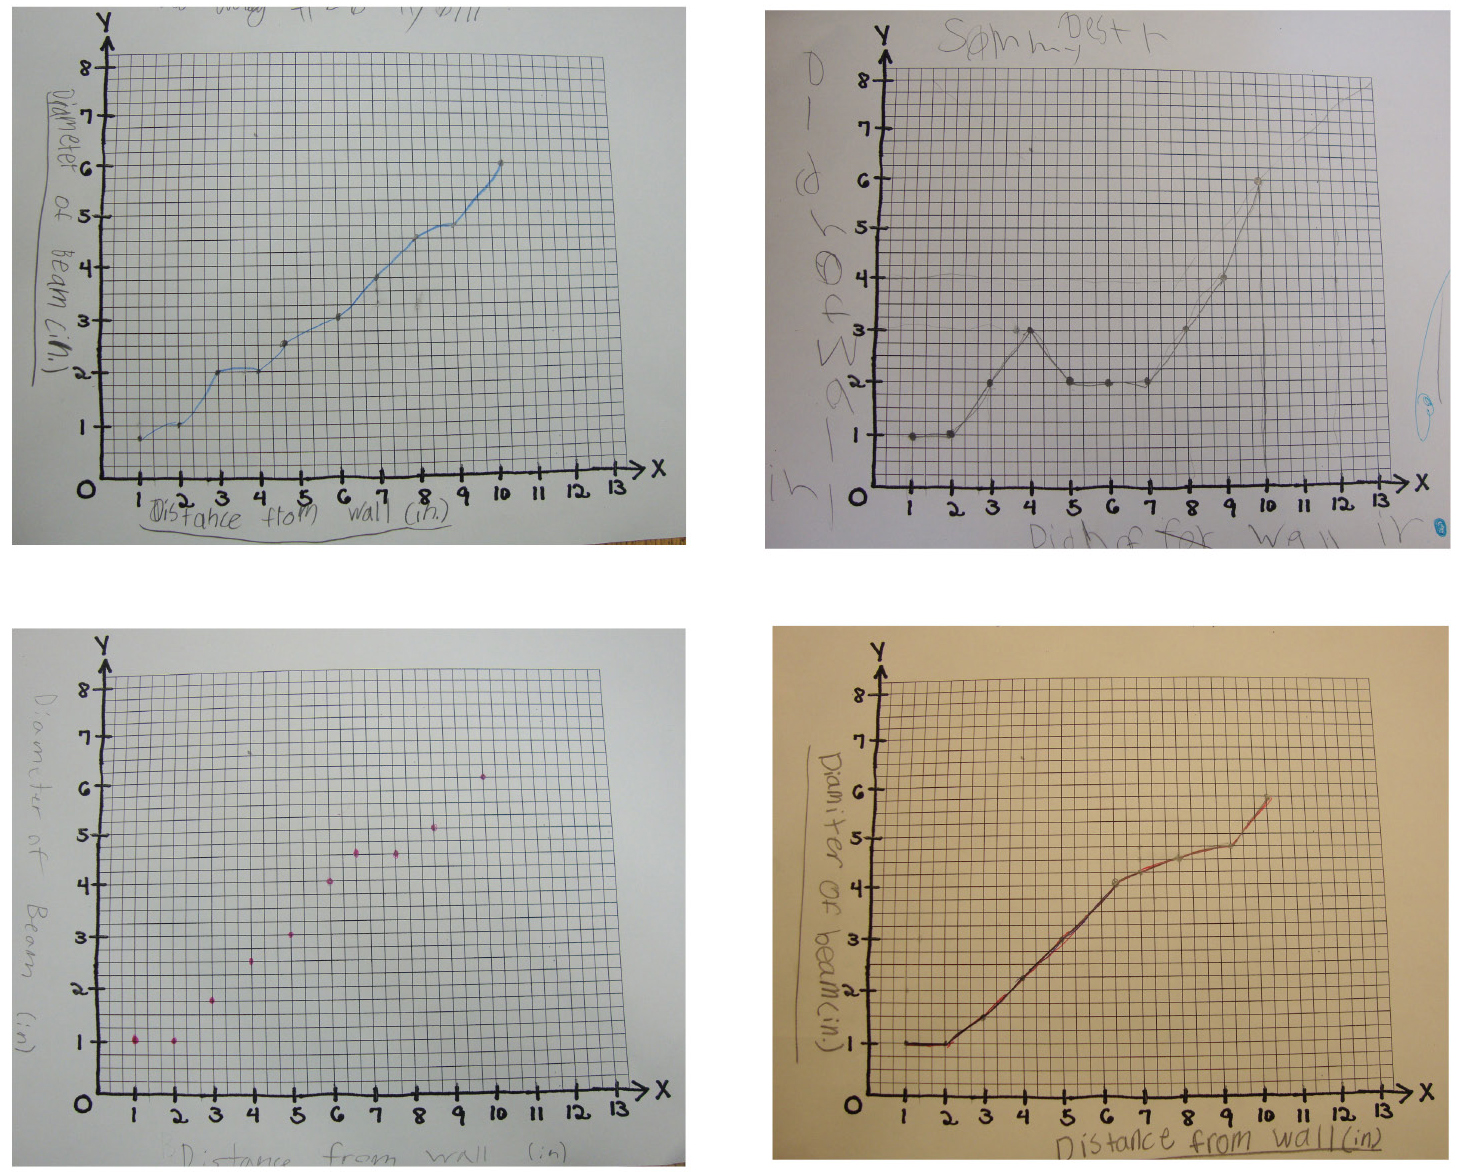
Sample student graphs.
Focus on Academic Language
Our next step, after graphing the data and describing the pattern on the graphs, was to add language to describe the phenomenon that students observed during the lab. While listening to students talk during the lab on the previous day, we realized that students needed help describing what they were seeing. Students frequently used both terms bigger and brighter in reference to what was happening to the beams of light as the flashlights moved away from the wall. To help students articulate their observations, we offered them two statements and asked them which one they agreed with and why. The statements were
- If the distance to the light source is closer, then the light source appears brighter.
- If the distance to the light sources is farther, then the light source appears brighter.
We encouraged students to work in small groups and use the flashlights at their tables to help them decide. Once again, students had a lively discussion in their small groups demonstrating the phenomenon and discussing what was happening. The students came to a consensus that the light appeared brighter when the flashlights were closer. At this point, we introduced the vocabulary term apparent brightness, giving a definition of the term and showing an example using a picture with stars of varying brightnesses. We talked about how stars giving off the same amount of light might appear brighter or dimmer based on their distances from Earth. Students made the connection that their flashlights in the lab represented a “star” and the wall represented “Earth” to help them solidify their understanding of apparent brightness.
Engaging in Arguments From Evidence
The final step for students was to generate a CER response based on their data. We used the strategies of Zembal-Saul, McNeill, and Hershberger (2013) to scaffold this thinking and writing for students in a step-by-step manner and continued having students use lab materials to make concrete connections to the data in their graphs. For each part of the CER response, we used a combination of small-group and whole-group discussions to clarify student thinking prior to writing. We included prompts to guide students’ thinking and provided optional sentence frames for students to use (Figure 4). We encouraged students to use their own words, but the sentence frames were available for those who needed them.
Claim, evidence, and reasoning prompts and sentence frames.
Claim (Write a sentence that explains how the distance from a light source affects its brightness.)
If the distance of the light source is __________________ (closer/farther away), then the light source appears __________________ (brighter/dimmer).
Evidence (Provide evidence from the data on your graph that supports your claim. Include measured distances from the wall and the diameter of the beam. Describe what happened when you moved the flashlight closer to or farther from the wall.)
When the flashlight was ______ inches away, the diameter of the light beam was ______ inches.
However, when the flashlight was ______ inches away, the diameter of the light beam was ______ inches.
Reasoning (Explain how your evidence supports the claim. Describe how the brightness of a star is
affected by its distance from Earth.)
When there are two stars giving off the same amount of light, the one that is closer to the Earth
appears ____________________ (brighter/dimmer) than the one that is farther away. This is
called __________________________.
The students were animated and accurate in constructing their claims from evidence. Students correctly stated a claim about the relationship between distances of a light source and the effect on brightness. Likewise, during the discussion of evidence, we asked students why including only one point of data would not be enough. One student responded, “We need two data points in our evidence so that we can compare them.” Almost all students used the sentence frame for the reasoning portion of the CER. It is typical for students to struggle the most with the reasoning as it requires the most complex thinking to explain how the claim and evidence are connected with a science context. In this case, we wanted students to use the term apparent brightness to describe the phenomenon that had been observed.
Conclusion
Up to this point, our discussions with students about apparent brightness had not involved the Sun. We had only used an image of the night sky in which stars of varying brightness could be seen; however, we were delighted when one student asked, “Is that why the Sun is so bright—because it’s really close?” This student’s keen observation reinforced for us the value of an integrated approach to elementary science in which math, science, and language combine to support student learning in real-world contexts.
Alexis Kaczor is a second-grade teacher at Centerview Elementary School in Newport, Tennessee. Laura Robertson (robertle@etsu.edu) is an associate professor of science education, Jamie Price is an associate professor of math education, Lindsay Lester is the library media specialist, and Ryan Nivens is a professor of math education, all at East Tennessee State University in Johnson City, Tennessee.
Download the lab sheet at https://bit.ly/3F5ismf.
Astronomy Earth & Space Science Physical Science Elementary Grade 5