
feature
Shining a Light
Fifth graders delve into the nature of science and technology by investigating the stars
Investigating stars can be difficult. First, the stars are not typically out during school hours. Second, the concepts related to stars are inherently abstract. This five-day unit is designed for fifth graders to work toward Next Generation Science Standard (NGSS) performance expectation 5-ESS1-1, with each lesson lasting about 30 minutes. Students investigate the relationship between the brightness of light and distance, apply their investigations to stars, and analyze data of stars’ apparent and actual magnitude. We leverage these activities to help students further their understanding of the nature of science and technology (NOST). NOST includes understanding how science works, what scientists are like, what technology is, technological trade-offs, and how technology shapes thinking and behavior (Kruse and Wilcox 2013).
Day 1: Exploring Technology
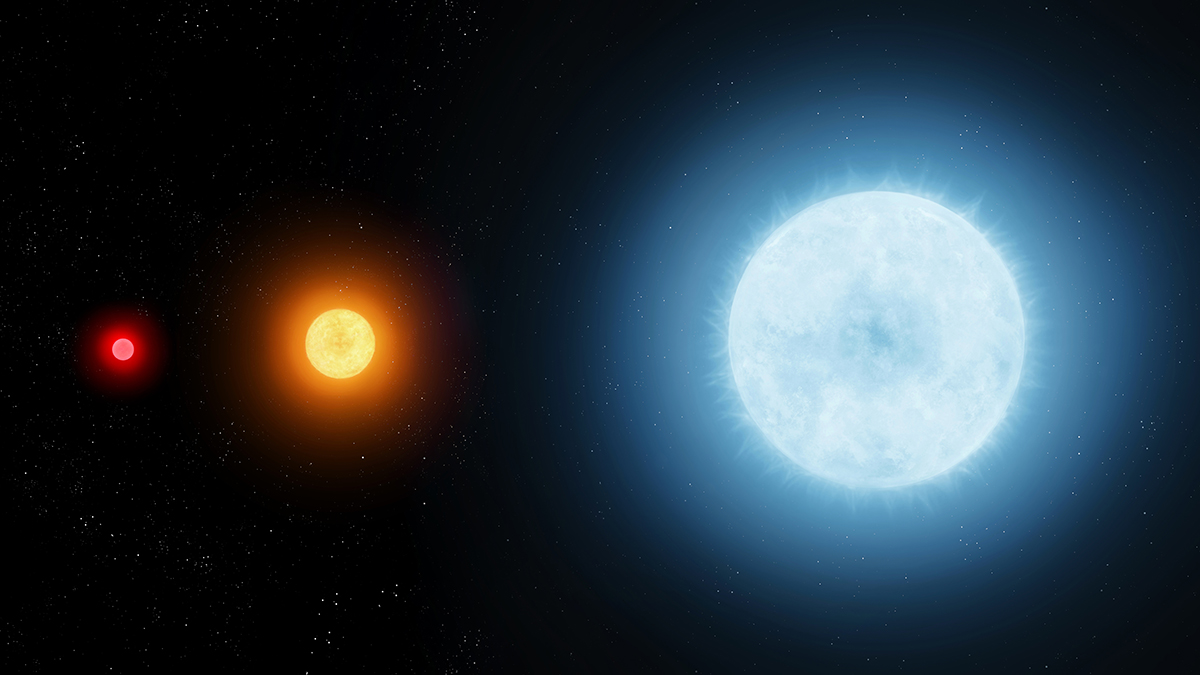
We begin by viewing an image of a city at night. We found our image with a simple internet search of “the night sky.” As students observe, we ask, “What are the different sources of lights that you notice?” Students describe a bright light as “closest to them.” We engage students by asking, “How do you know the light is closest to you?” Students respond that the light is bigger. When students propose distance to be a factor we ask, “How could we investigate if distance affects how bright a light looks?” Students work in groups to problem-solve how they could go about investigating this question. We help them by asking, “What materials will we need?” or “How will you write down what you see?” Students come up with paper, measuring tapes, and lights as supplies. In our classroom, students decided to stand at different distances and shine bike lights at two different pieces of paper taped to the wall.
After they feel confident with their investigation plans, we start discussing the nature of science and technology. Engaging students in these conversations help them start to think about how scientists work. We ask students “Why is it okay for a scientist to start out their investigation before they know how it is going to end?” Students might respond with “to see if their idea works,” and “they will find out along the way.”
To engage students in the nature of technology, we questioned, “A light is a type of technology. Why is a pencil technology?” Students respond by saying it is “manmade” or “You can write stuff with it.”
Day 2: Engaging With Materials
Day 2 starts with us providing students with materials they need to investigate. Because our classrooms have a wide range of language backgrounds, we typically use heterogeneous groupings so that students can gain from each other’s diverse perspectives. As students split into groups, they use bike lights, papers, and rulers. Any flashlights will work, but we used bike lights with three different brightness settings. These settings will be useful later in the investigation. We monitor and have students explain their thinking by asking questions like, “Why would we need the light to be the same?” or “If the two lights are shining on the same spot at the same time, how might that be a problem?”
As students start to interact with materials, we stop and say, “I see we are engaging with our materials. What are some things we could do to make sure we are using them appropriately?” Students respond with ideas that the lights should be off or facing downward unless being used.
We prompt students to finish their investigations and observations to discuss as a class. To start, we ask, “What do you notice?” A student might respond with, “Mine is dimmer.” We deepen their thinking by asking, “Interesting. How do you know your light is dimmer?”
Students draw pictures based on what they saw in their investigation. If students are having difficulty, we ask, “How are you going to show how far away the lights are?” In Figure 1, the student represents a dimmer light with short lines.
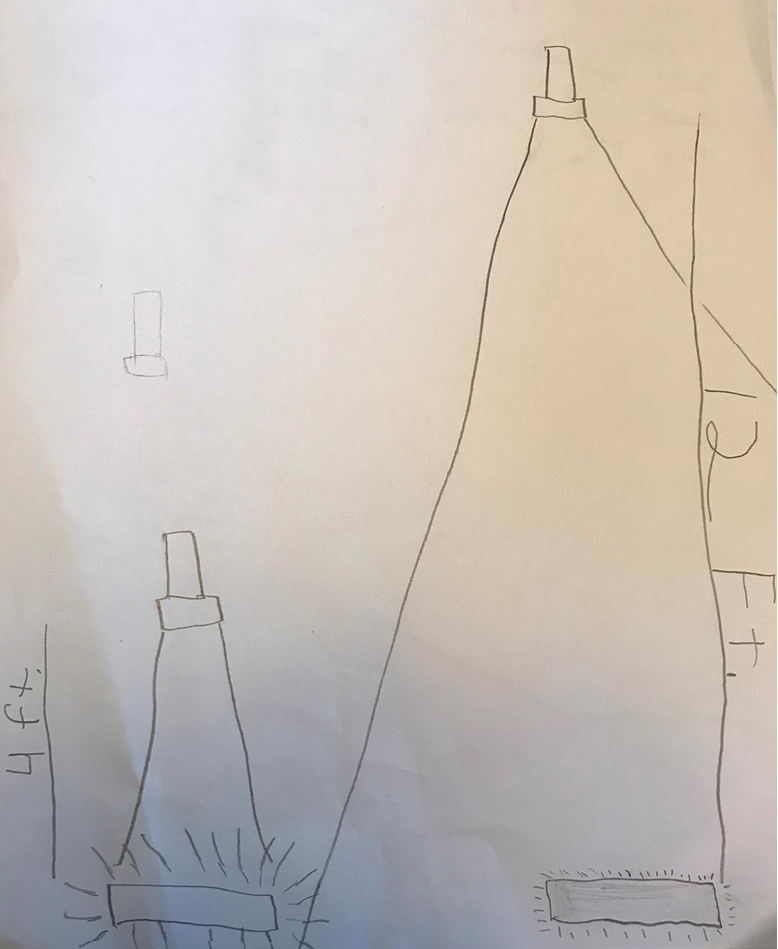
A student represents a dimmer light with short lines.
If time allows, we engage students by asking questions about how they could change the light to match the brightness at different distances. To help students we ask, “How many notches could we turn the light?” or “Bike lights can change brightness. What would happen if we changed the brightness of the light?” Students in our class predict that different brightness of lights may light up the paper the same at different distances.
We give students a few minutes to investigate their claim and help them connect their new knowledge about light to stars by asking “How do you think distance and brightness might affect the way we see stars?” We entertain a few student ideas but leave any concept development for our activity on day three.
Day 3: Recording and Reading Data
This lesson is designed to introduce students to reading data in a spreadsheet and helping them understand the value of the spreadsheet (Espenak 2020). The spreadsheet we use with students appears in Figure 2 with the names of 13 stars in the first column and values for actual and apparent magnitude, diameter, size, and mass in additional columns. We start by presenting the first two columns of the spreadsheet. We define actual magnitude as how bright a star actually is and compare it to the bike lights from our prior lessons. We liken it to how the number of clicks from the bike lights impacts the brightness. To help students remember, we write on the board: “Actual magnitude = number of clicks on bike lights.” Then, we point out the actual magnitude of the Sun and Rigel and ask how they would appear to us. Students respond that Rigel is brighter. To push students we ask, “If Rigel is actually brighter than the Sun, why does the Sun look the brightest?” Making connections to their previous investigation, students respond with the idea that the Sun is closer to us. When students make this claim, we reveal the next column in the spreadsheet that shows apparent magnitude. We define apparent magnitude as “how bright we see it from the Earth.” We write on the board: “Apparent magnitude = how bright the light looks to me.” We encourage students to ask questions and make comments before we move on to applying these values.
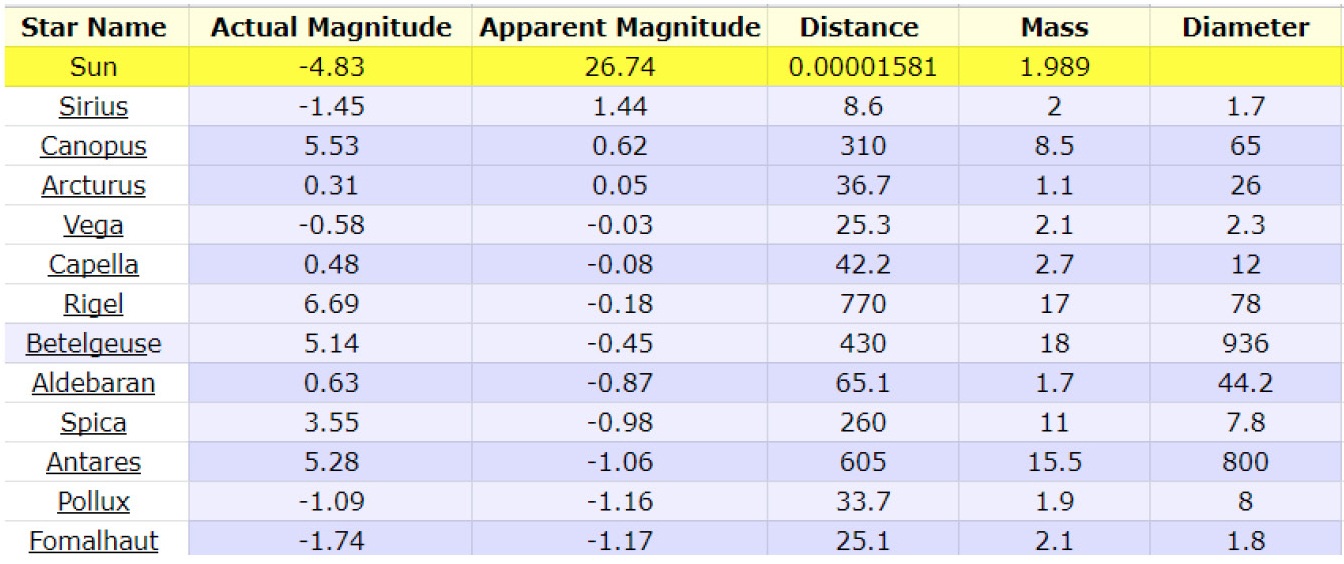
Spreadsheet of star data.
We then reveal the next column, which is distance in light years from Earth. We point out the Sun and refer to Rigel. We describe that it is the farthest away from the Earth at 770 lightyears but also has the largest actual magnitude. Then we point to Rigel’s apparent magnitude and ask, “Why is the apparent magnitude so dim if it is the brightest star?” Students explain that Rigel is far away. To end the lesson, we refer to the Sun’s values and ask the class to think about why it appears as the brightest.
Day 4: Examining Actual Data
Day four can be combined with day three depending on time. The goal of day four is to help students apply and refine their thinking using actual data from stars. We display the spreadsheet from Figure 2, but only columns: star name, apparent magnitude, and actual magnitude. Canopus (actual magnitude: 5.53, apparent magnitude: 0.62) and Antares (actual magnitude: 5.28, apparent magnitude: -1.06) are highlighted). We tell students to think first and ask, “Based on the apparent and actual magnitudes, which one do you think is farther away?” After time to think to themselves, we have students share with a partner. Students typically explain that Antares must be farther away because “it looks different.” We further the conversation by asking, “What do you mean by looking different?” Students say that it is dimmer due to the apparent magnitude value. To help solidify their rationale, we ask, “So if it looks dimmer, why do you think it would be farther away?” With this question, students claim that the actual brightness of the two stars is almost the same so they must be different distances away. We then display the distance column to confirm students’ explanations.
To further apply their thinking, we engage students with another example. This time we block out the apparent magnitude column and highlight Vega and Fomalhaut. We read the values and say, “Their distance is about the same, but their actual brightness is different. Which one will look brighter?” After some think time, students share their ideas with a partner. This is a time where we walk around and monitor. We only engage by asking questions if we need to clarify an individual’s idea. We may ask something like, “What does the negative in front of the numbers mean?” or “How do you know which one is brighter based on the values?” As students wrap up talking to partners, we have them share as a whole group. Students may say that it is Fomalhaut because it is dimmer. We take this time to refer students to the original question of which one is brighter, “How can it be brighter, if it is dimmer?” When students respond that Vega is brighter, we ask, “What values from the data support that?” Students might say it is closer to Earth, which makes it appear brighter. To challenge their thinking, we ask “Vega is only 0.2 light years closer to Earth. That is a very small value. What about their actual magnitude tells you it is brighter?” With this prompting, students explain that the more negative a number, the less bright the star. We finish this part of the conversation by asking the students what two things can cause the stars to look brighter. Students pretty easily note the actual magnitude and the distance.
Next, we engage students in conversations about how scientists use data. We ask, “How might scientists use this spreadsheet as data?” Students respond with “To see how bright stars may be,” or “How far a star away from Earth is.” The conversation continues by asking students to think about why this data is easier than looking at an image of the sky. Students participate in conversations with their groups and discuss how it might be easier to compare stars, it is more organized, and that scientists see things in the chart that they may not see through an image.
To end the lesson, we assess students by giving data on two stars, Spica and Sargas. We project a slide and read the question, “Based on the actual magnitude and the distance, describe and compare the apparent magnitude. Why might that be the case?” Students work independently to answer the question on paper. We monitor and make sure we clarify by telling students they need to describe and compare. Figure 3 shows an example student response. Though Spica is brighter due to distance and magnitude, we might ask this specific student, “What data supports that?” Our hope is they would use specific values from the data shown.
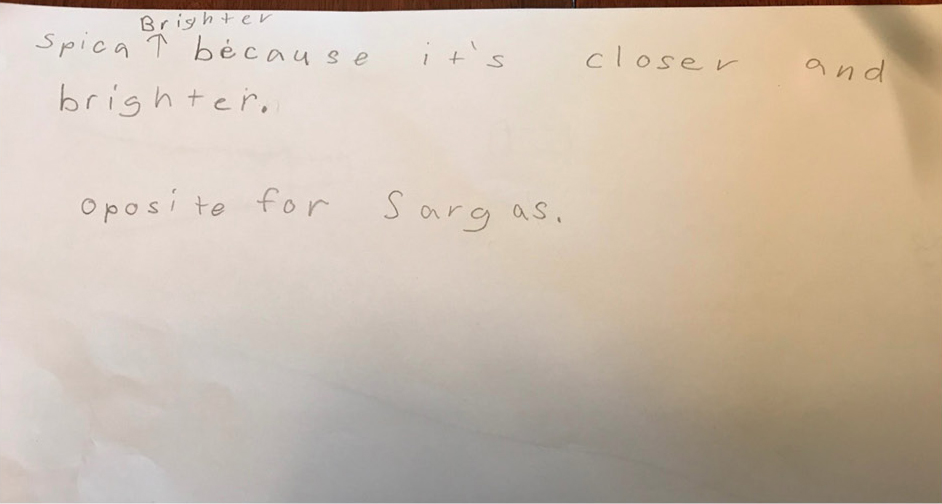
Sample student response.
Day 5: Reflecting on the Experience
The last day of the unit, students read a journal entry (see Supplemental Resources) we wrote using source material from the perspective of a modern astronomer reflecting on technology’s impact on the history of astronomy (McCray 2014). Students answer embedded NOST questions throughout the text (see Figure 4). Students follow along as we read aloud.
NOST questions for students.
• Why is it important for scientists to share data? Why might scientist sometimes not want to share data?
• How did technology shape the job of an astronomer?
• How did technology benefit scientists? How do you think technology might have made their jobs more difficult?
• How has astronomy changed over time?
As we reach each bolded question, we stop and ask the students to think about the questions first, then share with a partner, and finally we take some ideas from the class. For example, when we reach the first bolded question set, “Why is it important for scientists to share data? Why might scientists sometimes not want to share data?” students note that some scientists work together to help each other out but others might be competitive and not want to share.
This approach is called explicit-reflective nature of science and technology instruction (Abd-El-Khalick and Lederman 2000; Kruse 2013; Kruse, Edgerly, Easter, and Wilcox 2017). Sometimes these explicit-reflective questions are phrased generally such as, “What does this story tell us about how scientists work?” While such questions can be useful, recent research has noted that targeting specific NOST ideas rather than asking general questions results in students considering a wider range of NOST ideas. Furthermore, if explicit-reflective questions are too open-ended (e.g., What can we say about scientists and collaboration?), students were more likely to include misconceptions than when questions were a bit more guided (e.g., How does this story show that scientists collaborate) (Voss, Kruse, Kent-Schneider 2020). Kruse and Borzo (2010) provide more guidance for teachers looking to write their own historical stories to help students learn about NOST.
When we get to the question “How did technology shape the job of an astronomer?” Students respond with “It made it a lot easier. Back then, they had to draw it out very carefully.” We refer to the spreadsheet and say, “This is what we call a database, why might this help an astronomer?” Students respond with ideas about what it looks like and how scientists can describe it. We then ask students to think about how the database would be different without a computer. Students discuss how it would be a really long piece of paper. Next, we talk about trade-offs of technology by asking, “What could be some bad things about putting it on a computer?” Students turn and discuss with a partner noting difficult connections and malfunctions. While these trade-offs are worth considering, we pushed students further during the discussion of the next set of questions.
When we reach the questions, “How did technology benefit scientists? How do you think technology might have made their jobs more difficult?” Students answer the first question by saying computers make everything easier. We refer to our conversation about how a pencil is a technology and then ask students how a telescope is a technology. Students answer that telescopes help scientists see the sky and take pictures. To push students to consider technological trade-offs beyond malfunction we ask, “Even if everything is working perfectly, why would a large database make scientists’ jobs more difficult?” Students recognize that having so many numbers and information could be overwhelming and difficult to understand.
When we ask, “How has astronomy changed over time?” students describe that decades ago data collection took longer and how technology has improved collecting data. To help students connect NOST ideas to their lives, we ask, “What are ways technology can change the way you act?” This makes NOST more concrete for students. Students describe how technology can make you tired, you only communicate through one device, or you can forget how to do specific skills.
Conclusion
From these activities, students gain knowledge about factors that cause stars to appear with different brightness when observed from Earth. Students also learn how science works and about how technology develops, influences science, and changes behaviors. While we do not formally assess students’ NOST learning in this week, we gain insight into their thinking and continue to bring up such ideas throughout the school year. Learning about these NOST ideas prepares students to be engaged citizens in our scientific and technological society. By including NOST throughout our science instruction, students are more likely to deeply learn and apply their learning.
Download the article students consulted at https://bit.ly/3DX8jqN
Alida Acosta (alida.acosta@dmschools.org) is the K–12 science curriculum coordinator at Des Moines Public Schools in
Des Moines, Iowa. Jerrid Kruse is the Baker Professor of Education at Drake University in Des Moines, IA.
Astronomy Earth & Space Science Physical Science Elementary