
Inquiry and Design
Using Science and Engineering to Understand Particle Motion and Thermal Energy
The Next Generation Science Standards (NGSS) add engineering to the science curriculum (NGSS Lead States 2013). While engineering is an important construct, we do not want to lose the benefits of inquiry-based science instruction. Both engineering and science require critical thinking. However, the goal of science is to understand the natural world while the goal of engineering is to solve a problem. Although solving problems is important, we should be cautious to not let engineering replace science in the curriculum (Kruse and Wilcox 2017b). Therefore, we work to combine inquiry and engineering when we can. This lesson has students engaged in inquiry to investigate how temperature affects particle movement. Then, using their understanding of particle movement, students engage in engineering to develop a model to minimize thermal energy transfer (MS-PS3-3).
Clough (2006) described the nature of science (NOS) as how science works, the foundational assumptions of science, and how society and science influence and react to each other. We address the NOS often and in short discussion prompts as illustrated below to keep students thinking about how scientists work. When students’ attention is drawn to NOS (i.e., how scientists work and think), they gain interest as they come to see science as creative, changing, and collaborative.
Pleasants and Olson (2018) noted that the nature of engineering (NOE) answers questions such as “What is engineering?” “What do engineers do?” and “How is engineering related to, but distinct from, science?” As with NOS, understanding NOE may help students to become more interested in engineering, but also help them understand the reliance of engineering on science and math (Kruse and Wilcox 2017b), as well as the limitations of engineering and technology (Kruse and Wilcox 2017a; Kruse et al. 2017). Such understandings will serve students well when they engage as citizens in socio-scientific issues (Lee and Lee 2015). To help students better understand how engineers work, we ask students explicit and reflective questions about NOE (Kruse et al. 2017).
Using the activities below, we help students understand the similarities and differences between NOS and NOE. This approach promotes deeper scientific literacy so that students might recognize why both science and engineering are important.
Demonstration
We start by having students observe a demonstration using a document camera. We place one drop of food coloring into a 400 ml beaker of room-temperature water. We ask students to share what they notice as the food coloring disperses. Students give answers such as “The food coloring is spreading” or “The water is changing colors.”
Then we ask, “How might temperature affect the movement of the coloring?” To get students to make predictions we ask, “What do you think would happen if the water was hotter or colder?” Students typically say things such as, “The hotter water will spread faster,” “The cold water would never mix,” “The color of the food coloring will make a difference,” or “There will be no difference.” This demonstration lasts approximately five minutes.
- Students should wear safety goggles and gloves during the activity.
- Remind students that some of the liquids will be hot, so all materials should be handled carefully.
- If a spill occurs, remind students not to touch the water until the temperature has lowered.
- Ask students questions about how to handle hot liquids and ensure they note to use insulated gloves or to not touch.
Setting up the investigation
To build off the demonstration we ask, “How could we figure out how water temperature affects the spreading of the coloring?” Students typically note that they could use different temperatures of water and see how much or how fast the coloring spreads. To guide students we ask, “How can we change the temperature to test our idea?” A student shared that we could use ice cubes to make the water cold. We then ask, “What if we wanted the water to be hot?” One student shared that we could heat up the water on a stove. Because we do not have a stove in our classroom, we bring out a hot plate to confirm that heating up the water is a possibility.
If this is the first time we have heated water in the class, we ask students what safety precautions we should consider. Students should note that they should not touch the hot plate or the hot beaker, and that they should heat the water slowly, wear safety goggles and safety gloves, and let the water cool slowly on the hot plate rather than placing the water on a cool countertop. If students do not note any of these things, we ask more specific questions or make statements to ensure students can articulate safety expectations. We make note that safety gloves and goggles should be worn at all times during the investigation. We ask that students pay attention to their surroundings; when the beaker is being moved, they should be very careful with the glass and hot temperatures. If a beaker is broken, we ask that students raise their hands so the teacher can clear the glass out of the way to prevent injuries.
Once we have established how we can safely cool and heat the water, we ask students what variables to document. Students quickly identify that we should be noting the temperature of the water with a thermometer, but may need some help with the food coloring observation. To help students we ask, “If we assume the food coloring will spread throughout the whole beaker, how could we tell if it goes faster or slower?” With this guidance, students easily come up with timing the spread of the food coloring. Sometimes we use this as an opportunity to talk about NOS by asking, “Why do scientists make assumptions when doing their work?”
Now that the class understands how we can collect data on temperature and color spread, we have small groups of students brainstorm how they could investigate how fast the food coloring will disperse using different temperatures. After a couple minutes of group discussion, we come back together and decide as a whole what we want to do to test our ideas. Typically, the class decides to test three different temperatures of water in three separate beakers. We use the whole class to make this decision to support small groups that might still be struggling. We also make connections to NOS by asking the class, “Why do you think scientists sometimes work in small groups and sometimes big groups?” Students typically note that sometimes you need a lot of ideas, but getting things done in a big group is hard. No matter what students say, we get them thinking about the collaborative nature of science.
Before letting students begin their investigations, we want to set them up for success. So we ask, “How will we know that the food coloring is dispersed?” One student said, “We won’t see any more food coloring moving.” Another student shared, “The color of the water will be all the same.” If they struggle, we tell students to look for absence of the “streaks” or “lines” from the food coloring. As we all know, students often need guidance to notice particular aspects of phenomena. We try to link this guidance to NOS by asking students, “Sometimes teachers have to point things out to students. Who might point things out to scientists?” Sometimes students will claim that scientists have a teacher. We acknowledge that this might be true sometimes, but it is not true for people who have been scientists for a long time. With some more thinking, students usually note that scientists learn from each other: “They are like teachers for each other.” This further reinforces the collaborative nature of science. Sometimes we go further by asking, “Why do you think science is more interesting when you work with others?”
We also ask students, “How will we record our data?” Once again, we have students discuss in their groups. We walk around and monitor the group conversations. After a minute, we come back together to share ideas. Students typically want to create a t-chart with temperature in one column and dispersal time in the other column. Assuming students create a t-chart or another reasonable approach, we move on to the investigation.
Alternative strategies for differentiation and cost
- If your school does not have hot plates, consider using a percolator or coffee maker as a substitute.
- If time or student ability is of concern, having the various temperatures of water set up in advance can lighten students’ cognitive load.
- Also, if time is a concern, the food coloring activity can be done as a demonstration. However, not all of the benefits of student inquiry will be achieved.
Investigating temperature and food coloring
Once students understand how we will conduct the investigation, we have them work in groups of two or three. Students get out three beakers of the same size (usually 400 ml). Each beaker is filled about 2/3 of the way with tap water at about 25°C (77°F). Students add ice to one beaker and place one on their hot plate and leave the third beaker alone. While we are tempted to give students a procedure to follow, we do not want to reinforce the NOS misconception that science is a step-by-step process. However, we watch carefully as groups set up their investigations and comment or ask questions to help students fix possible problems. For example, if students do not put an equal amount of water in each beaker we might ask, “We are investigating temperature differences, why might having different amounts of water be a problem?”
We have created a list of safety precautions that should be reviewed before beginning the activity (see sidebar). We recommend that students get the cold water down to about 10°C (50°F) and the hot water to about 80°C (176°F) before they add the food coloring. Once students get an accurate reading with their thermometer, they put one drop of food coloring into the beaker. When the drop hits the water, students start their stopwatch to time how long the food coloring takes to disperse in the beaker. Students do not stir the water because they want to see accurate measures of how long the water disperses, depending on the temperature. Students record their data and move on to the next temperature. The investigations typically last about 15 to 20 minutes. If a group finishes early, we ask them to repeat the investigation or add another temperature data point (e.g., colder than their coldest data point).
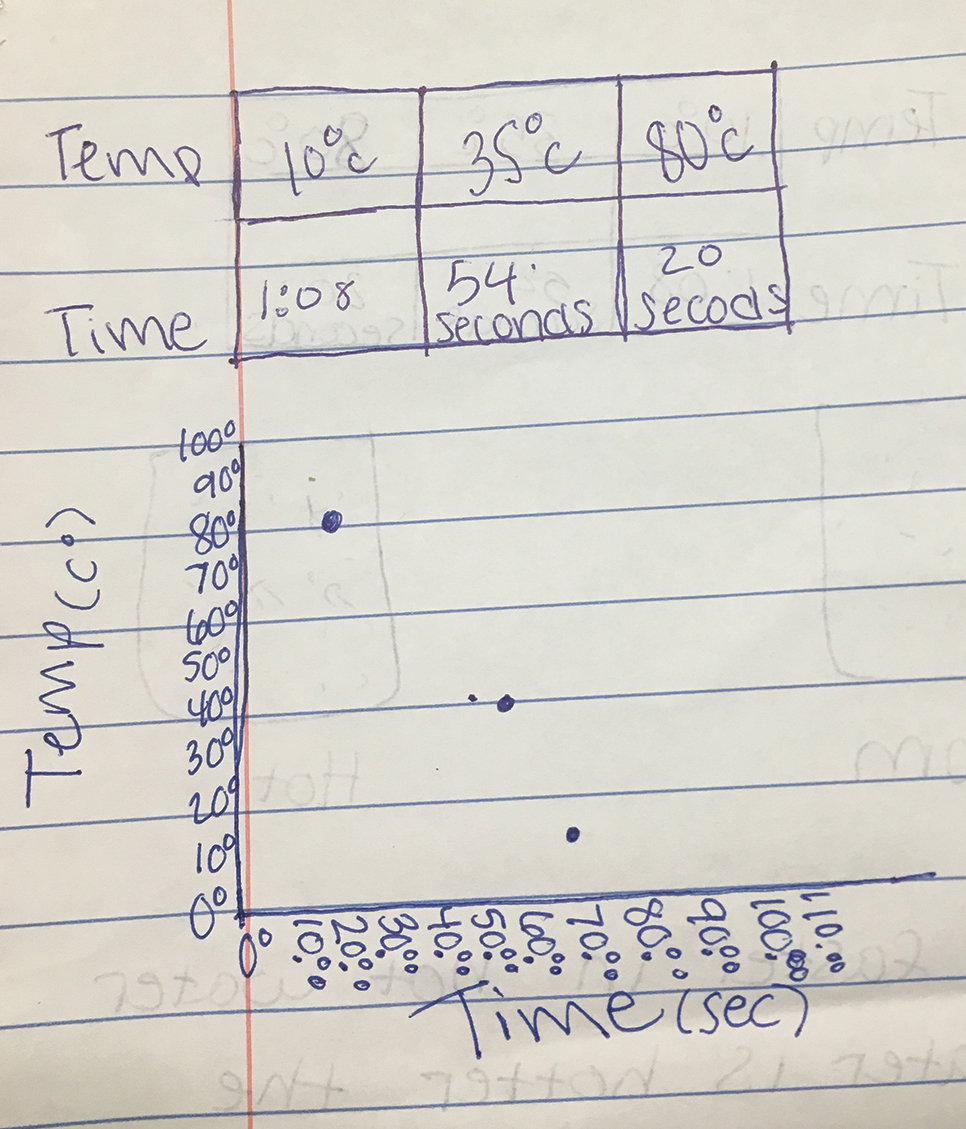
When students are finished with their investigation, we have students plot dispersal time against temperature. We have students create paper-and-pencil graphs rather than use a computer program so we can better see their understanding of graphing. For example, one group created a table and plotted points from their results on a graph (see Figure 1). The graph gives students a visual representation of the data and helps students the following day. With our 46-minute class periods, this is typically the end of day 1. If students do not finish the graph, it is assigned as homework. If your students have not created graphs before, we recommend keeping this an in-class activity. While the graphing activity presents an opportunity to discuss on which axis each variable could be placed, we did not do so with seventh graders because similar conclusions can be made about the relationship between temperature and dispersion time no matter the variable-axis alignment.
Student graph
Particle discussion
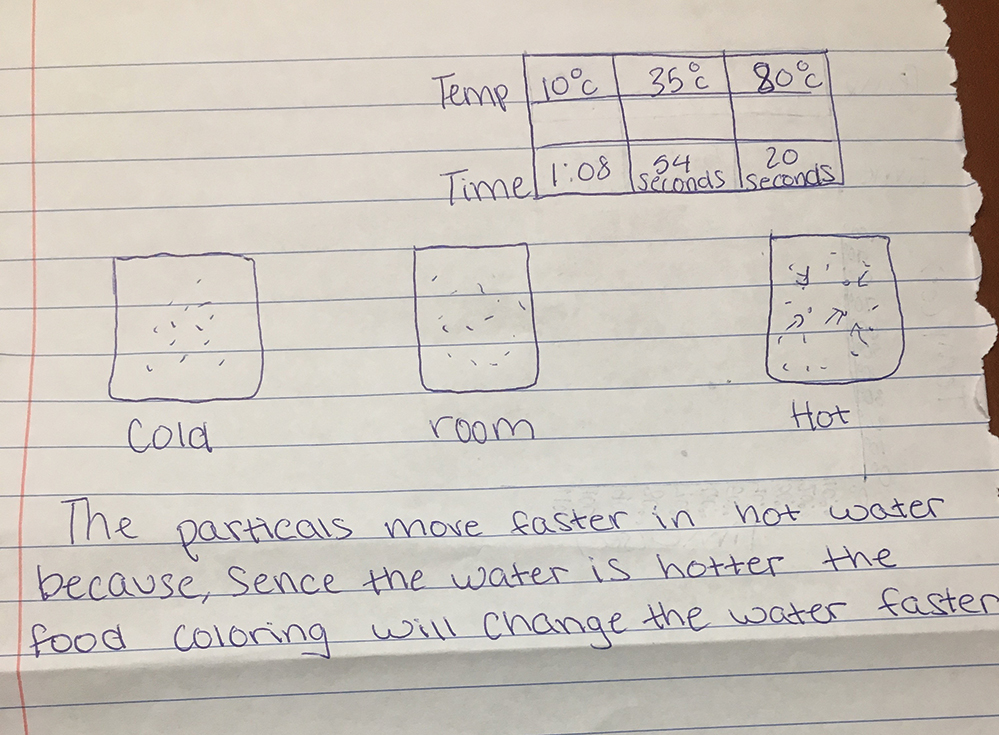
During the next class period, we ask students to look at their graphs and push students to think about particles by asking, “Why do you think the hot water disperses the coloring the fastest?” and “What about the water do you think is different?” Students often claim that the water has more “energy” when it is hot so we ask, “How do you think that increased energy affects the tiniest pieces of water, called particles?” When students note that the particles might be moving faster we ask, “If these particles of water are moving faster, why would the food coloring disperse more quickly?” We use this question as formative assessment and sometimes have students write answers to this question so we can walk around and see what each student is writing. As students write, we encourage them to draw pictures that compare the particles of hot water to particles of cold water. Students’ writing and drawings help us understand that students understand the movement of particles in relation to temperature. We collect these drawings/writings as a formative assessment so we can determine how each student is progressing. We look for some indication that students recognize faster movement of the hot water particles than the cold water particles. For example, one student drew arrows behind the hot water particle to show faster movement (see Figure 2).
Student table and explanation
We draw students’ attention to NOS ideas again by asking, “Why do you think scientists might use drawings or models to better understand the natural world?” Sometimes students struggle with this question so we ask, “Why do we have to make drawings, or models, of the particles?” Students then explain that we cannot see the particles directly so we ask, “What might be some things scientists cannot see directly?” With this scaffold back to their experience, students typically note that scientists might have to model or draw germs, other particles, or even really big things such as the Earth.
We extend students’ thinking by showing them a can of soda and a cup of coffee and asking, “What could we do to keep these cold and hot?” Students give answers such as “Put it in a cooler or use a Koozie” and “Use a Thermos.” We ask, “Why does the temperature change in these liquids when we do not use anything to protect it?” If students struggle to think about particles we ask, “How do you think particle movement can explain why hot coffee gets colder or cold soda gets warmer?” If students still struggle we ask, “What is happening to the energy of the beverage particles as they come in contact with the air or the sides of the container?” With this scaffold, students note that the particles bumping into the sides transfers some energy between the particles of the beverage to the particles of the air or container.
Engineering design
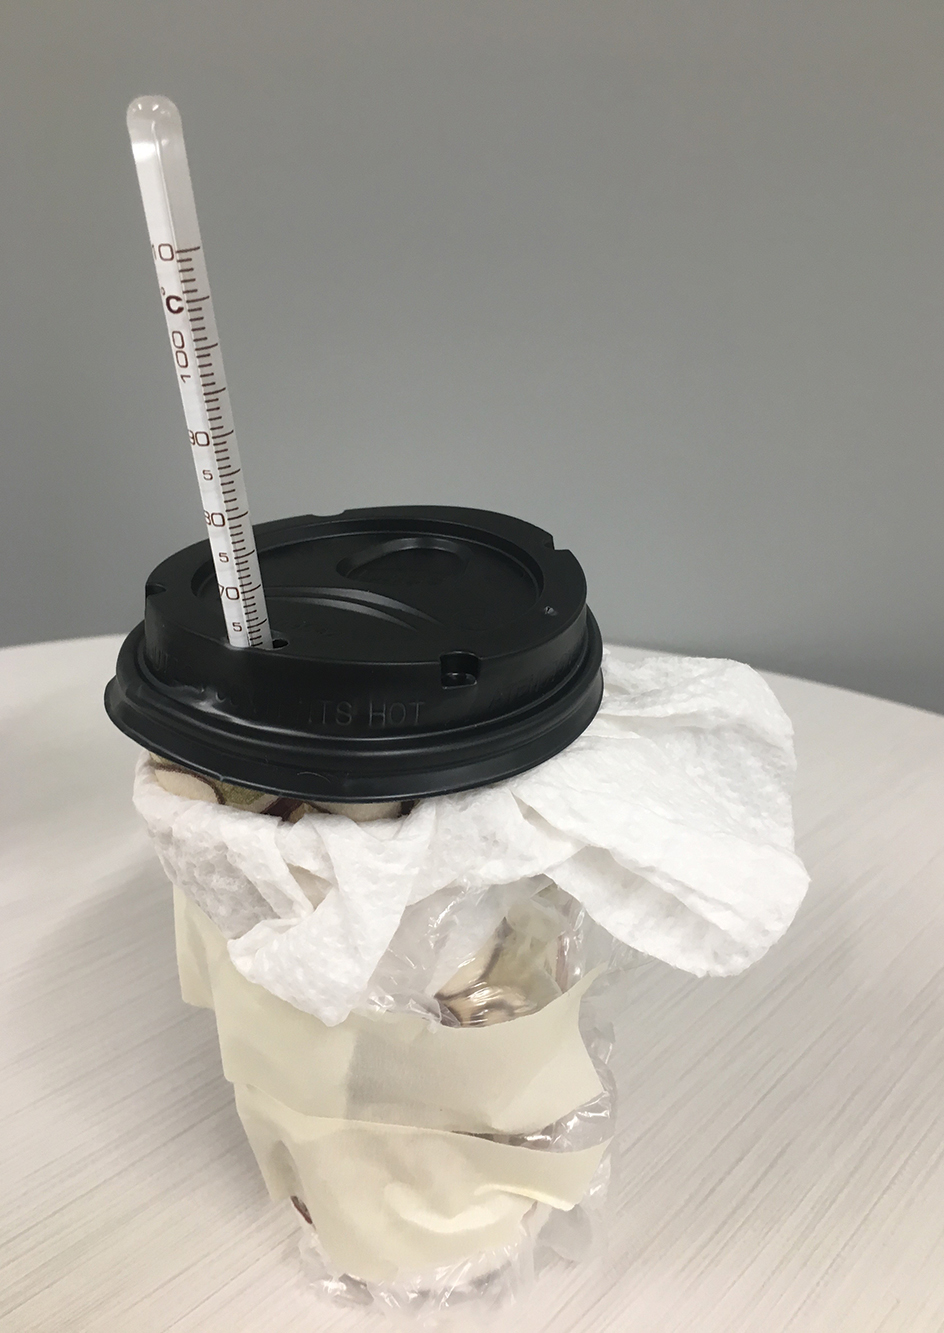
We now introduce an engineering task by saying, “Using what you know about particles and energy transfer, your task is to construct a container to minimize the change in temperature of water, either hot or cold.” Available materials include paper cups, paper lids, paper towels, aluminum foil, bubble wrap, tape, cardboard, and any other materials students may want and to which we have access. Students work in the same groups as the previous day. We have them draw out a plan on how they will use the given materials. After students plan for 10 to 15 minutes, they gather materials and begin building their designs. As students discuss, design, and build, we walk around and ask questions such as, “How will these materials help minimize energy transfer?” or “How is your design informed by particle motion?” Students finish day 2 building their design. For example, one group wrapped their interior cup in paper towels then the outside of their cup with bubble wrap and tape (see Figure 3). Another group used layers of paper towels to wrap their cup and lid.
Bubble wrap cup
Day 3 is reserved for testing and refining designs. Before students begin testing their designs, we go over the safety precautions again. We use the same safety precautions as the first day. We ask questions about safety precautions, then fill in the gaps to ensure safety during students’ work time. We give students a thermometer to collect data after each minute to see how well their design maintains temperature. First, students place the water (either hot or cold) into their new creation and take an initial temperature reading. The temperature of water used by students should be substantially different than room temperature (e.g., at least 15 to 20°C [59 to 68°F] different) so that the impact of student creations is more clear. Then, students record the temperature after every 60 seconds for 10 minutes. While groups are working, we walk around and see how each design is working.
After this first round of testing, we have students do a gallery walk to see other student creations. A gallery walk is when one or two students stay back to explain their design and other members of each group walk around to see the other designs. After a few minutes, group members switch places. To ensure that students stay on task, we walk around the room listening to student conversations.
To help students analyze their creations, we come back together as a whole group and ask, “What things do you think helped minimize energy transfer in your designs?” “What aspect of your design might be causing too much energy transfer in your design?” and “What do you think you could do differently?” We use this whole-group discussion to help students generate ideas for their revisions. Groups work together to draw or make revisions to their designs. For instance, one group used only one layer of bubble wrap. After the gallery walk, they realized it would benefit them to add a couple layers of bubble wrap to create more insulation for their creation. We allow about 10 minutes for students to make their changes before retesting their designs for another 10 minutes.
Incorporating nature of engineering
While students are designing, building, and testing their designs, we move around to the small groups and pose questions about their design, as well as questions that help them understand the NOE. Based on other articles that target NOE (e.g., Kruse et al. 2017; Kruse and Wilcox 2017a and 2017b), some example NOE questions we use include:
- Your group made changes to your design, why might an engineer make changes to their original designs?
- You are working together as a group, why would engineers work together?
- You had to be creative with your design, how are engineers creative?
- You were constrained or limited in your design, what kind of constraints might engineers face?
- We see that your group is collecting data, why would engineers collect data?
- Oftentimes, engineering is portrayed as step-by-step, why is this not very likely?
One NOE question we ask as a final discussion is, “How is designing and building this device different from when we investigated the food coloring and temperature?” Students note that the food coloring investigation was to learn about particles and temperature and this activity is more about applying those ideas. We then note that this is one of the differences between science and engineering and ask, “What would happen to engineering if people stopped doing science?”
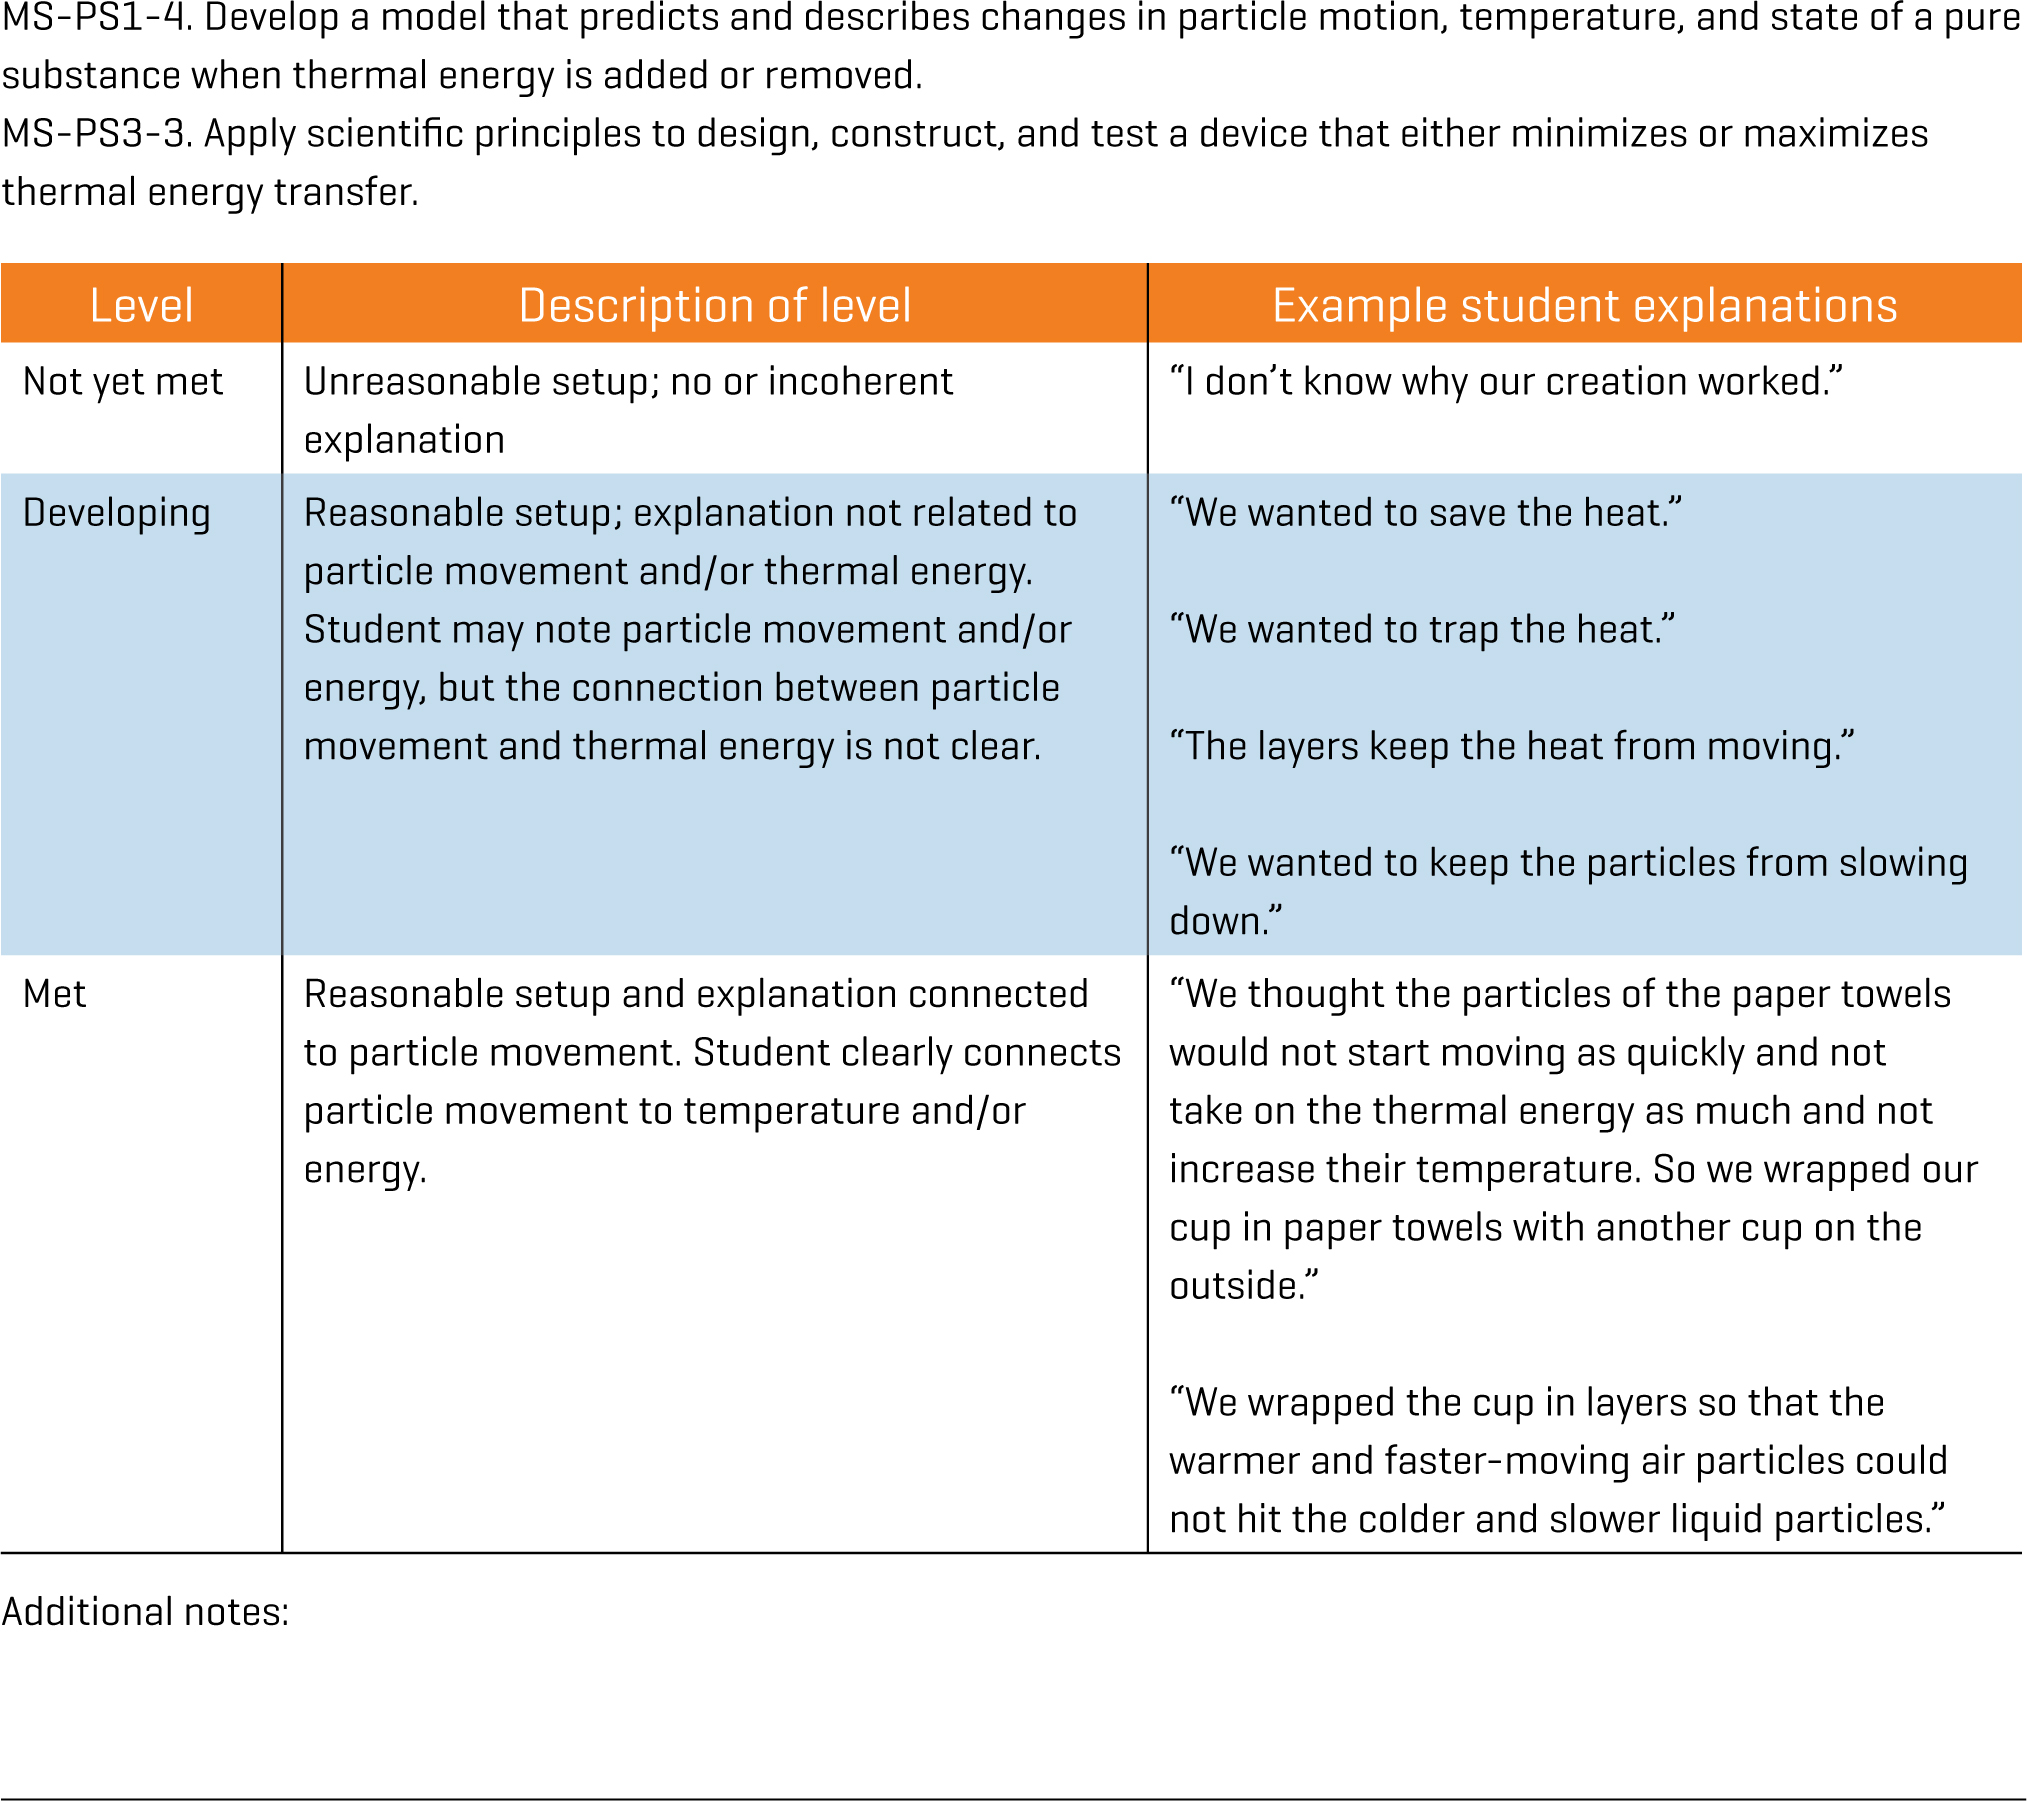
While we learn much from our many conversations with students in both large and small groups, we also wanted to assess students more formally. Therefore, we have students answer the following question: “How did your understanding of particle movement inform (or relate to) the design of your device?” We had students write their answers, but the assessment could be done verbally. See Figure 4 for student responses and the rubric we have created from those responses.
Thermal energy rubric
Conclusion
While the new emphasis on engineering in the NGSS is likely to create new and engaging strategies, we do not want to lose sight of the importance of scientific inquiry. Indeed, the results of science often inform engineers in their work. With this set of activities we were able to engage students in both inquiry and design while helping students understand the natures of both science and engineering.
Inquiry Physical Science Middle School