
feature
Particulate Matters
Water Filtration and Solar Disinfection

CONTENT AREA Engineering, technology, and applications of science
GRADE LEVEL 6–8
BIG IDEA/UNIT Designing solutions for human problems
ESSENTIAL PRE-EXISTING KNOWLEDGE Previous experience with the engineering design process is helpful but not required.
TIME REQUIRED Seven 50-minute classes
COST $45
SAFETY Students should wear goggles and wash hands thoroughly when working with the materials. Consult with a high school colleague or college instructor who can inoculate and culture the water samples away from your classroom.
Those of us in the United States often take for granted that the water coming out of our faucets will be safe for drinking, cleaning, or brushing our teeth. Despite this, each year nearly half a million people visit emergency rooms because of waterborne diseases, resulting in over 100,000 hospital stays and thousands of deaths (Centers for Disease Control and Prevention [CDC] 2020). In fact, the CDC estimated that in 2017 people in the United States spent $3.8 billion on emergency room visits for waterborne illnesses.
When I first moved to Mississippi, I quickly learned to keep an emergency case of bottled water on hand. Tornadoes, hurricanes, floods, and pipeline breaks meant that we were cut off from our regular access to clean, drinkable water. So what can people who are cut off from potable water do? This problem provides an ideal basis for an engineering design challenge that utilizes solar disinfection. Solar disinfection is the method of using sunlight to inactivate microbes in biologically contaminated water. By placing contaminated water in transparent containers and exposing them to strong sunlight for 8–48 hours, the microbes are inactivated and unable to cause illness. Solar disinfection provides an easy, low-cost, and effective solution for purifying water and is often used in remote rural communities or in low-income settings.
In this article, we present a two-step engineering challenge for middle school students: reduce the spread of waterborne illnesses by designing a filter that can clear cloudy water, then evaluate the effectiveness of solar disinfection on the filtered water. This unit was completed over seven 50-minute class periods, but it can be adapted for length. As a result of completing this unit, students will develop scientific literacy and engage in the Science and Engineering Practices through an engineering design challenge.
Introducing waterborne diseases
Access to potable water is a socioscientific issue that has featured prominently in the national news over the last few years. Boil-water notices happen frequently enough in our area that my students were already familiar with how they could impact their day-to-day lives, but for students without that experience, connecting this lesson to a specific example or event can help ground the problem they explore in concrete terms. For example, many of my students have relatives living near Jackson, the Mississippi state capitol, where a large number of residents went without municipal water for over a month. A severe winter storm taxed the city’s aging water infrastructure and burst pipes across the city, leaving over 70% of residents under a boil-water notice for five weeks and making the Jackson water crisis national news (Fentress and Fausset 2021). Many Texas residents experienced the same event on a wide scale, and those living in other areas that experience tornadoes, hurricanes, floods, or hard freezes will also have similar stories to tell.
While students may be familiar with the warnings, they often don’t understand the reasoning behind them. To introduce the idea and impact of waterborne diseases, students play an epidemiology card game adapted from Hughes (2007; see Figure 1; see also Appendix A in Supplemental Materials; see original versions of cards in Online Resources). After a brief introduction to waterborne diseases, students working collaboratively in small groups are presented with two sets of cards. The first set of cards represents a group of 20 patients who came to the hospital with a suspected waterborne illness. Each card has information on where the patient has been, what they ate or drank, relevant or irrelevant details, and symptoms. The second set of cards represents eight common waterborne illnesses, conditions where the pathogen is found, and symptoms of the disease. Students role-play as epidemiologists and attempt to diagnose the patients by considering the evidence presented in the patient cards and the symptoms listed on the disease cards.
Examples of the epidemiological case study cards.
Hepatitis A, caused by Hepatitis A virus
The third most common cause of waterborne disease in U.S. The term hepatitis relates to inflammation of the liver.
Symptoms: Fever, fatigue, stomach pain, nausea, dark urine, jaundice (yellow skin and eyes)
Sources: Ready-to-eat foods, fruit and juice, milk products, shellfish, salads, vegetables, sandwiches, water
Cryptosporidiosis, caused by Cryptosporidium
This was first identified as a cause of diarrhea in people in 1976. It can be transmitted through contact with animals (particularly cattle and sheep), other humans (especially in daycare centers), and contaminated water supplies.
Symptoms: Stomach cramps, dehydration, nausea, vomiting, fever, weight loss
Sources: Fecal matter of an infected animal or person. Can survive for days in chlorinated pools.
Case Background #7
Male, 30 years old
Works at a marina but does not eat raw seafood.
Drinks tap water and recently had a boil-water alert in his neighborhood.
Symptoms: Diarrhea, abdominal cramps, and nausea
Case Background #12
Male, 55 years old
Lives on a ranch that raises cattle and chickens.
Symptoms occurred 10 hours after drinking from pump outside of barn (ground water may have been contaminated by surface water in the pasture after heavy rain).
Symptoms: Malaise (general weakness and discomfort), fever, abdominal cramps, nausea, vomiting
Because many waterborne diseases present with similar and overlapping symptoms, students need to consider not only the patient’s symptoms, but also other factors such as their age, where the patient may have contracted the disease, or what activities they recently engaged in. Once groups have made their diagnoses, they share their diagnoses with other groups and evaluate each other’s outcomes. If groups disagree, they debate their point based on the evidence from the cards and come to a consensus as a class. An answer key is provided with the cards (see Appendix A in Supplemental Materials).
The benefits of this activity are twofold. First, students gain familiarity with the sources and symptoms of waterborne illnesses. The scenarios presented in the cards help ground the activity for the students and provide concrete examples of the scope and severity of the problem they are trying to solve. The cards can be edited and modified to reflect the context and community that the students live in. Secondly, it gives students an opportunity to engage in the science and engineering practices.
The water filter design brief
Engineering design focuses on real-world problems and gives students flexibility in designing solutions (National Aeronautics and Space Administration [NASA] 2008; see Figure 2). Engaging in the engineering design process allows students to design, test, and modify their products in iterative cycles. In middle school engineering tasks, students iteratively test and modify their designs to optimize them for the best results (NGSS Lead States 2013).
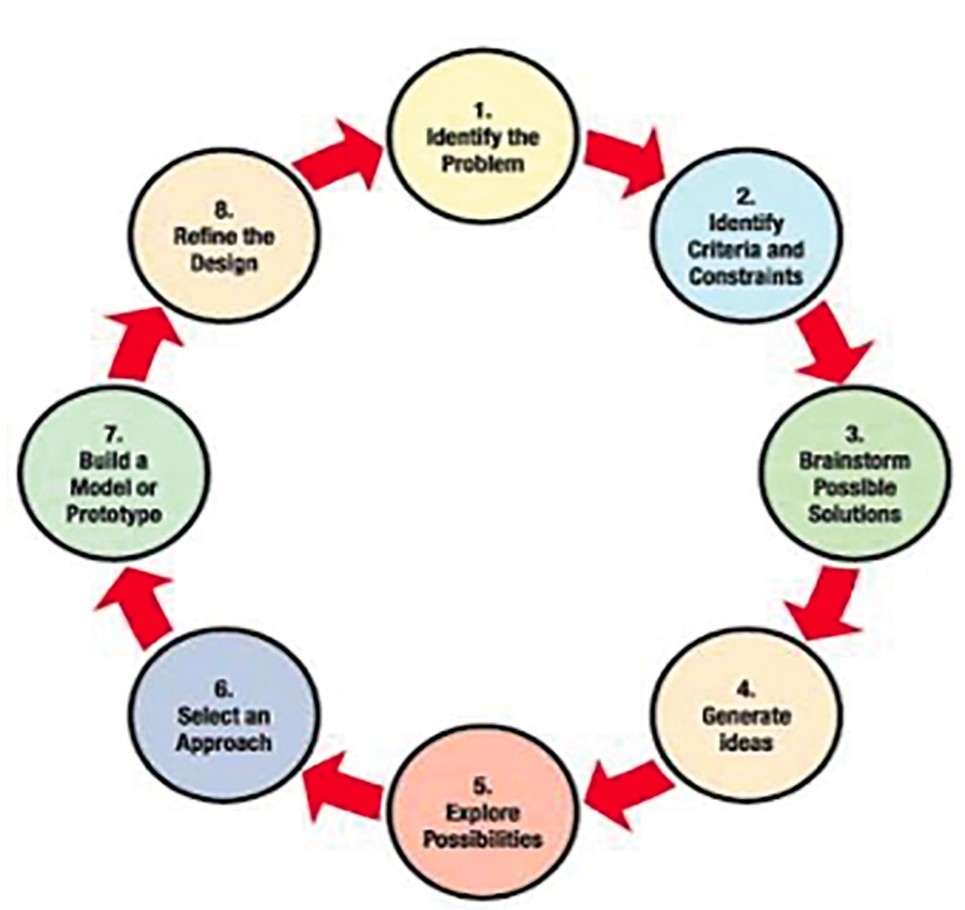
The engineering design process (NASA 2008).
| Table 1. Teachers’ materials and amount list. | ||||||||||||||||||||||||||||
|---|---|---|---|---|---|---|---|---|---|---|---|---|---|---|---|---|---|---|---|---|---|---|---|---|---|---|---|---|
|
| Table 2. Students’ material purchasing price sheet. | |||||||||
|---|---|---|---|---|---|---|---|---|---|
|
In this task, students are asked to create a water filter inside a 16 oz. bottle using a limited supply of household materials (see Table 1) and restricted by a budget (see Table 2). This method is similar to a previous article by Berge et al. (2014), with modifications that include use of household materials rather than lab equipment to construct the filters. Students also design a method for implementing and testing solar disinfection on their water samples. Throughout the process, students collect data to make informed design choices. It is important that the design process does not become one that is the result of trial and error experimentation, but rather remains focused on making specific and informed design choices based on data. We have found the design log (see Appendix B in Supplemental Materials) to be particularly helpful in this endeavor.
Students begin with an engineering design brief (Gooding and Metz 2007) that outlines their task, constraints, materials, and the evaluation rubric for their water filters (see Table 3; see also Appendix B in Supplemental Materials). In this example, students had previous experience with using the engineering design log. For students who have not previously used a design log, the teacher should walk through the log and expectations before students begin the process.
Though students are working together to create their filters, each student is responsible for their own design log (see Appendix B in Supplemental Materials). In the design log, students draw models, make notes, and collect data. Students also record their revised designs in the log. The filter design rubric (see Table 3) outlines the criteria that student filters are evaluated on, including their initial sketched design, the filters’ effectiveness at removing contaminants, the speed of filtration, and students’ ability to revise and improve their prototype design. Students are evaluated not only on the quality and effectiveness of their filter, but also on the design process and a written debrief and justification of their design process. This helps students stay accountable and makes sure they are expressing their own thoughts and not just following along with the group or engaging in trial and error.
Working in small groups, students view and evaluate the available materials, and each group is given $275 in paper play money. The financial constraint helps steer students toward taking a strategic approach to the design and building of their filters, rather than simply engaging in trial and error with unlimited access to materials. If time permits, this would be a good opportunity for students to test the materials individually to determine the physical properties of each material and discuss with their groups what purpose they might serve in their filter design. If time does not permit, then teachers can provide students data about each material to help them make design choices. For example, a teacher may provide data about how quickly different materials filter water. This is often a point in the engineering design process where students may regress to using trial and error. It is important for students to have data-based evidence for their design choices so that they are engaging in the engineering design process as an engineer. You may remind students that they need to record data as part of their design log (see Appendix B in Supplemental Materials) and document the data that supports their design choices.
Students work together to brainstorm multiple designs for their filters (see Figure 3). Once they have at least three designs drawn and have worked out the budget for each, groups then choose one design to focus on. You can encourage students to use the criteria and rubric to make decisions regarding which design they want to focus on. They may end up combining different pieces from the design as they work based on the data and testing they complete as they work through the design process in their design logs (see Appendix B in Supplemental Materials). Students draw a refined and annotated blueprint of their design and create an itemized budget as part of their design log. After the design has been signed off on by the teacher to ensure the design is safe and that students have thought through the process and not just resorted to trial and error, student groups purchase their materials from a central table. The use of play money helps streamline this process, and portioning out materials in bags or cups ahead of time also helps this part of the process run more smoothly and ensures each group gets their money’s worth.
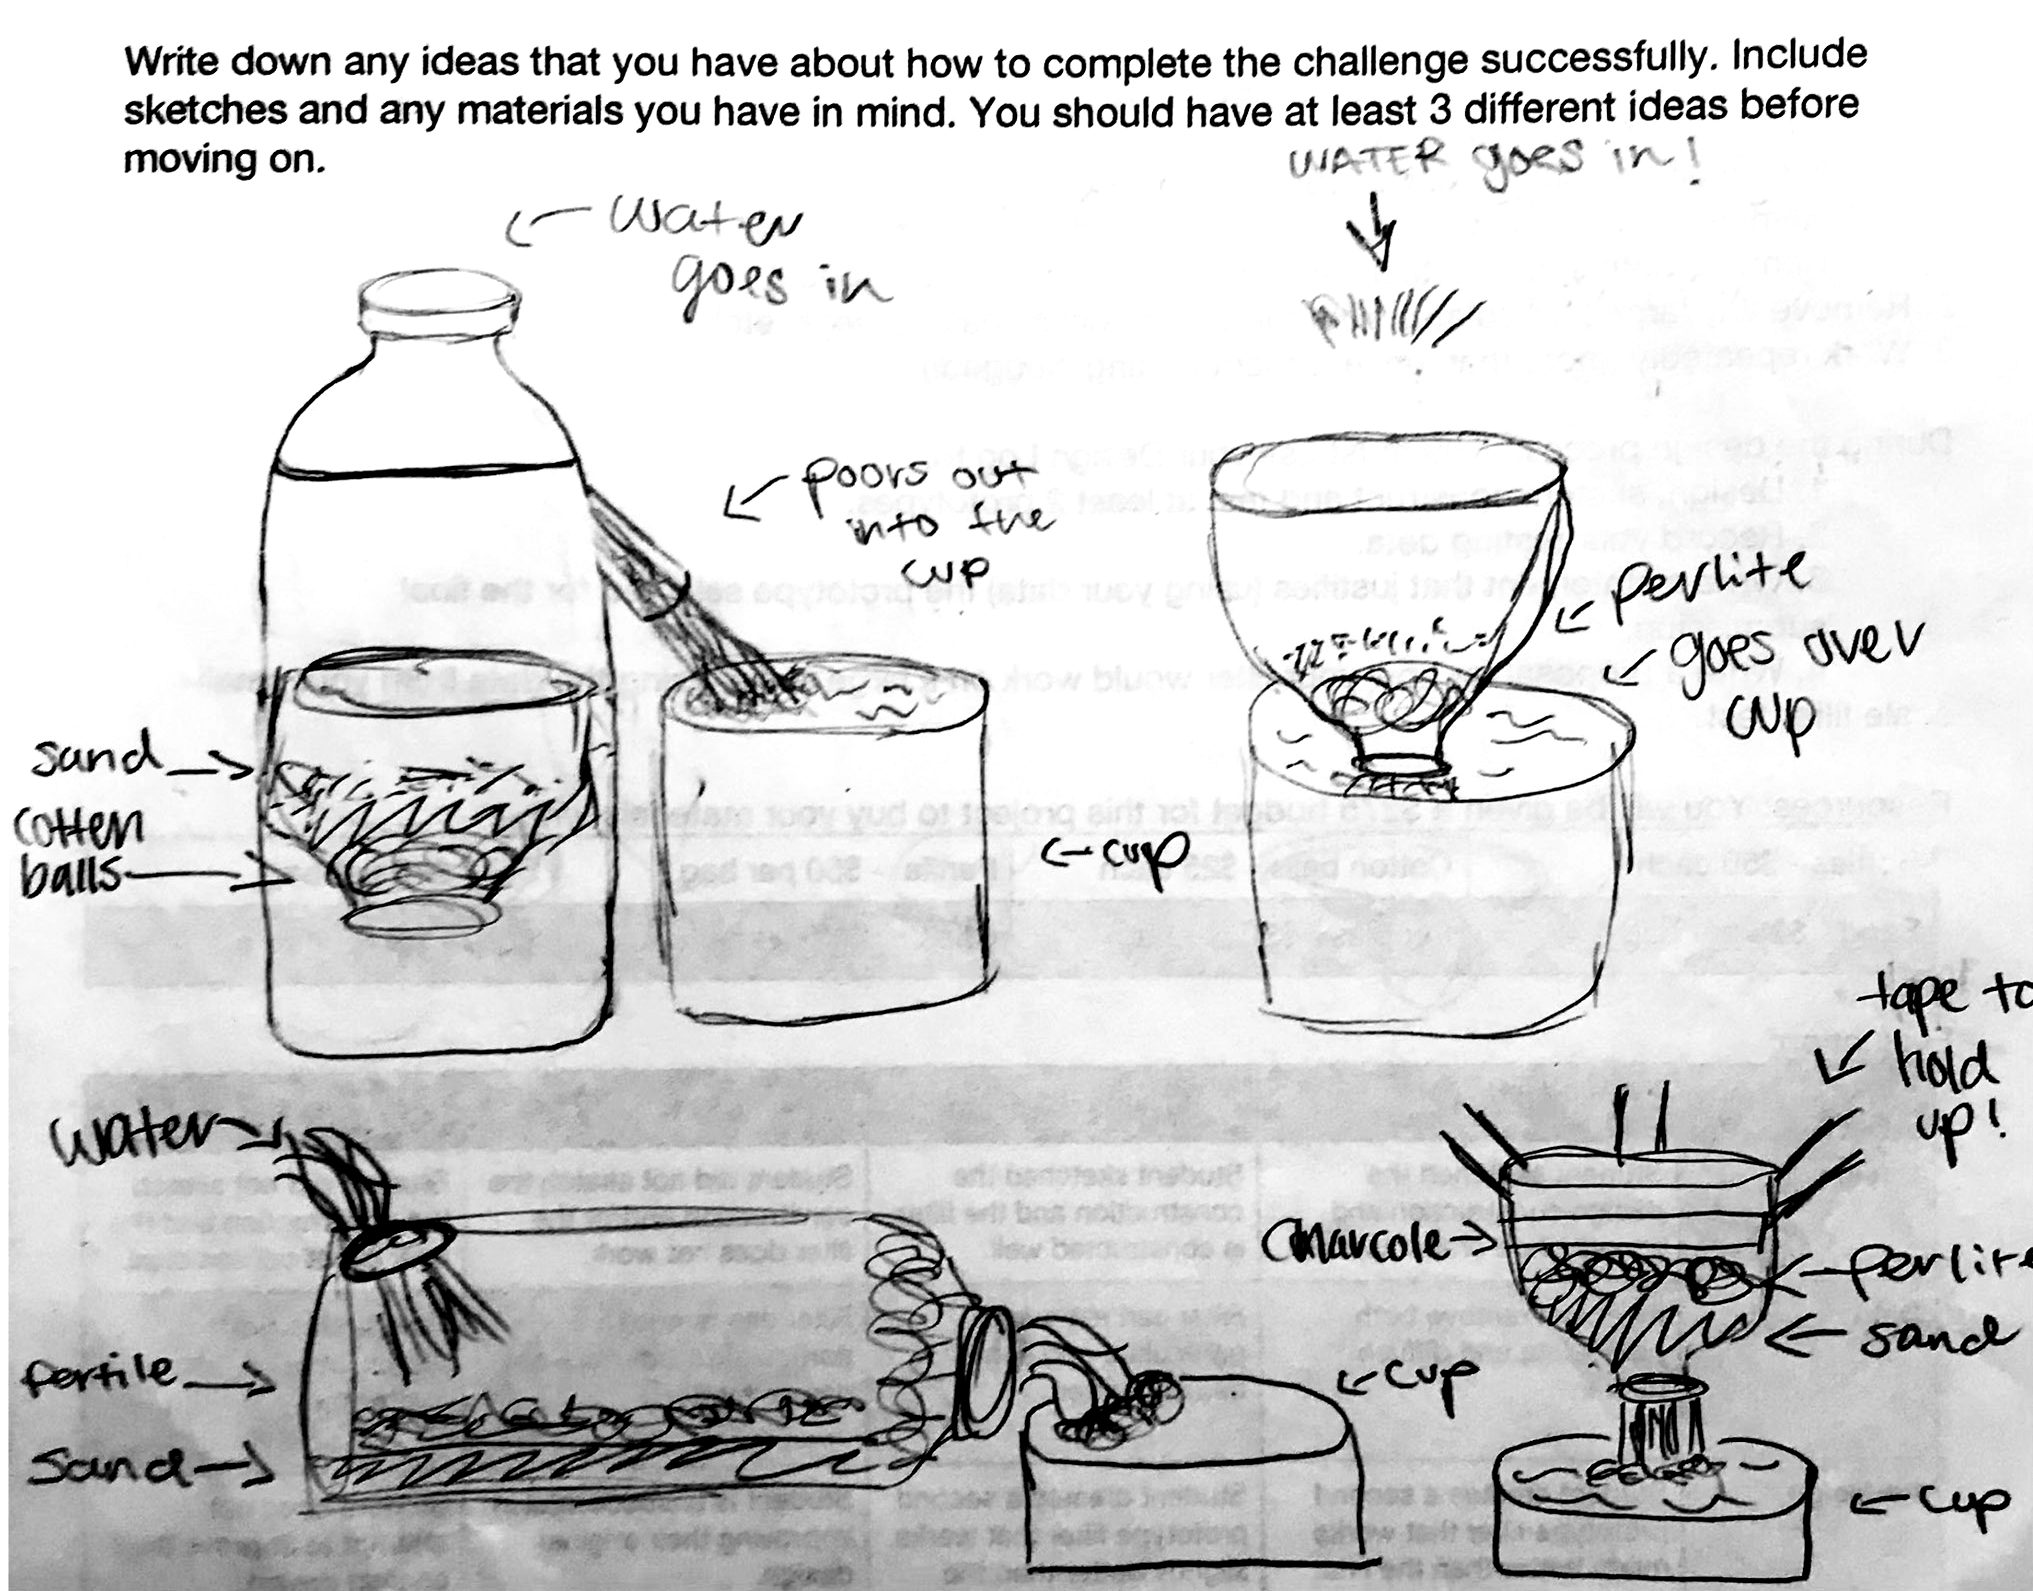
Example of water filter design.
Students work together in groups to build their filters (see Figure 4). Assigning roles or allowing students to self-assign can help keep the groups on track and managing their time well. Group roles might include a timekeeper, materials manager, facilitator to keep the group on task, and a reporter who speaks for the group in whole-group discussion. If students run into problems while building and want to change their design, they can mark on their blueprint using a different color than they originally used and annotate the changes. Safety issues during construction are minimal. Safety scissors can cut all but the toughest water bottles, although the teacher may want to keep a sharp pair set aside to help make the initial cut. Students should wear safety goggles when cutting and when working with sand. In addition, students should wash their hands after handling the “dirty” water.
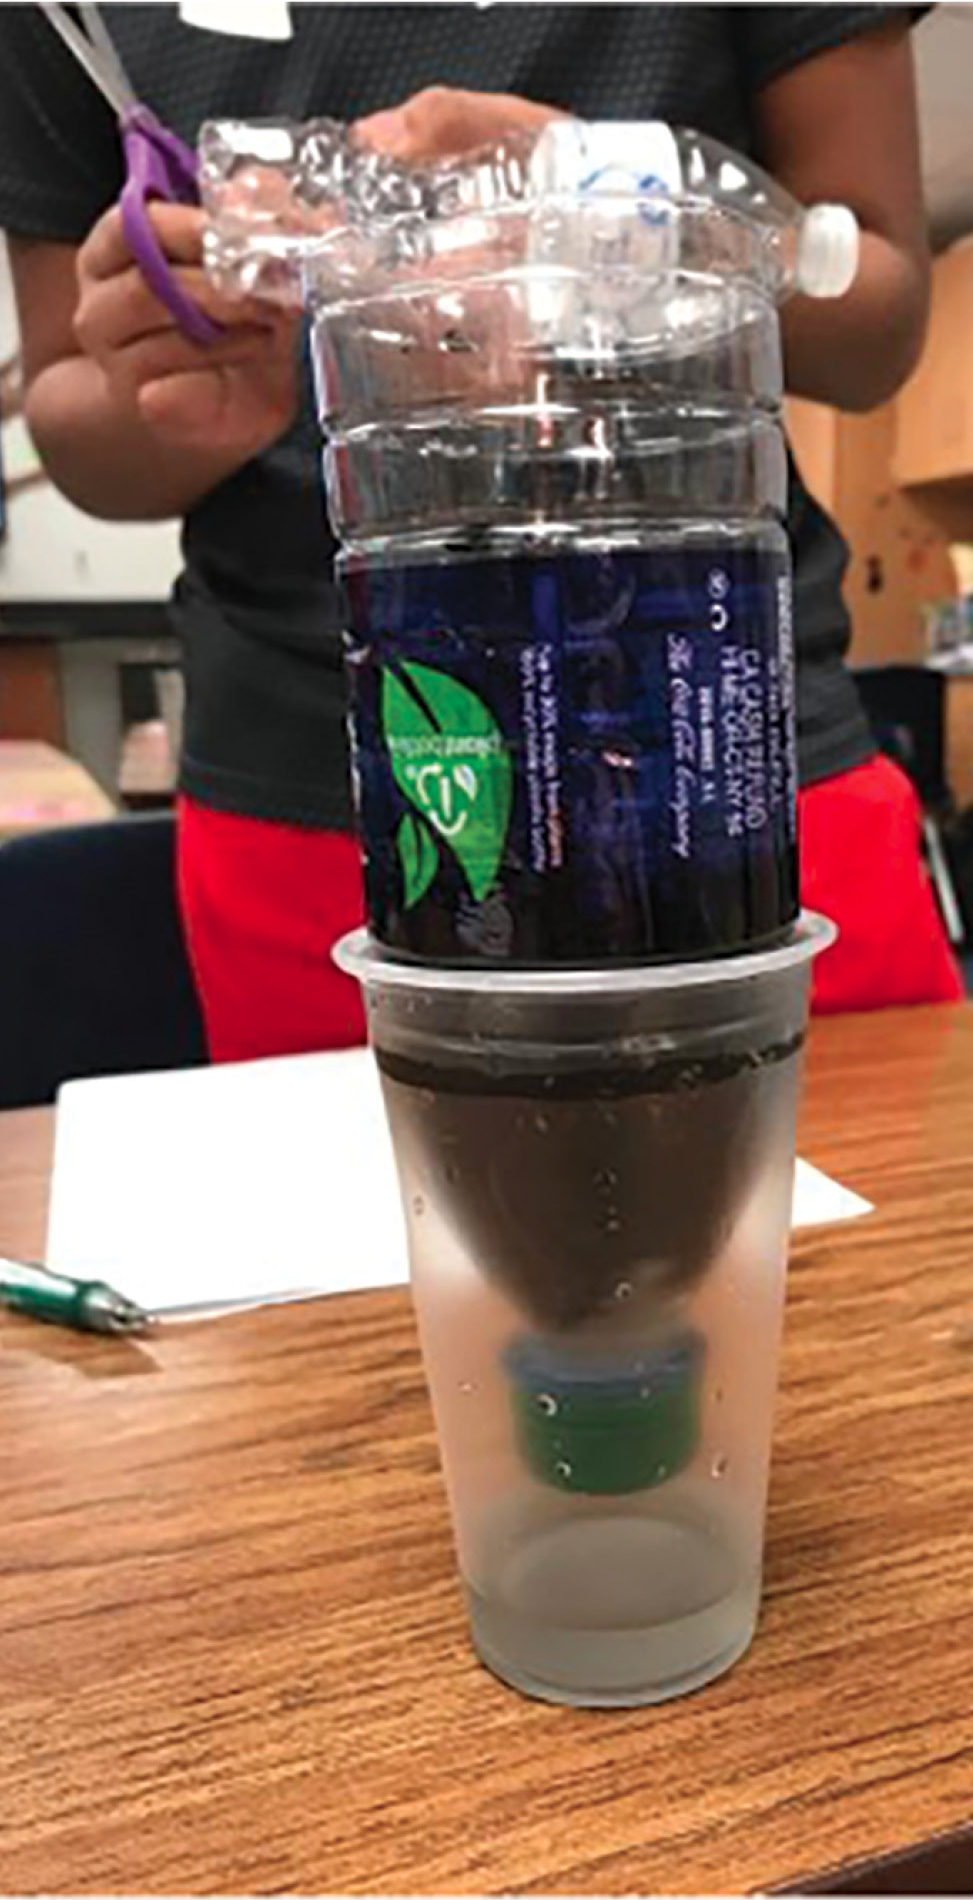
Example of a successful filter.
The teacher can prepare a water sample for the students to use to test their designs by mixing clean water with dirt, clay, sand, or silt, as well as larger particulates such as shredded leaves. Very fine glitter also works well as an example of a fine particulate and provides a more significant challenge for the filter. Food coloring added to the water sample also helps simulate dissolved contaminants and is a good indicator for how well the water filters work by providing a measure for students to test the effectiveness of their filter; the more color that is removed, the more effective the filter is. Students then test their designs and should note the results of their test and any changes that need to be made in their design log.
Groups should evaluate their filter on a number of quantitative and qualitative criteria, including the filter’s ability to strain out large and small particulate, diffuse material (such as food coloring or suspended silt), and the speed at which the filter is able to process the sample. These criteria should be provided by the teacher and made clear in the rubric as well. One way to test the turbidity, or cloudiness, of the filtered water is to allow the water to settle overnight and observe the sediments at the bottom of the container the next day. If the teacher wants students to collect quantitative data to support their results, students can use a turbidity sensor or transparency tube to collect measurements of turbidity. The sensors require additional software and transparency tubes can be purchased, but the tubes are also an easy, low-cost, make-it-yourself project.
Once students have completed their initial tests and noted the results in their design log, they discuss with their group what changes they will make to the second iteration of their design. Any changes students make on the second iteration are noted in the design log. Groups are then given $100 in play money to purchase additional materials for their prototype modifications. Students can modify their design and test their filters again, noting the results of their tests and any possible changes they wish to make. At this point, the teacher decides how many iterations to allow students to make. By the third iteration, many groups will have significantly improved their designs from the initial test.
As the final step in the engineering design brief, students write a debrief and justification that includes their reasoning for their initial designs, test outcomes, changes, and suggestions for future designs. Students work on their written justifications while completing the next two steps of the task.
Solar disinfection
After designing and testing their water filters, students consider and discuss the question, “Is clear water clean water?” This ties back into the initial discussion and role-play during which students explored waterborne illnesses. Once students have identified the possibility of contamination in clear water, the teacher introduces the concept of solar disinfection (McGuigan et al. 2012). Solar disinfection is a simple and low-cost method by which pathogens can be eliminated from water samples. Samples are placed in clear plastic containers and exposed to sunlight for 8 to 48 hours, eliminating the vast majority of waterborne pathogens. The pathogens are killed by a combination of the ultraviolet part of sunlight being absorbed and the increased temperature (solar thermal) from the sun’s energy. However, this method is only effective for low-turbidity samples (which often necessitates filtration before disinfection). The class can then research how solar disinfection might work and what factors may make this method more or less successful at eliminating waterborne pathogens.
Instructors can prepare their own samples by mixing purified water with soil, sand, and debris (such as shredded leaves). By preparing samples of varying turbidity, ranging from clear to opaque, students will be able to examine the role that turbidity plays in solar disinfection. The next step in the process involves inoculating the water with bacteria, exposing the samples to sunlight, and then culturing the water. Guidance from NSTA Safety Advisory Board (2016) and legal safety practices (e.g., OSHA) state that middle school classrooms/laboratories are not equipped to perform hands-on activities involving the use and culturing of live bacteria. Given this, we recommend reaching out to a high school advanced biology colleague or a biology instructor at a local college who would be willing to inoculate and culture the water samples and photograph the results in their laboratory (the previously prepared water samples are inoculated with known bacteria, ensuring that samples will have bacteria in their samples that can be cultured). We recommend purchasing a strain of bacteria that has been recommended for use in school classrooms (see Microbiology in Schools Advisory Committee 2010), such as the K–12 strain of Escherichia coli; these microorganisms can be purchased at low cost from reputable biological supply companies.
Once colonies have developed, photographs should be taken of the bacterial colonies and sent back to the middle school to be shared with the science class. Again, sharing of the live bacteria samples themselves should not occur, as this is not safe for a middle school classroom/laboratory. Students can then count the colonies in the photos and use that data to evaluate the effectiveness of the solar disinfection treatment. Students should share data between groups and class periods to identify trends and use collected bacterial colony data to evaluate the outcome of the solar disinfection treatment and the role that turbidity played in its effectiveness.
Final class discussion
During the final discussion, students reconvene as a class to discuss their methods and outcomes. As a possible prompt, students might consider the effect of filtering the water before treatment, as the increased clarity of the water can help improve the efficacy of the solar treatment. If an external control such as bottled water was used, the discussion could include questions about the efficacy of the solar disinfection treatment versus the conventional large-scale purification methods. If the students feel that this method purified the water sample to an acceptable level, they can brainstorm and record uses for this type of treatment. Students’ summative assessment for this unit includes evaluation of their engineering design brief, the efficacy of their water filter design, the written justification, and their analysis and explanation of the agar plate data.
Conclusion
Access to potable water and the dangers of waterborne illnesses is a major worldwide issue and affects students and their families wherever they live. By considering the problem of accessing potable water, students gain the opportunity to identify, design, test solutions, and build their scientific thinking skills. As students work through the science and engineering practices that are incorporated throughout this unit, they gain confidence as well as knowledge. •
Supplemental Materials
Table 3. Filter Design Rubric—https://bit.ly/3yIBc7k
Appendix A—https://bit.ly/3mclzOA
Appendix B—https://bit.ly/3x5GA2h
Connecting to the Next Generation Science Standards—https://bit.ly/3zgzwCP
Online Resources
Epidemiological card sort activity (original version) and related materials are available at https://bit.ly/3z7Ktqd
Brooke A. Whitworth (bwhitwo@clemson.edu) is an associate professor of science education in the Department of Teaching and Learning at Clemson University in Clemson, South Carolina. Shelby A. Watson is a doctoral candidate and graduate research fellow in the Center for Mathematics and Science Education at the University of Mississippi in Oxford.