
feature
Rainbow to Grow
How Different Colors of Light Influence Plant Growth
Science Scope—July/August 2022 (Volume 45, Issue 6)
By Sofia N. Gomez, Julie M. Angle, and Andrew Doust
CONTENT AREA Biological Sciences
GRADE LEVEL 6–8
BIG IDEA/UNIT Students measure how the visible light spectrum impacts plant growth and compare results obtained from different species of plants.
ESSENTIAL PRE-EXISTING KNOWLEDGE Basic understanding of how to make and interpret tables and graphs
TIME REQUIRED Six 60-minute class periods and ten 10-minute periods for data collection
COST Initial cost: approximately $84 Yearly cost: approximately $15
SAFETY Monitor students for potential allergies to plants and proper use of lab materials.
We have all observed a rainbow peeking out from behind the clouds after a rain. From a science perspective, I know that raindrops take on the role of a dispersive prism, splitting natural light into its individual colors. But from a personal perspective, I feel awe when I view one of nature’s most beautiful natural phenomena.
Unlike microwaves or ultraviolet waves, visible light is part of the electromagnetic spectrum that is discernible to the human eye. Electromagnetic waves that fall within the visible light spectrum have wavelengths between approximately 370 and 700 nm (nanometers). Figure 1 identifies wavelengths in the visible light spectrum, as well as their corresponding colors that compose a rainbow: violet, indigo, blue, green, yellow, orange, and red. This light is a form of energy that plants use to photosynthesize.
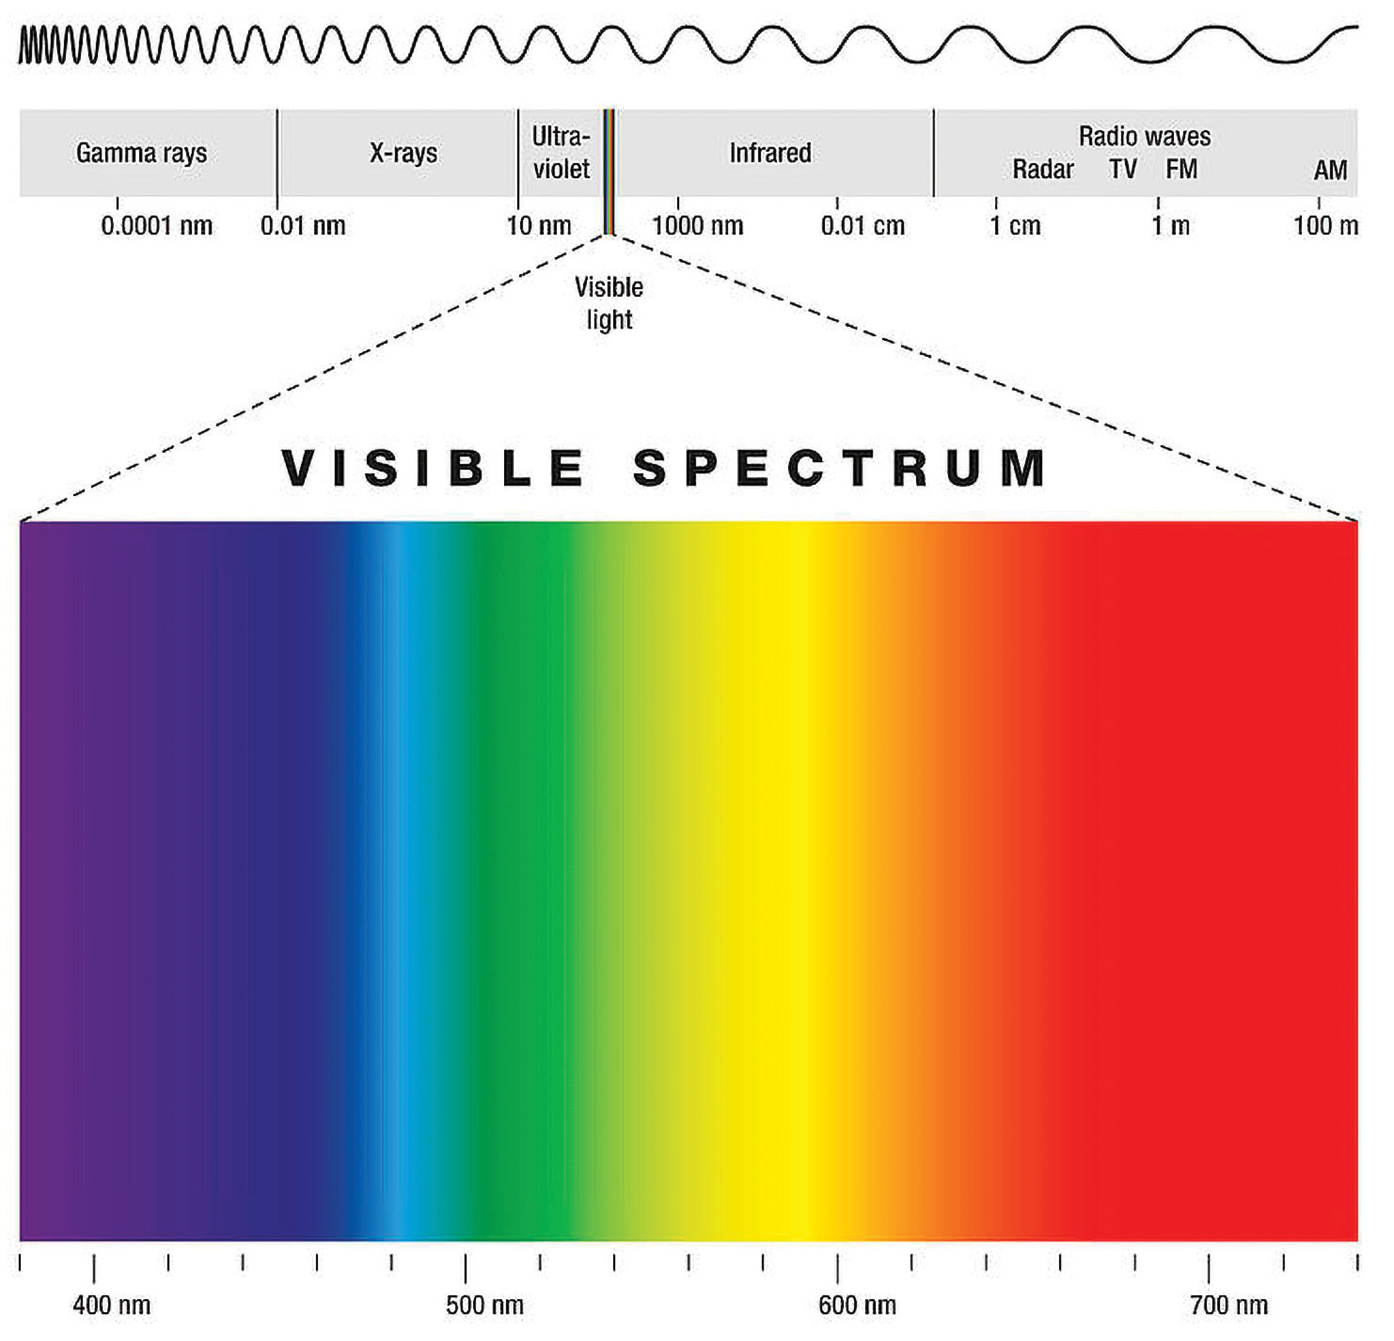
The visible spectrum of light is a range of wavelengths that the human eye can sense, ranging from 370 to 700 nm. On the left end of the spectrum, violet wavelengths have the shortest wavelengths, ranging from 370 to 400 nm. On the right or red end of the spectrum, these “long” electromagnetic waves range 630 to 700 nm. Image created by P.H. Furian (https://bit.ly/3wLXfrr).
The arc of colors typically associated with a rainbow result from the refraction of light as it passes through water droplets in the atmosphere. Water is denser than air, and the transition between air and water causes light waves to slow and bend. Visible light waves with shorter wavelengths, such as violets and blues, bend more than light waves with longer wavelengths, such as those at the red and orange end of the spectrum, leading to the separation of colors seen in a rainbow.
Light can also be separated by using colored filters, which filter out wavelengths other than the color of the filter. For example, when you wear red-tinted sunglasses, everything you see looks red. The leaves of plants also act as filters, absorbing red and blue wavelengths (which are used as energy sources for photosynthesis) and passing through green wavelengths, as well as wavelengths that are much shorter (such as UV) or much longer (such as far-red and infrared wavelengths).
Light quality (the relative abundance of each of the wavelengths of light) can tell a plant whether it is being crowded by other plants as well as orienting the plant to where it can grow to find better light conditions. In the case of overcrowding or shading, it is the increased amount of far-red wavelengths relative to red (because red is absorbed by the over-topping leaves) that plants use to assess whether they are in the shade or in sun. If in shade, they react via the shade avoidance response (Fiorucci and Fankhauser 2017) to grow taller, escape shade, and reach sunlight (Casal, Sanchez, and Deregibus 1986). Plants also grow preferentially toward blue wavelengths, as anyone who has grown plants on a windowsill can attest to. This is known as phototropism, where stems grow toward sunlight (Holland, Roberts, and Liscum 2009).
With an understanding of various light cues, we can attempt to predict how a plant may alter its growth. However, different plants, because they come from different habitats, may not all grow equally well in any one environment, and it is necessary to experiment with different growing environments to get the best response. Understanding and predicting how plants might behave is the work of horticulturists and plant biologists, who use their understanding of different light wavelengths to increase crop yield and maximize plant growth (Wan and Sosebee 1998).
Lesson overview
This article describes a six-day 5E lesson where students take on the role of horticulturists to help their mentor, Dr. Doust, in identifying the best growing conditions for a new species of plant from the Amazonian Rainforest (see Slide 1 from the Engage Teacher PowerPoint; see also Supplemental Materials). Students explore the different wavelengths of visible light and seek an answer to aspects of the lesson’s driving question, “How can different light colors affect plant growth?” The activities in this lesson provide students with the skill set to construct scientific explanations based on evidence for how environmental factors influence the growth of plants. Additional detail about managing each of the activities described in the manuscript is provided in the Supplemental Materials and include PowerPoint presentations, teacher handouts, rubrics, and student handouts for each phase of the lesson.
The lesson begins with students observing plants grown in different environments and light conditions and engaging in a discussion to identify aspects that make an environment suitable for plant growth. Student groups then plan, design, and conduct an experiment to observe plant growth in response to light color. They collect and analyze data, draw conclusions, and use evidence to support their claims about plant growth in response to light. In a group discussion, students identify patterns found in the data they collected on plant growth and compare their claims to claims made by their peers. Leveraging knowledge gained from this discussion, students apply the identified natural patterns to construct arguments—supported by their empirical evidence and scientific reasoning—to strengthen their explanations for plant growth in response to different wavelengths of light.
Engagement phase
In the Engagement phase, students participate in the Amazon Expedition activity. Students are presented with the storyline following Dr. Doust, an intrepid international plant collector. Dr. Doust and his team recently returned from an Amazon rainforest expedition and brought back seeds from a mysterious bright blue-green plant they discovered there. Dr. Doust asks the class to help him determine how the plant’s natural home environment can be mimicked in his lab (see Slide 3 from the Engage Teacher PowerPoint; see also Supplemental Materials).
Students are asked to examine pictures of plants grown in different light environments (see Figure 2) and compare and contrast the similarities and differences between the plants in each environment. In the discussion, the teacher can draw attention to how different amounts of light (Figure 2A), colors of light (Figures 2B, 2C), or direction of light (Figures 2D, 2E) affect plant growth. In his letter, Dr. Doust noted that botanists know a lot about how amount of light or direction of light affects plant growth but would like to better understand the role of the color of light in plant growth. He also noted that the color of light in the rainforest is affected by all of the plants growing there, and asks, “What do I need to know that will help me identify the environment with the best light conditions for our mystery plant?” (see Slide 12 from the Engage Teacher PowerPoint; see also Supplemental Materials). In groups, students generate a question about plant growth and optimal growing conditions on the basis of their previous discussion about how plants grow from the examination of Figure 2. Students use technology to submit their research questions to a virtual question board and compare their questions with those of their peers. This question board leads to the lesson’s driving question: “How can we help Dr. Doust better understand how different light colors affect plant growth?”
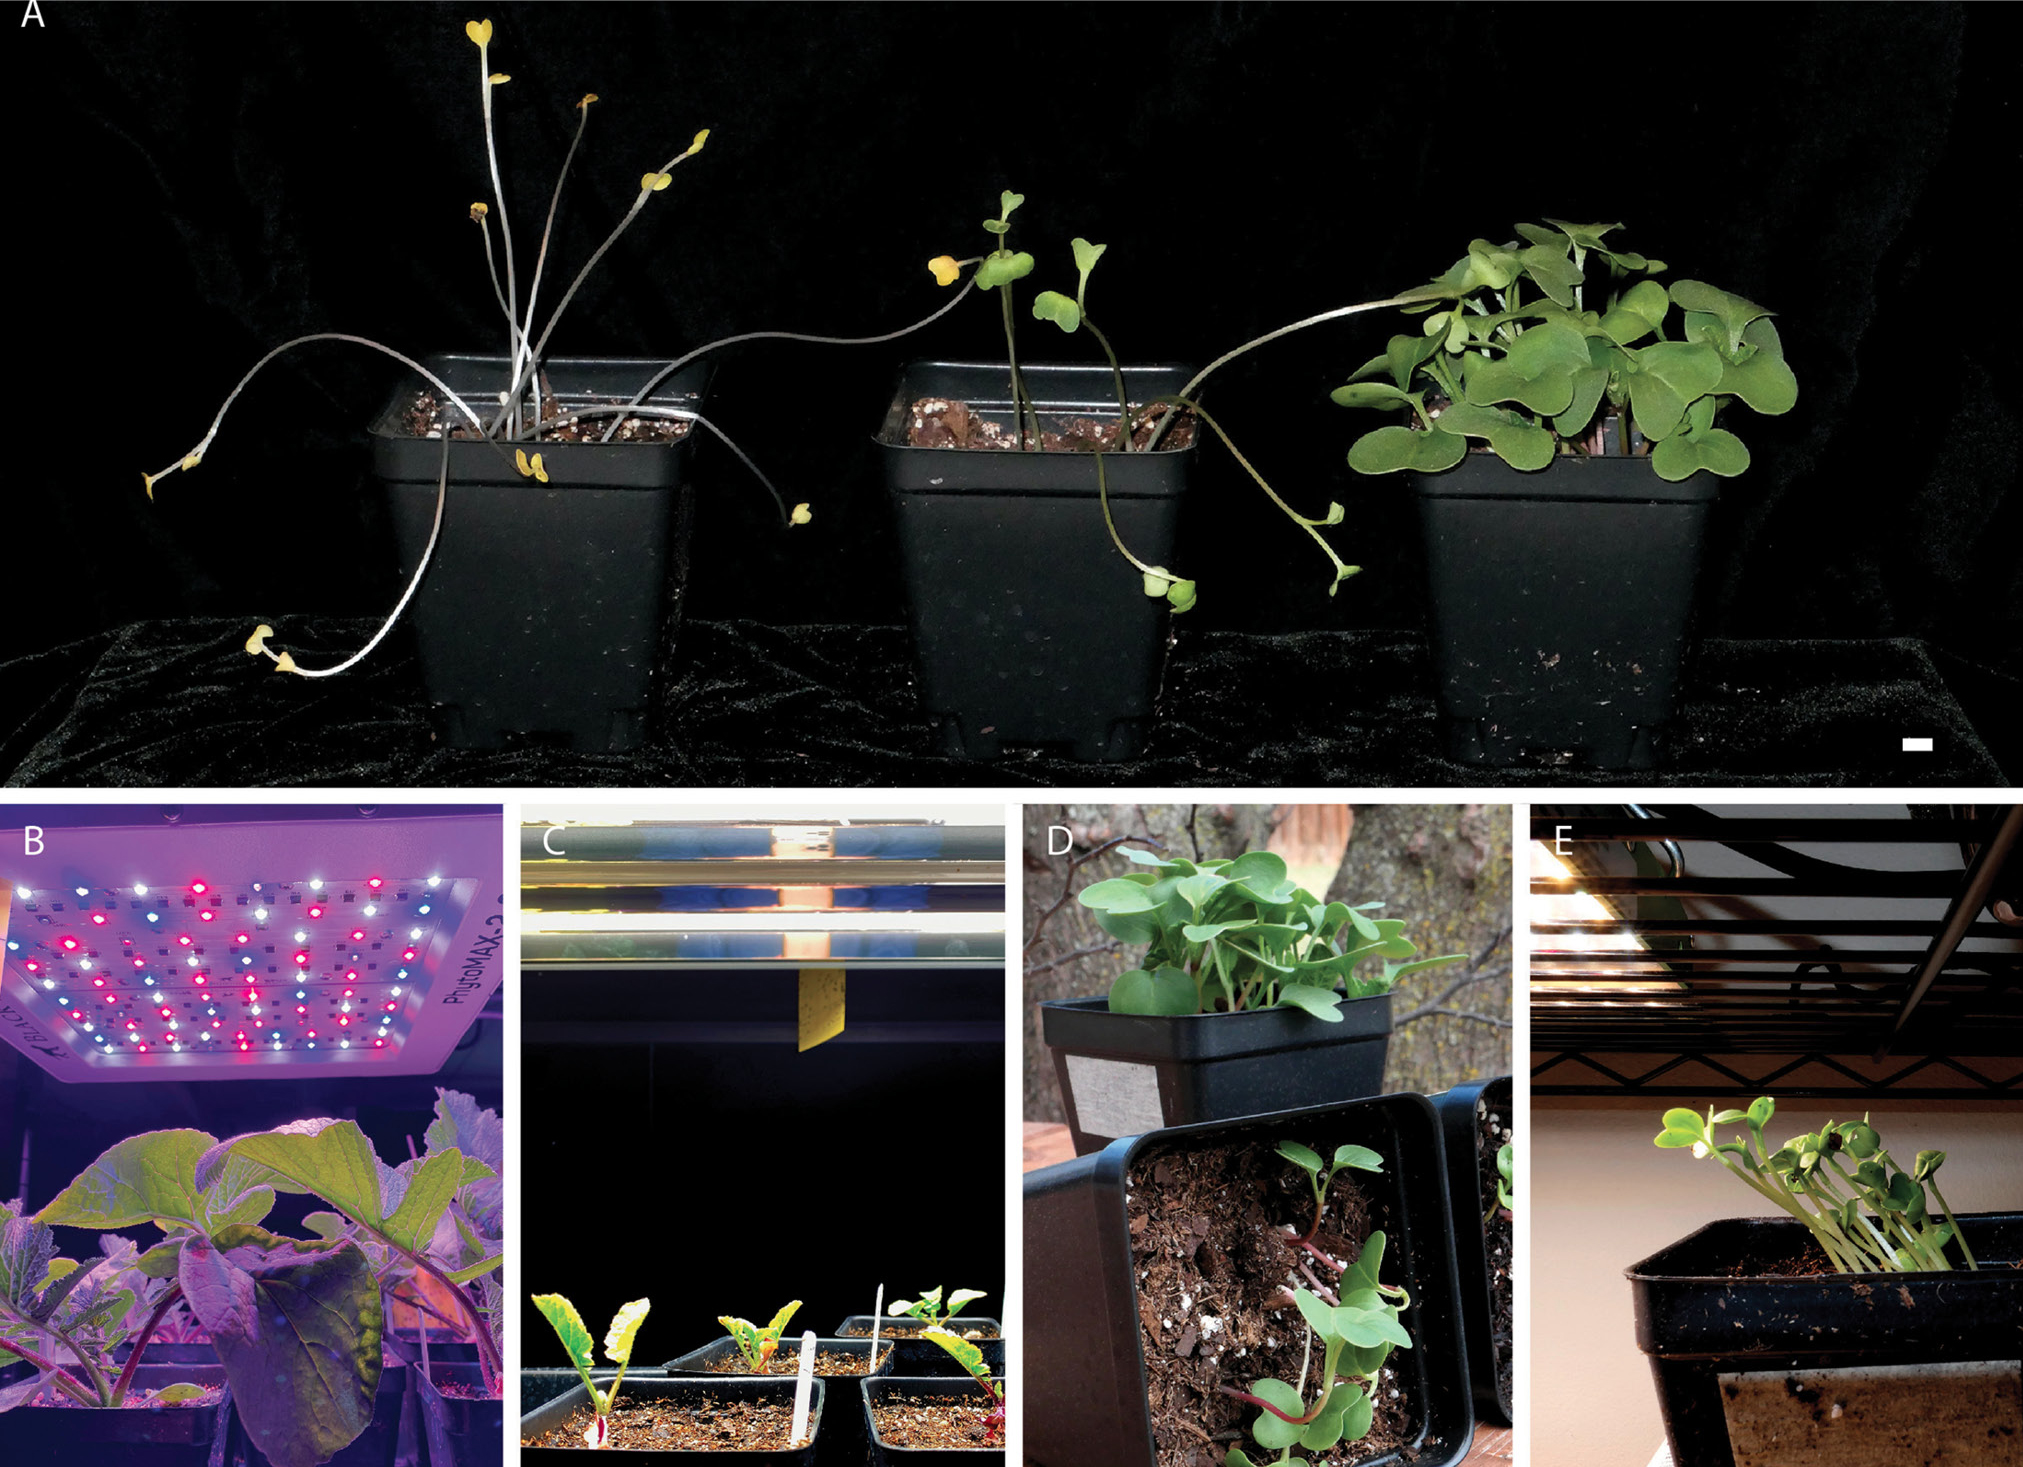
Radishes grown in a variety of lighting conditions: (A) from the left, radishes germinated in the dark, in dim light, and in bright light; (B) radishes growing under red and blue LED lights; (C) radishes growing under white fluorescent lights; (D) radish turned sideways during growth that has reoriented its growth upward toward the light and against gravity; (E) radish seedlings growing sideways toward a light source. All scale bars equal 1 cm.
As the class reviews the questions on the board, students learn that not everyone has the same questions. This leads to a discussion about how science is a human endeavor that is based on prior experiences, which may stem from differences in social and cultural backgrounds.
Safety in the Classroom: Because the Amazon Expedition activity has a digital component, I monitor students for appropriate behavior as they access the internet.
Exploration phase
During the Rainbow to Grow Lab activity, the storyline continues with Dr. Doust asking students to conduct background research as a way to better understand how plants grow in different environments. Students develop a research project to address an aspect of the lesson’s driving question to learn how different colors of light can affect plant growth. During this experimental process, students identify a hypothesis, design and execute an experiment to test their hypothesis, and collect and analyze data.
To simulate different wavelengths of light, student groups of three to four students—determined by seating arrangements or random selection—choose colors of cellophane sheets to use in their experiment. In addition to cellophane, students select the type of plant (radish, corn, or mung bean seeds) they want to work with and generate a research question and hypothesis for how their colored cellophane would affect their plants. Students are also responsible for identifying their variables (independent, dependent, and controls), the materials they plan to use in their experiment, and the quantitative and qualitative data they plan to collect. Then they design and conduct their experiments (see Figure 3).
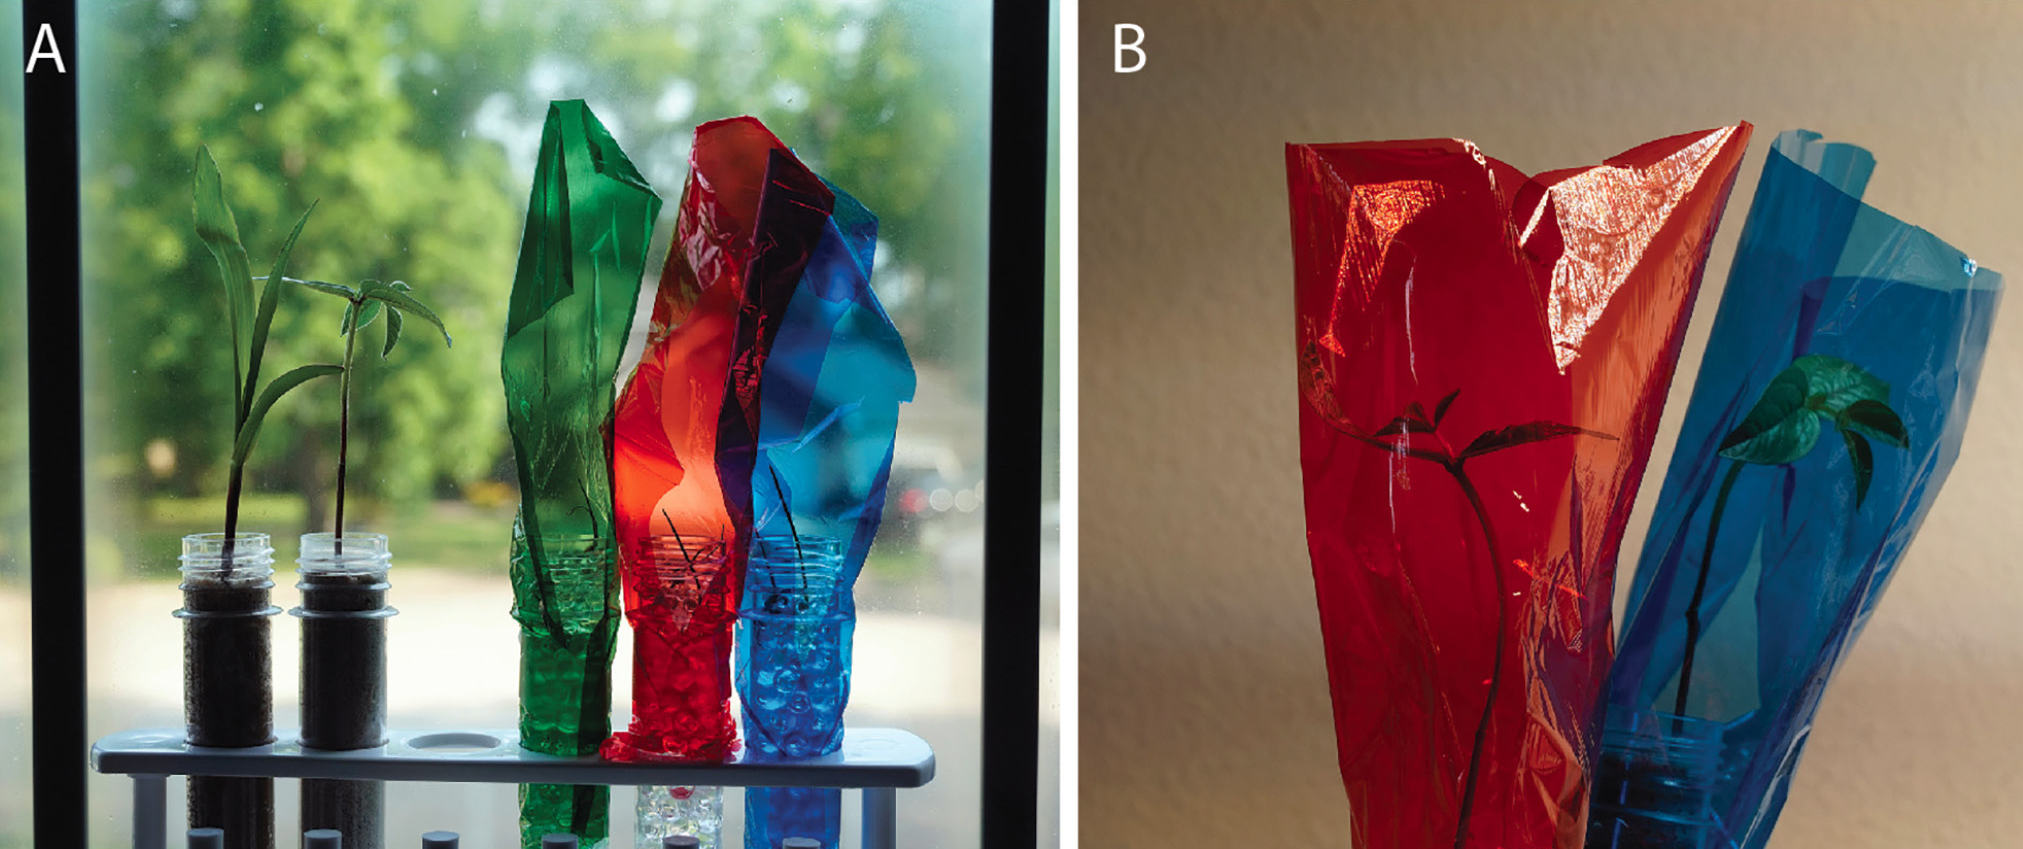
Two growth experiments under different lighting conditions: (A) an experiment looking at the effect of light on growth and behavior of plants, with experiment set up on a window sill; (B) two mung bean plants with an LED source to the right of the picture, showing the mung bean plant in the blue cellophane bending toward the light, while the plant in the red cellophane is insensitive to the direction of the light. These illustrations show only one plant per color treatment, but in reality, more plants per treatment would be needed to draw valid conclusions from the experiment.
Through designing and constructing their experiments, students experience that scientific knowledge is a product of the creative and imaginative nature of human innovation. This aspect of the nature of science includes determining which research question to ask, experimental design to construct, data to collect, evidence to use to support their claim, and information to share with their peers.
Safety in the Classroom: Because students work with plants, caution should be used regarding plant allergies. Additionally, typical lab safety protocols are enforced such as no running, roughhousing, or other laboratory misconduct. When working with soil, students must wash their hands.
Explanation phase
In the Explanation phase, students are presented with the following narrative: “Dr. Doust wants to see what they have learned as a result of their experiments about plant growth! He suggests that they develop a presentation to showcase their investigation and findings.” Student groups are tasked with developing a scientific claim that addresses their findings and explains if their hypothesis is supported by their evidence. Students first identify data collected and then the evidence they will use to construct a scientific explanation to support their claim. Like researchers at a scientific conference, each group creates a presentation showcasing how their specific light color affected plant growth. Each presentation includes a research question, hypothesis, experimental design, data collected, and claims made (see Explain—teacher and student handouts in Supplemental Materials) and articulates a claim that relates plant growth and light colors, including how environmental factors may influence growth.
By presenting their research and scientifically supported claims to their peers, student groups engage in a peer-review process, similar to researchers in their scientific community. Students take notes and provide written feedback for each of their peers’ projects, which holds students accountable for listening to presentations. To simulate the peer review process, I moderate student discussions to focus on constructive criticism to improve their peer’s research skills. In addition to reviewing their peers’ experimental design, students also engage in a discussion regarding their agreement or disagreement with claims made by other groups.
Safety in the Classroom: The presentation activity in the Explanation phase is almost entirely digital, so I monitor students as they access the internet. I do this to keep students on task and to make sure students use school-appropriate websites and resources while creating their research presentation.
Elaboration phase
During the Elaboration phase, the storyline continues with Dr. Doust providing spectral and growth data from his own laboratory experiment, where he observed the growth of the bluish-green Amazonian plant under red, blue, and green grow lights. Students participate in the Wave Watchers activity, where they analyze data collected by Dr. Doust from each of the three grow lab environments. Students identify the wavelengths of light available in each environment, as well as the environment that best promotes plant growth, to seek an answer to the lesson’s driving question.
This activity makes an additional connection to the electromagnetic visible light spectrum as an environmental factor. During conversations, students use terminology such as wavelengths, refraction, and nanometers to describe how each grow lab influenced the growth of plants.
To conclude the activity, students construct a written argument—supported by empirical evidence—that explains why one environment is more suitable for plant growth than another. This argument describes the pattern and relationship between available wavelengths of light, resulting plant growth, and reactions to the environment. By engaging in argumentation and defending their claims, students strengthen their scientific communication skills.
Evaluation phase
Students are assessed throughout the Rainbow to Grow lesson as a way to monitor their knowledge and understanding of the visible spectrum’s influence on plant growth. Three learning objectives are addressed throughout this lesson, with multiple formative assessments provided for each objective.
Learning Objective #1: Students construct experiments to measure the impact that light colors may have on plant growth. During the Exploration phase, students develop an experimental design, construct their own experiments, and collect data to provide evidence for how their selected light color affects the growth of their selected plant species.
Learning Objective #2: Students use collected and analyzed data to make a claim supported by evidence. During the Explanation phase, students use data collected during the Exploration phase to identify evidence that is then used to support a scientific claim that can connect light color to plant growth.
Learning Objective #3: Students identify environmental factors that may positively or negatively affect plant growth. During the Engagement phase, students determine characteristics of environments that can promote plant sustainability. The Elaboration phase activity extends students’ knowledge of developing claims to explain how environmental factors such as different wavelengths may aid or hinder plant growth.
Conclusion
This lesson engages students in learning about the colors on the visible light spectrum and how these colors can contribute to the environmental factors that affect plant growth. Students’ understanding of the process of science is strengthened through data collection and identification of evidence to support or refute their claims. Students apply their knowledge of wavelengths in the visible light spectrum to construct scientific explanations, based on evidence, for how environmental factors influence the growth of plants. Finally, students learn about the social and cultural embeddedness of science, as well as its creative and imaginative aspects, as they discuss with their peers the evidence—collected from their experiments—that supports or refutes their scientific claims. •
Acknowledgments
We thank the Doust lab in the Department of Plant Biology, Ecology, and Evolution at Oklahoma State University for allowing me to conduct the research that inspired this lesson and for inspiring the storyline navigating the lesson. This work was funded in part by the NSF Grant Numbers IOS-1938093 and IUSE-1725714.
Supplemental Materials
Engage—Teacher and student handouts—https://bit.ly/3xfhCyN
Engage—Teacher PowerPoint—https://bit.ly/3xeBVw9
Explore—Teacher and student handouts—https://bit.ly/3tcm1Qs
Explain—Teacher and student handouts—https://bit.ly/3xeHxGP
Elaborate—Teacher and student handouts—https://bit.ly/3NUhp9w
Elaborate—Teacher PowerPoint—https://bit.ly/3aorFsb
Evaluate—Teacher and student handouts—https://bit.ly/3x9rp86
Connecting to the Next Generation Science Standards—https://bit.ly/3ajf9ua
Sofia N. Gomez (gomezsn0@gmail.com) is a student in the College of Education and Human Sciences; Julie M. Angle is a professor in Science Education; and Andrew Doust is a professor in the Department of Plant Biology, Ecology, and Evolution, all at Oklahoma State University in Stillwater.
Biology Interdisciplinary Literacy Physical Science Middle School