
teacher’s toolkit
A Synthesis of Geospatial Tools for the Middle Grades
Science Scope—September/October 2022 (Volume 46, Issue 1)
By Kurtz Miller
Geographic Information Systems (GIS)—a system that creates, manages, analyzes, and maps geospatial data—was developed over 50 years ago, but these prevalent, public and private sector technologies are mostly absent in middle grades science curriculum and instruction. One of the biggest challenges with using GIS in the middles grades has traditionally been the complexity of collecting, inputting, and manipulating geospatial data in mapping programs. Thankfully, in the past 10 years, mapping platforms, software, and tools have become simplified and more user-friendly. This manuscript aims to introduce ESRI geospatial platforms and tools for science classrooms. ESRI is the largest international supplier of GIS mapping products and is committed to K–12 schools. There are few concise resources available to help teachers of science understand free geospatial resources; this manuscript aims to fill this gap (see Figure 1; see also “Web resources for ESRI StoryMaps, GeoInquiries, and ArcGIS Online” and “How to access GIS textbooks, GIS lesson plans, GIS resources” in Supplemental Materials. Before moving forward, please watch the introductory video “A Synthesis of Geospatial Tools for the Middle Grades” (see link in Online Resources).
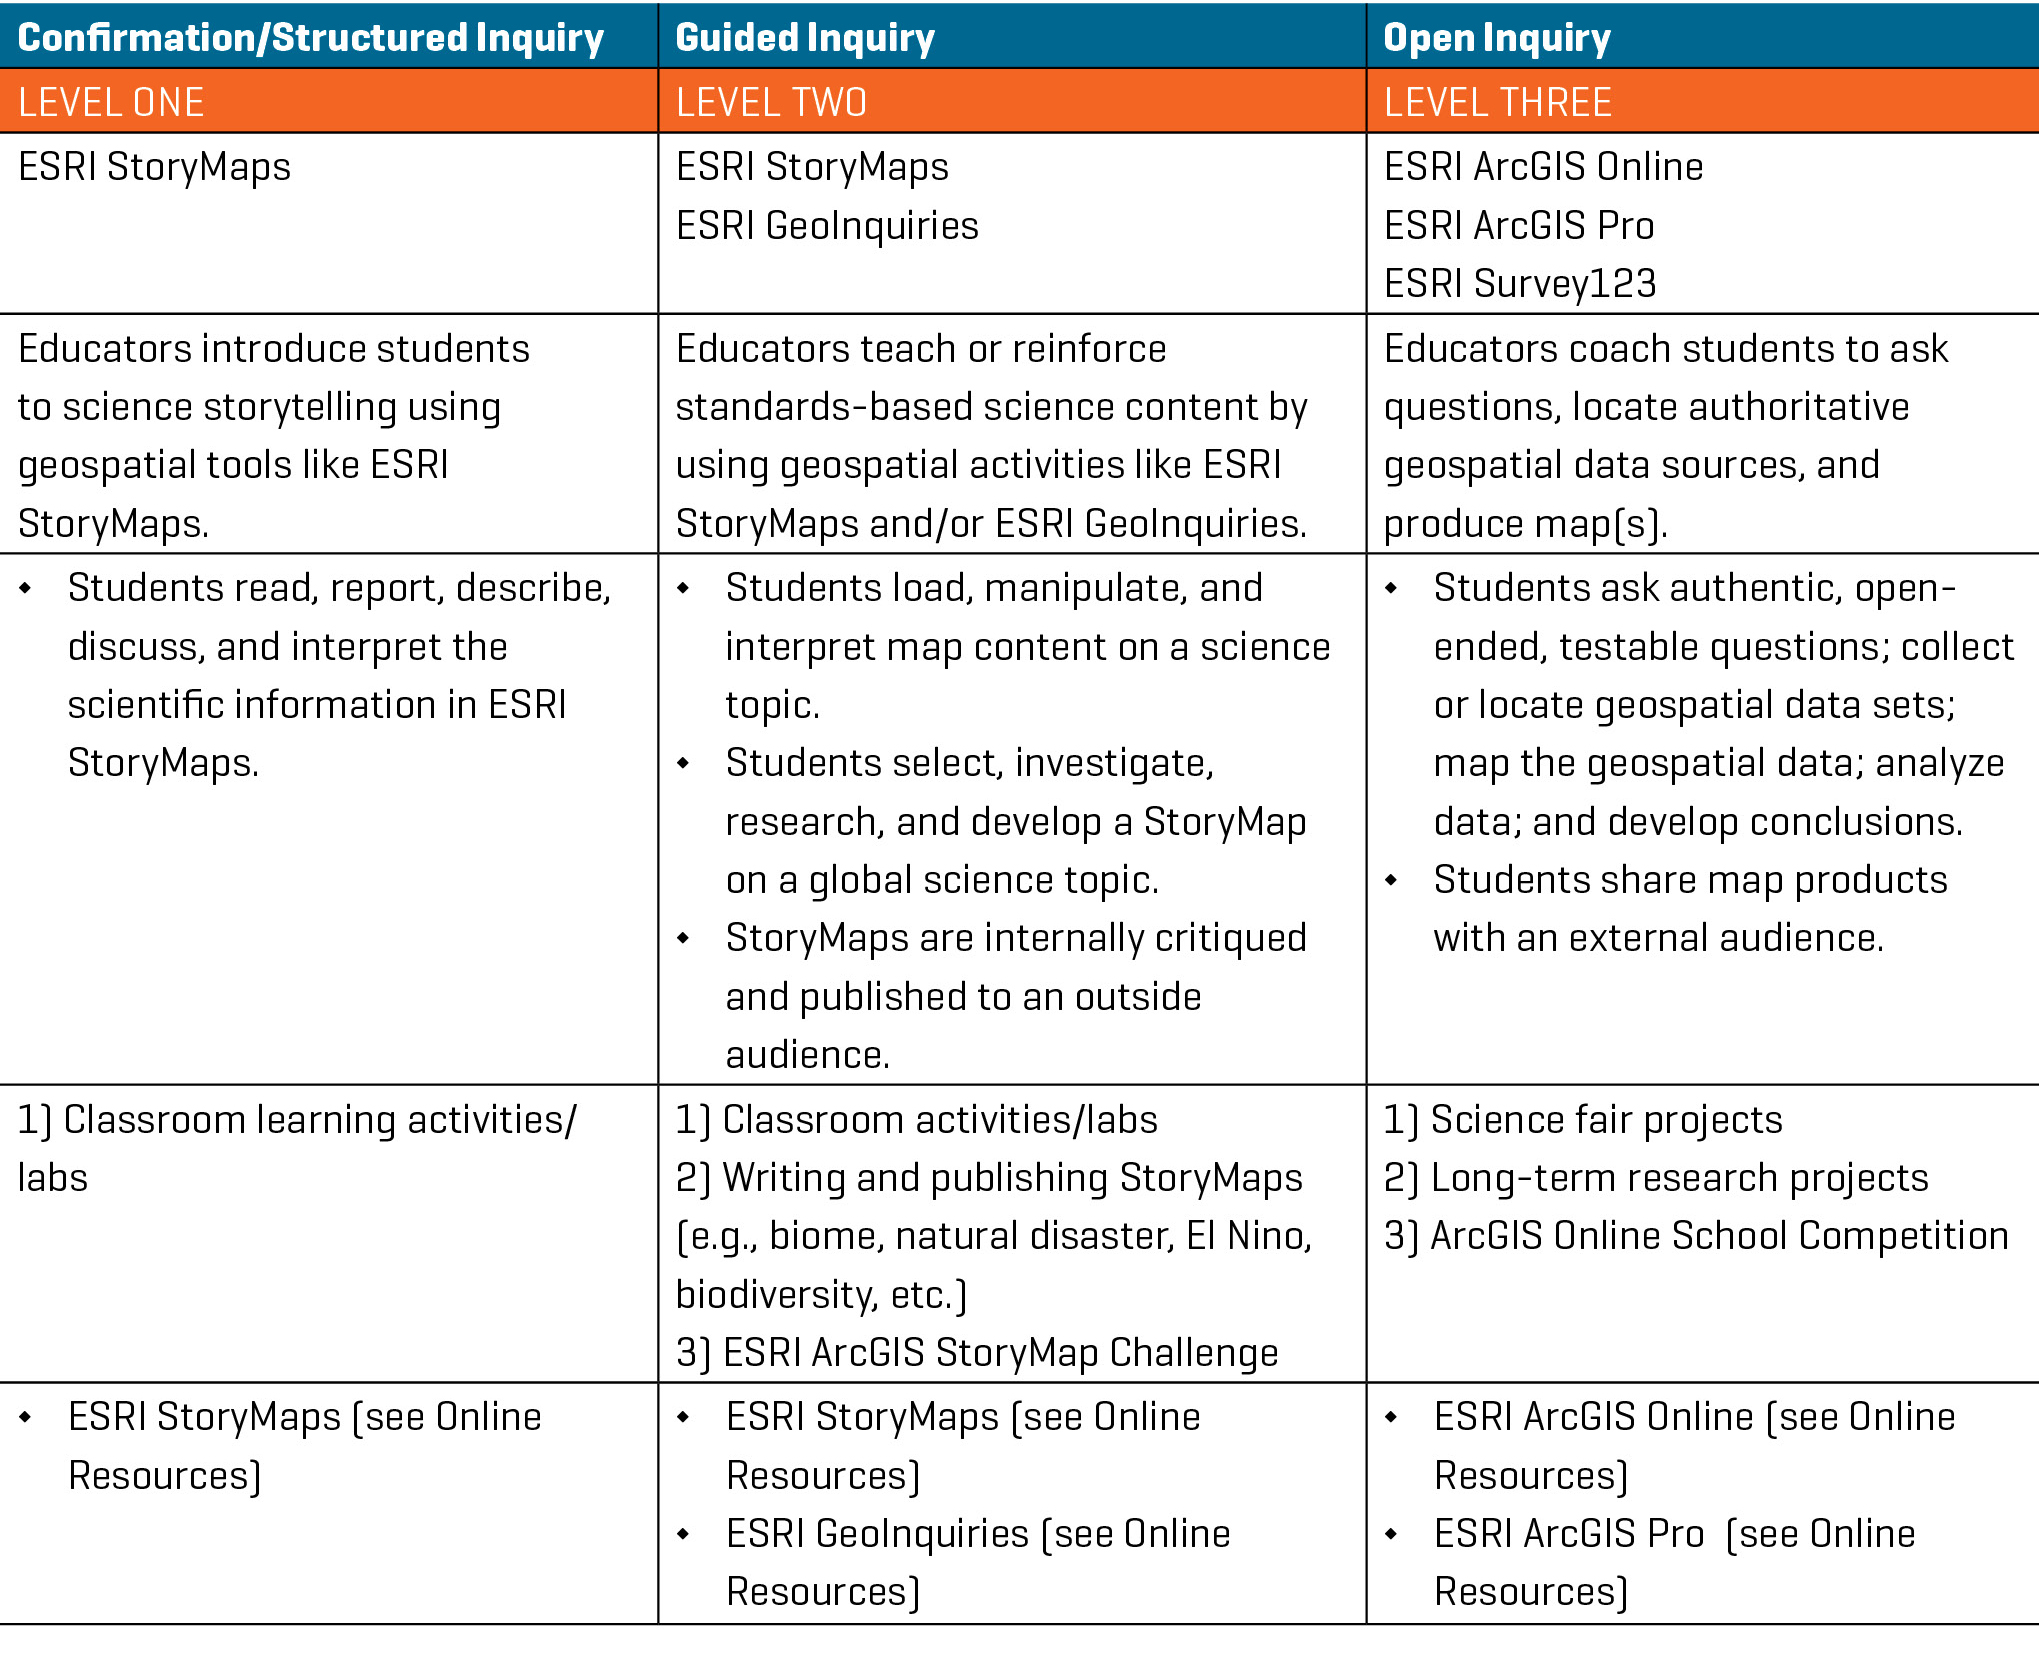
Three proposed implementation levels of geospatial technologies for middle school classrooms.
StoryMaps
The first geospatial tool is ESRI StoryMaps (see Online Resources), which is a platform where text, interactive maps, and other multimedia content may be combined to build compelling, digital narratives. Users with a free K–12 school ArcGIS Online account may create and publish StoryMaps within a classroom or organization, for all users, or via the Internet (see the Recommendations section). There are thousands of StoryMaps openly published for ArcGIS users that are easily viewable. By viewing, reading, and interacting with StoryMap content, students can learn about global science issues like biodiversity, climate change, sustainability, the oceans, tropical cyclones, volcanoes, and many other topics. Building StoryMaps is a relatively straightforward process of typing text, uploading pictures, importing maps from ArcGIS Online, and selecting fonts/color schemes. Constructing StoryMaps empowers educators and students to publish authentic, geospatial, project-based work for an authentic audience (Berger 2003; Larmer and Mergendoller 2010). StoryMaps possess elements of confirmation and structured inquiry through the acquisition of knowledge and identifying, locating, and interpreting scientific information via digital storytelling (see Figure 1; Banchi and Bell 2008). Constructing StoryMaps may also involve higher levels of scientific inquiry like guided and/or open inquiry (Figure 1; Kerski 2020).
GeoInquiries
The second tool is ESRI GeoInquiries (see Online Resources), which are relatively short, interactive, standards-aligned lessons where students click on a web link to view and manipulate an ArcGIS Online map. Bundles of GeoInquiries are categorized on the basis of topics like Earth science, environmental science, human geography, mathematics, and world geography for students in grades 4–12. The interactive maps can be displayed on the front board or students may access them on individual devices. With free school access to ArcGIS Online, more advanced GeoInquiries parts require adding layers of data to the maps. Data layers can be effortlessly manipulated and symbolized using easy-to-use features.
ArcGIS Online
The third (free) geospatial tool is the ArcGIS Online platform (see Online Resources). ArcGIS Online is cloud-based software built by ESRI used to create and share interactive web maps. The platform houses a gallery where organizational maps may be viewed; a group area where individuals may collaboratively work/share common map projects; a map viewer called “MyMap,” which is a workspace where maps are built; a content depository where web maps, shapefiles, dashboards, templates, and other files are stored and retrieved; and many other features like the ArcGIS Living Atlas of the World—a growing collection of high-quality, ready-to-use geographic content vetted and published by ESRI. There is not enough space in this manuscript or even in a short course to fairly describe the full functionality of the ArcGIS Online platform. For most middle grade teachers of science, the manner in which ArcGIS Online platform may be implemented in curriculum and instruction will likely be an outgrowth of positive instructional experiences with using GeoInquiries in the classroom. GeoInquiries introduce the essential mapping features of ArcGIS Online including base maps, viewing multiple map layers, adding layers like transparency, editing features, taking measurements, and so forth. There are many opportunities for advanced and gifted learners to undertake open scientific inquiry for science fair projects or mapping competitions via ArcGIS Online (see Figure 1).
Example Map #1
Figure 2 shows an ESRI StoryMap written and published by two Minnesota middle school students Bobby and Jimmy [pseudonyms]. A few states host ESRI ArcGIS mapping competitions. The students researched the “causes and effects of air pollution in Minnesota,” and they published a StoryMap with embedded ArcGIS maps (see Online Resources). Bobby and Jimmy challenged the mainstream thinking that Minnesota has good air quality by producing a thematic map (a map that uses colors or symbols to show feature attributes) displaying the density of daily car usage within a five-mile radius (Law and Collins 2018; see Figure 2). Although there are other environmental factors that influence air quality—including atmospheric and weather conditions—car usage was an excellent, anthropogenic variable for Bobby and Jimmy to investigate.
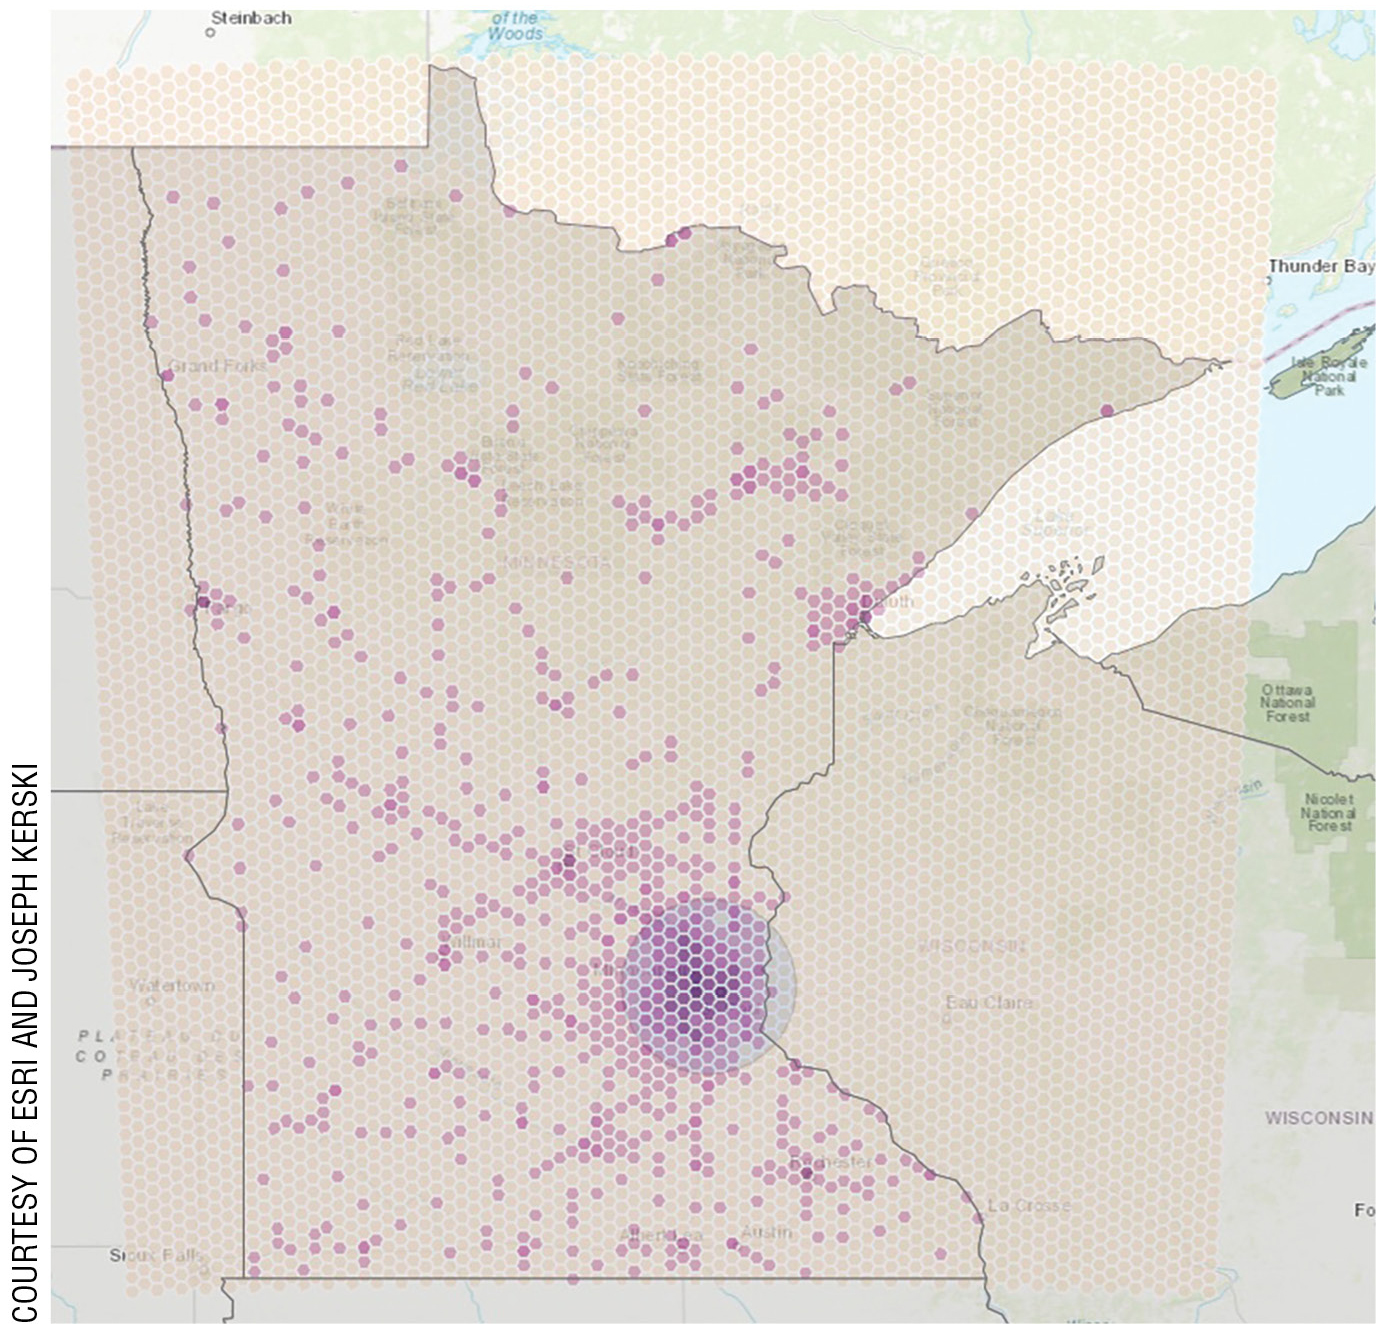
ESRI StoryMap generated by two middle school students showing how many cars are driven each day, with purple-colored hexagons representing a greater number of cars traveling per day within a five-mile radius.
Bobby and Jimmy’s work is aligned with the three-dimensions in the NGSS including the content standard for interactions between Earth and human activity (NGSS Lead States 2013; 4-ESS3-1 and 4-ESS3-2). Human activity greatly influences the air quality index, whether it is in the form of car exhaust emissions, coal-burning power plants, airplanes, aerosols, or even the urban heat–island effect. This research project could be expanded to include analyzing and mapping the state- and county-level policies that influence the usage of cars, including but not limited to ride sharing, public transit/transportation, urban redevelopment, suburbanization, exurbanization, regional planning initiatives, and recreation. It’s important to remember that GIS mapping projects through the lens of Geo-STEM have great potential to connect what seems like solely scientific issues with key human geographic, socioscientific elements.
Example Map #2
One of the greatest challenges students will face is locating, inputting, and analyzing the data; however, ArcGIS Online has a wide variety of data sources which can be used free of charge. For example, the map of bioregions and bio-subregions in Queensland, Australia (see Figure 3) was produced by the author using Exercises 10a through 10d in Getting to Know ArcGIS Desktop (Law and Collins 2018). A testable question could be: “How will climate change affect the biomes and environment in Australia?” A starting point for this investigation could be mapping the bioregions and bio-subregions in Australia or a state like Queensland. Additional mapping activities could potentially investigate how climate models project short- and long-term climate to change in Queensland. Furthermore, where do people live in Queensland and how will they be impacted by anticipated climate change predicted by models? It is also worth asking whether different types of people will be impacted in the same way. Will people in poverty or communities of color experience greater effects due to where they live, how they work, and the industries that employ them? How is land managed and used in climate-sensitive regions of Queensland? Will land management or changes in long-term conditions cause extinctions for vulnerable or critically endangered species in Queensland? If so, what are the species, and what biomes are they located within? The number and depth of testable questions is almost limitless.
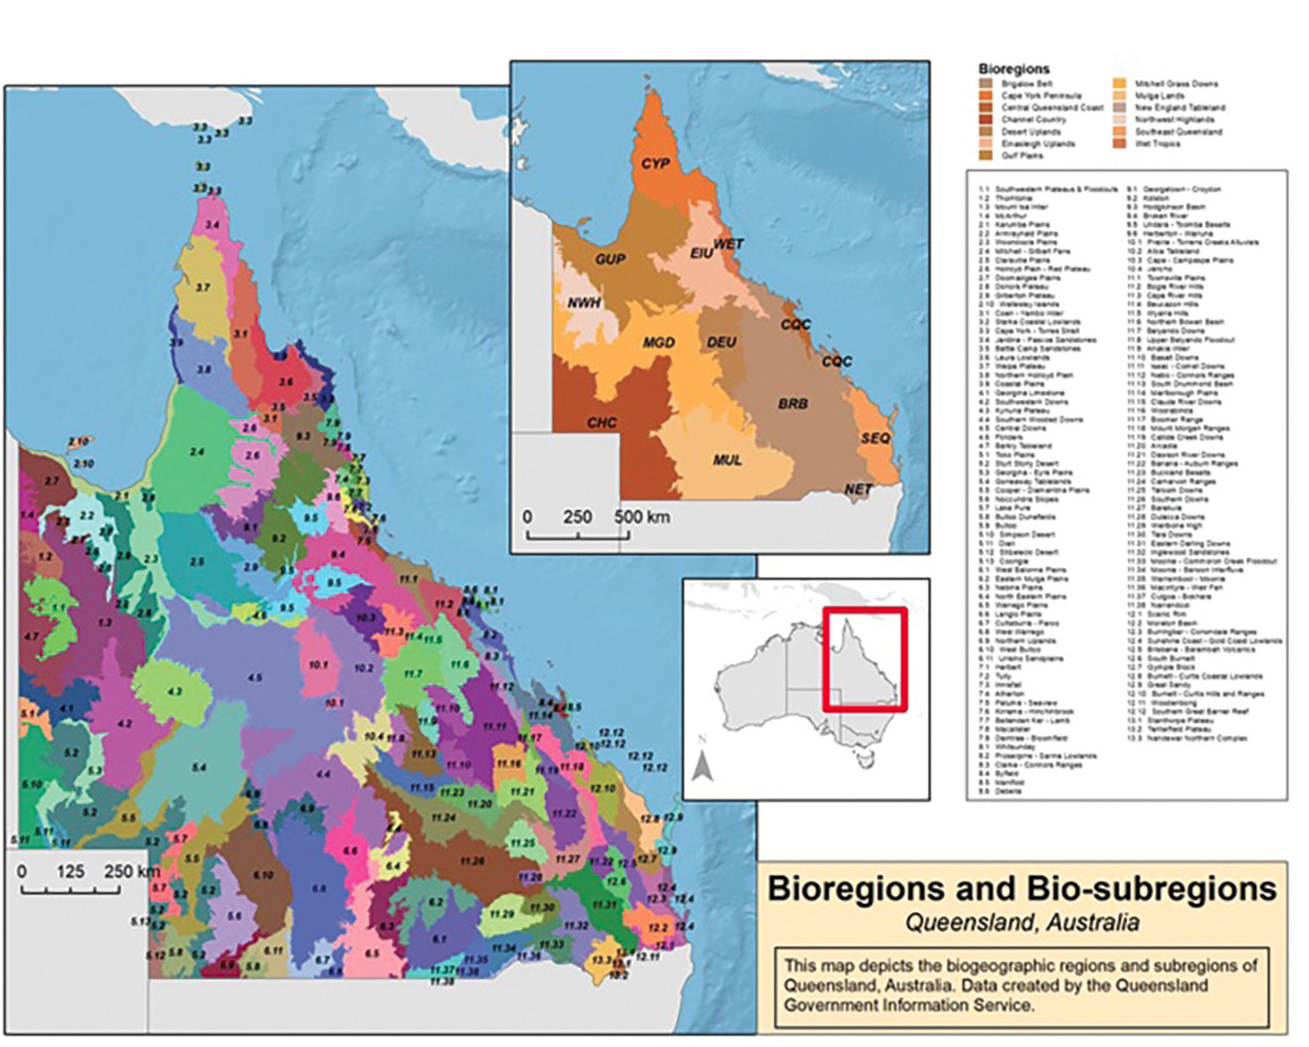
Map of bioregions and bio-subregions in Queensland, Australia (produced with ArcGIS Desktop; Law and Collins 2018).
Recommendations
First, I suggest that middle school educators obtain a free ESRI ArcGIS Online K–12 school account by submitting an online “Schools Mapping Software Bundle” request (see Online Resources). Your middle school may already have an account so you should check whether one exists by visiting “ESRI Software & Support for K12 Schools & Clubs” (see Online Resources). It is prudent to seek building and/or district administrative permission to generate a new organizational account. Larger districts may prefer to designate a central ArcGIS Online administrator who serves this role for multiple buildings. The online account has two different license classes: one for less than 2,000 users, and one for more than 2,000 users. Once an ArcGIS Online administrator is identified, teacher and student accounts may be easily added along with internal groups. Classes and career-technical programs (e.g., Project Lead the Way) could receive special group access.
Next, I recommend teachers start exploring preexisting ESRI StoryMaps and GeoInquiries to determine what best fits within the state and national standards. Using GeoInquiries helps teachers and students to learn basic mapping and move onto more advanced geospatial learning. The format of the GeoInquiries is easy to follow. GeoInquiries start by identifying applicable national science standards followed by an outline of learning outcomes. Other components of the GeoInquiries include tech-tips, activity extensions, textbook alignment information, and feedback links. GeoInquiries are the foundation for learning more about geospatial technologies and how they can be used in the middle school science classroom.
I also suggest middle school educators start small and collaborate with other teachers. Starting small may involve piloting just one StoryMap and/or one GeoInquiries lesson the first school year. I suggest teachers talk to others about how to use digital maps in the science classroom. Working with multiple teachers may help generate ideas about how to further incorporate maps into the science curriculum.
Finally, there are numerous opportunities for middle grades science teachers to learn more about geospatial technologies, GIS, and mapping. For instance, an increasing number of colleges and universities are now offering free online classes. Two providers, Coursera (see Online Resources) and edX (see Online Resources), currently offer dozens of free geospatial classes. ESRI also offers free online courses, which are available by logging into the training portal in ArcGIS Online. Additional information and resources can be obtained through ESRI digital and hardcopy publications provided by the ESRI Press (see Online Resources). K–12 teachers are entitled to receive free desk copies of selected books.
Conclusions
This manuscript aims to provide middle grades science teachers with an introduction to free GIS mapping technologies. StoryMaps, GeoInquiries, and ArcGIS Online are well aligned with the NGSS, fit within the Geo STEM paradigm, and lend themselves well to the 5E instructional model as well as scientific inquiry. With modest time commitment, initial collaboration, and a little practice, many middle grades science teachers will likely find the resources presented in this article both useful and engaging. •
Acknowledgments
The author thanks Huber Heights City Schools for supporting individual geospatial and GIS professional development. The author also thanks external reviewer Andrew (Andy) Aidt, the municipal GIS manager in the City of Kettering, Ohio, and Joseph Kerski, PhD, at ESRI, for his valuable input regarding the modifications made to this manuscript, including the idea to highlight an example of middle school mapping project.
Online Resources
“A Synthesis of Geospatial Tools for the Middle Grades” video by author—https://www.youtube.com/watch?v=Van8hgitWGA
ArcGIS maps—https://tinyurl.com/yv7p3p92
Coursera—https://www.coursera.org/
ESRI ArcGIS Online—https://tinyurl.com/ep95f39k
ESRI ArcGIS Pro—https://tinyurl.com/8bzm4c9m
ESRI GeoInquiries—https://tinyurl.com/ukw8936d
ESRI Press—https://tinyurl.com/2nhtavw9
ESRI Software & Support for K12 Schools & Clubs”—https://tinyurl.com/ba43mjre
ESRI StoryMaps—https://tinyurl.com/n2h6t4z2
Schools Mapping Software Bundle—https://tinyurl.com/2kdz9m8y
Supplemental Materials
Web resources for ESRI StoryMaps, GeoInquiries, and ArcGIS Online—https://bit.ly/3vAu3Us
How to access GIS textbooks, GIS lesson plans, GIS resources—https://bit.ly/3oRKLeA
Kurtz Miller, PhD (kurtz.miller@myhhcs.org] is a science teacher at Huber Heights City Schools in Huber Heights, Ohio.
Earth & Space Science Instructional Materials STEM Technology