
Feature
Is This Watershed Contaminated With PCBs?
A simple, inexpensive, simulated experiment for pollution monitoring
The Science Teacher—April/May 2020 (Volume 87, Issue 8)
By JACOB WHITE, JOHN A. MEANS, TIM HALL, AND DENISE SHOCKLEY
Polychlorinated biphenyls (PCBs) are a family of synthetic chemicals consisting of carbon, hydrogen, and chlorine atoms. The exact number of chlorine atoms and their specific location(s) within a PCB molecule determines many of the varied physical and chemical properties associated with this family of chemicals.
PCBs have been produced commercially since 1929 in hundreds of industrial applications. Because of their ability to withstand exceptionally high temperatures, PCBs were widely used in manufacturing electrical transmission equipment, including transformers, capacitors, voltage regulators, and switches (Faroon and Ruiz 2016). Their continued production in the United States was phased out in the late 1970s, and strict disposal guidelines were regulated as adverse health effects associated with exposure to PCBs was discovered (Faroon and Ruiz 2016).
Prior to that time, PCBs were often openly dumped into the environment. For example, it is estimated that over 1,000,000 pounds of PCBs were discharged into the Hudson River from two General Electric capacitor manufacturing plants located in New York during the 30-year period prior to the banned production of PCBs (see “On the Web” for more information regarding Hudson River contamination). PCBs have also been released into the environment when waste containing PCBs is stored in landfills or incinerated (Faroon and Ruiz 2016).
These chemicals are highly toxic to both humans and wildlife when either consumed or absorbed, causing the potential for liver damage from short-term exposure (Price et al. 1988) and for causing cancer from long-term exposure (Mayes et al. 1998).
PCBs are highly resistant to acids, bases, sunlight, and even heat, making them very stable and persistent in the environment (Kimbrough and Jensen 2012). Most PCBs have half-lives of up to several years. That is, for any given spill, half of the initial amount that leaked into the environment would remain unchanged even after several years had passed. It has been estimated that nearly 2 million tons of PCBs have been produced since 1929, with approximately 10% likely remaining in the environment today (Faroon and Samuel 2003).
PCB contamination is still prevalent in many areas of the country, including the Ohio River basin (see “On the Web” for more information on PCB contamination within the Ohio River). The Environmental Protection Agency (EPA) regularly monitors for the presence of PCBs in the environment (see “On the Web” for EPA information on PCBs).
Once PCBs enter a watershed, they deposit and mix with the sediments on the bottom of the water body and at some locations along the shoreline in the floodplain. The primary health risk to humans associated with some PCB-contaminated sites, such as the Hudson River, is through eating contaminated fish. As such, a common method for monitoring an environment for PCB contamination is to analyze fish. Fish are often collected and monitored for various environmental contaminants, including PCBs, because fish can serve as biomonitors—species collected and analyzed as representatives of the overall contamination of an environment (Markert et al. 2003). If fish are contaminated, it likely represents the presence of contamination throughout a broader body of water or ecosystem.
Fish are also monitored for contamination to determine the safety associated with their consumption. Like many other contaminants, PCBs are known to biomagnify up the food chain (Faber 1981). As an example, ducks have been found to accumulate PCBs from eating contaminated fish, causing harm to human health or even death when contaminated ducks are eaten (Faber 1981). If fish show contamination, then public safety announcements called “consumption advisories” will be issued as warnings against their consumption. As such, the monitoring of fish is typically limited to only muscle tissue as it is the most commonly consumed portion of the fish.
This article shares an experiment intended to mimic the monitoring of fish samples collected from a watershed suspected to contain a source of PCB contamination. Students use a fictional map of a watershed along with small samples of fish fillets to screen for the presence of contamination. The map includes collection sites within the watershed for each sample, as well as the location of a suspected point source of contamination—a newly discovered waste dump containing old electrical transmission components. The teacher pretreats some samples with a common base (sodium hydroxide) to mimic the presence of contamination. Students use an acid-base indicator solution (phenolphthalein), which changes color in the presence of a base, to mimic the screening for PCBs. At the end of the experiment, the entire class pools their results to draw conclusions. This lesson uses active, collaborative, inquiry-based learning techniques that help students become more engaged learners (Barrow 2006).
Materials
- Standard personal protective equipment—safety glasses with splash protection and safety gloves (for teacher when preparing lesson materials and for each student throughout the lesson)
- Small dropper bottles—one per group
- Frozen fish fillets (any species) from local grocer, without breading or seasoning—one fillet can generally be cut into 10–12 smaller pieces. A single pack of 4 or 5 fillets is generally enough samples necessary for the 48- sample set described in the provided procedure
- Cutting board
- Knife
- Permanent marker
- Small (snack size) resealable plastic food storage bags (enough for 48 fish samples)
- Sodium hydroxide 1.0 M aqueous solution—CAUTION! Sodium hydroxide is caustic and can cause severe eye and skin burns. Wear personal protective equipment when using this solution, avoid contact, and handle with care. Students will not be working with this solution. (see On the Web for safety data sheet)
- Phenolphthalein 0.5% aqueous solution—CAUTION! Phenolphthalein is flammable and can cause eye and skin irritation. Students will be working with small amounts of this solution. (see On the Web for safety data sheet)
Lesson plan
Creating a site map
Construct a watershed map that is numerically labeled with collection sites representing where fish samples were collected. You can also choose to have the map indicate a suspected point source of contamination, yet this can be omitted depending on the learning objective. Figure 1 is a sample map created for this lesson with a total of 24 collection sites. The star symbol represents the location of a dump site suspected to be leaking contamination into the watershed.
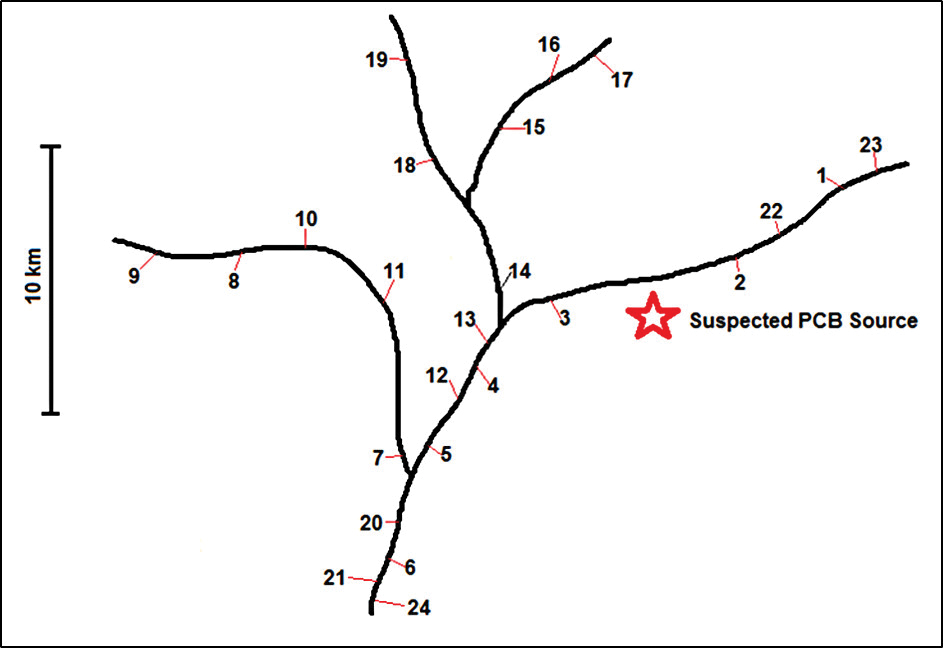
Sample watershed map with collection sites (numbered) and location of suspected point source of contamination (star).
Notice that there are collection sites both upstream and downstream of the location of the dump site. Upstream sites are defined as locations collected in the opposite direction from that in which the water is naturally flowing. Downstream sites are defined as locations collected in the same direction from that in which the water is naturally flowing. It is reasonable to hypothesize that samples collected downstream from a point source of contamination will generally test positive for the contaminant whereas samples collected upstream from a point source of contamination will generally test negative for the contaminant. The map and teacher answer key can be created by the instructor to target a specific grade level or learning objective, and can be modified to yield simple or complex conclusions.
Preparing for the lab activity
Obtain frozen fish fillets (without seasoning or breading) from a local grocer and cut them into small pieces. The size of each sample is not critical, and the samples can be cut into pieces as small as needed for cost-effectiveness. Place each sample into its own bag, and use a permanent marker to label each with the collection site number it is supposed to represent. Although the actual fish samples are likely one species (tilapia, for example), the lesson can simulate a sample set that includes more than one species. To create this type of sample set, label each bag with its collection site number and species name.
For samples that are intended to demonstrate contamination (see Figure 3), add 2–3 drops of 1.0 M sodium hydroxide solution and seal their bags. For samples that are intended to demonstrate no contamination, simply seal their bags—no pretreatment is necessary. Samples should be refrigerated or frozen until the time of the lesson. Note—0.5 M sodium hydroxide may be substituted if samples will be used soon after preparation. For samples stored more than several hours prior to use, a more concentrated solution of sodium hydroxide may be needed.
Divide the phenolphthalein solution into small dropper bottles and refer to the solution as a “PCB test solution.” We recommend labeling each dropper bottle as a “PCB Test Solution.” Note—make certain any remaining solution at the end of the lesson is correctly labeled as phenolphthalein prior to long-term storage. Phenolphthalein turns a bright pink color when in contact with a base (such as when in contact with the sodium hydroxide that was added to some of the fish samples), yet it is colorless in a neutral or acidic environment (such as when in contact with the untreated fish samples).
Although teachers can create their own maps and sample sets, we offer here a fully developed lesson plan with a sample set designed to provide fairly complex conclusions that will allow for rich classroom discussions and possible extension activities. Figure 2 is a sample data table (provided to students as a handout) and Figure 3 is a sample teacher answer key for this particular sample set. This provided lesson plan has been designed to include a total of 48 samples, with two different species collected at each of the 24 collection sites, with a total of four different species in the sample set—bass, catfish, carp, and sunfish. Only some of the samples will be pretreated to mimic the presence of PCB contamination. This lesson plan is designed to demonstrate three important conclusions: First, the dump site is likely contaminating the watershed as evidenced by most downstream samples being contaminated and most upstream samples being not contaminated. Second, the results show that two species (bass and catfish) are affected by the contamination as evidenced by most downstream samples being contaminated and most upstream samples being not contaminated, and that one species (carp) is resistant to the contamination as evidenced by all downstream and upstream samples being not contaminated. Third, the sample set is insufficient to conclude if sunfish are affected by or resistant to the contamination because the sample set includes only upstream samples. Each of these conclusions will allow for rich classroom discussions. However, teachers can develop their own maps and sample sets to generate conclusions of nearly any complexity.
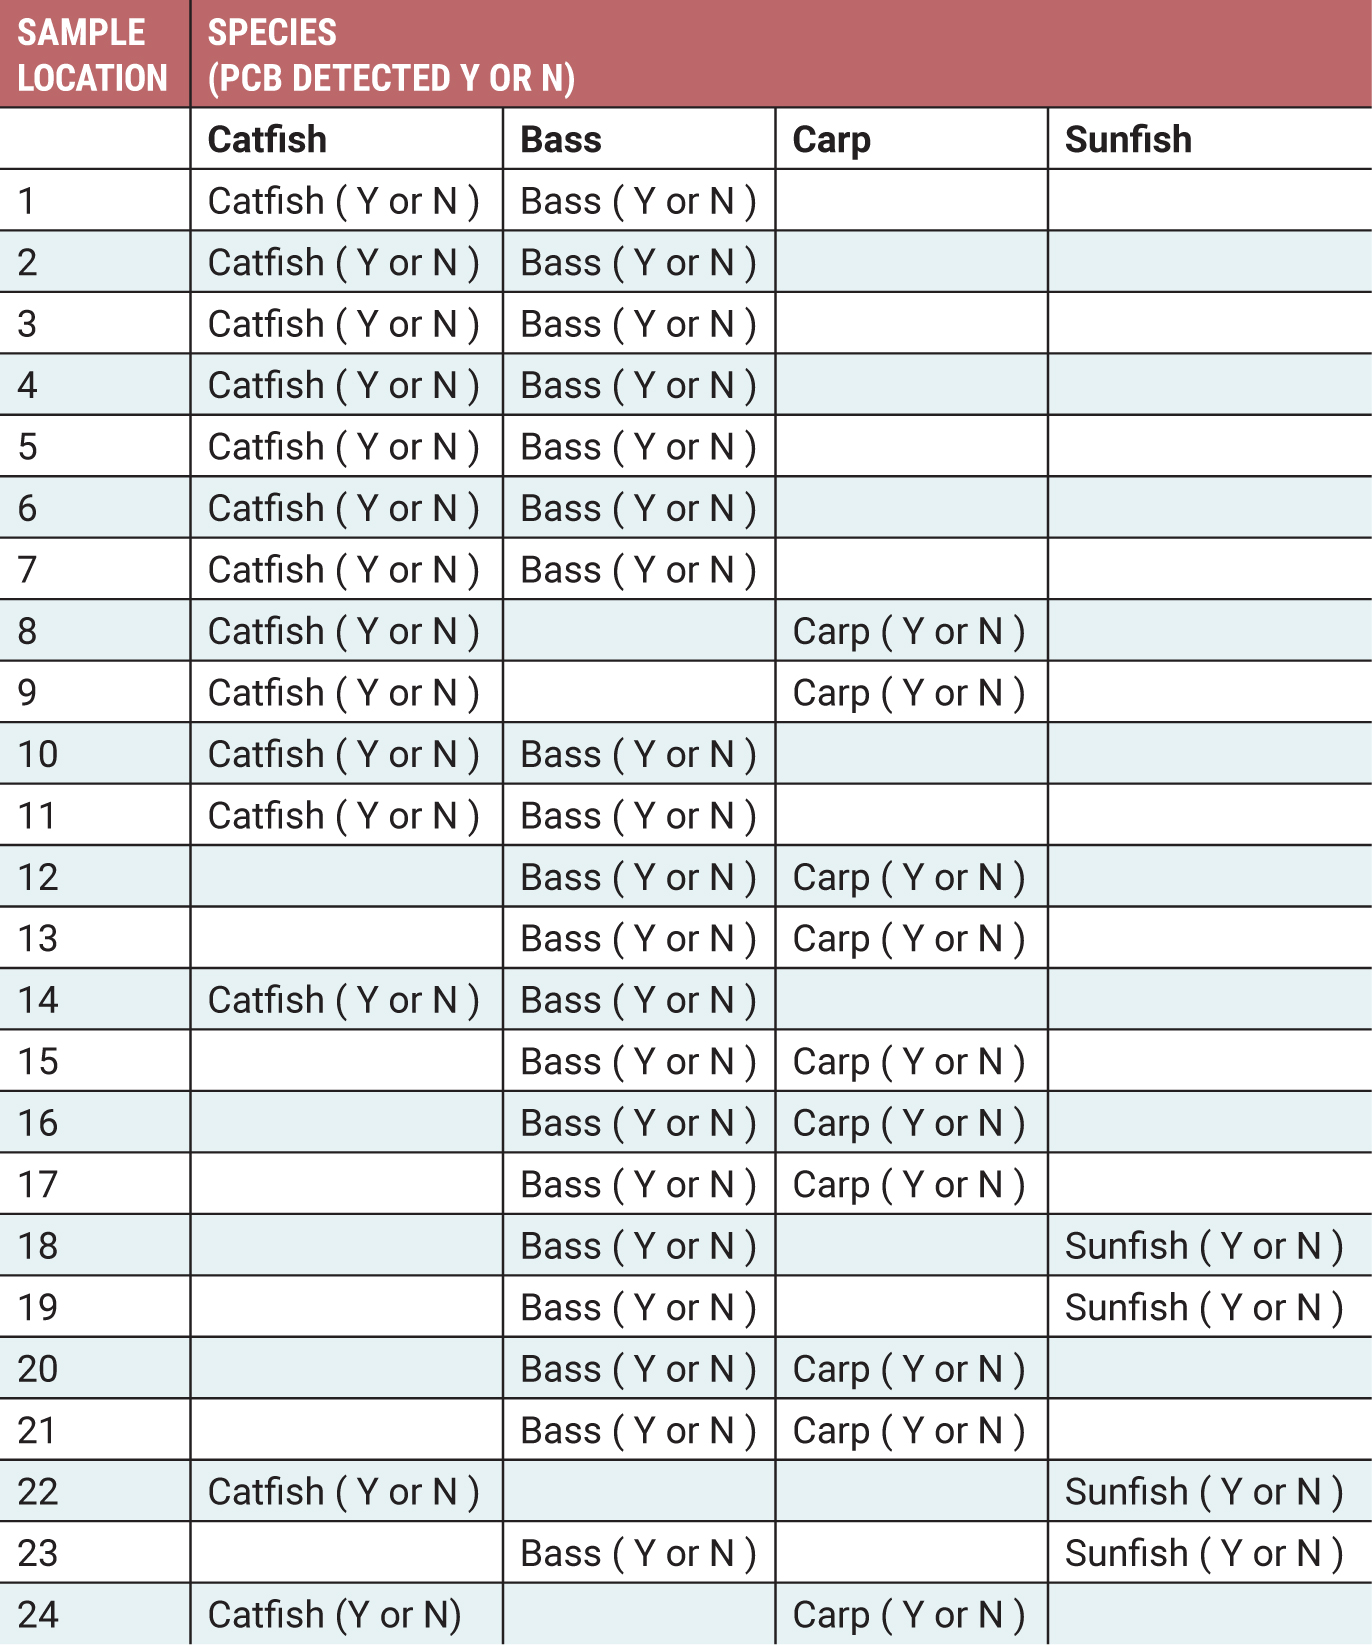
Sample data table for students.
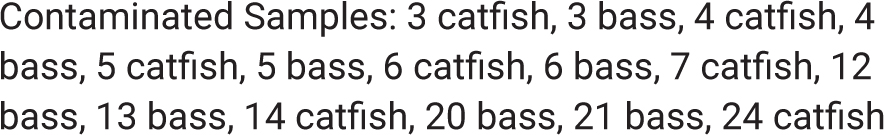
Sample teacher key for intended results.
Testing the samples
Individually or in groups, students begin testing the fish samples. While wearing their goggles and gloves, students open the first bag and add 1–2 drops of phenolphthalein to the surface of the fish sample. If the sample turns color, students conclude that contamination was present, which will be observed for all samples pretreated with sodium hydroxide. If students observe no color change, they conclude that contamination was not present, which will be observed for all untreated samples. Using the data table (see Figure 2), students record whether PCB was detected for the labeled sample. Students continue this process for all fish samples.
When testing is finished, students reseal all sample bags, and the teacher collects the bags for disposal. Only one sample set is used for an entire class. If each student or group of students tests only a portion of the sample set, students must pool their results with the entire class to generalize conclusions regarding the entire sample set. One way to accomplish this is for the teacher to verbally call out each sample one by one after all samples have been tested. Each student who tested the given sample then shares the result for this sample as a “positive” or “negative” result. This approach typically requires less than five minutes to pool the class results and allows the teacher to reference the expected answer key while pooling the actual results. Alternatively, the teacher could display a blank data table on a smartboard/whiteboard for students to update with their results in real-time as they finish testing each sample.
Discussion and assessment
Figure 4 (see Discussion Questions “On the Web”) is a sample student worksheet that has been used to guide student discussions and conclusions, and can be used for assessment purposes. Students must critically analyze the results of the entire data set to draw conclusions. For the provided version of this lesson, three main questions help guide students’ conclusions:
- Do the results suggest the dump site is a source of PCB contamination in the watershed?
- Do the results suggest that all four species are contaminated with PCBs?
- Based on the results, what actions would you recommend?
These guiding questions can allow for formative assessment in multiple forms. Class discussion can allow students to compare ideas with peers and modify their conclusions accordingly. Science knowledge is constructed when individuals engage socially in talk and activity about shared problems and tasks, and thus the social and discursive nature of science learning is critical (Driver et al. 1994).
Students could also visually summarize the results via diagrams or graphs, such as labeling or superimposing the results on the watershed map to better show the downstream vs. upstream dichotomy. This approach would be consistent with the NGSS practice of obtaining, evaluating, and communicating information in the forms of writing, orally, or via diagrams or graphs, and by engaging in extended discussion with their peers (NGSS Lead States 2013).
Insights gained from implementing sample lesson
Modified versions of this lesson have been implemented in various settings, including a general education course at the college level designed for non-science majors, a high school chemistry course, a high school environmental science course, and with middle school science students.
At the beginning of the lesson, students are provided with background information regarding PCBs via discussion, handouts, or internet research. If desired, this discussion can lend itself to demonstrating the basic concept of chemical nomenclature—that a chemical name includes information about the composition and arrangement of its atoms. If shown the molecular structure of a “phenyl” group of atoms, students can typically deduce that the term “biphenyl” means two phenyl groups, that the term “chlorinated biphenyl” means two phenyl groups with chlorine attached, and the term “polychlorinated biphenyl” means two phenyl groups with multiple chlorine atoms attached. This may or may not be an appropriate dimension to the lesson, depending on the course and intended learning objectives, yet fits well with this version of the lesson.
After background discussion regarding PCBs, students receive the watershed map and location of the suspected source of contamination and then formulate a hypothesis regarding contamination testing. Most students assert that if the dump site is contaminating the watershed, then the results would show that downstream samples are contaminated. Few students have ever initially commented on expected results for upstream samples, as if negative results are less important. This discussion can lend itself to emphasizing the importance of the NGSS crosscutting concept of cause and effect—in the presence of a cause, an effect must be observed, and in the absence of the cause, the effect must no longer be observed. This reasoning is why experimental design incorporates the use of controlled variables and why both sets of results—positive and negative—are critical in deriving conclusive determinations. Students rarely emphasize both sets of expectations and results, focusing solely on downstream positive test results.
For the provided lesson key, carp do not appear to show contamination, regardless of their collection site, suggesting a resistance to absorbing PCBs. The only sunfish available in the sample set were collected upstream and show no contamination. Most students fail to address the issue of the sunfish sample set being too small and exclusively upstream of the contamination site to allow for conclusive results. This, too, should be an important consideration regarding the NGSS practice of analyzing and interpreting data with respect to sample size.
Alternate and extension ideas
An alternate approach to the lesson design is for teachers to construct a watershed map that has several suspected contamination sites. Students could then either eliminate or confirm sources of contamination based on the results of their screening tests. With only one proposed site on the map, students may be tempted to focus on making their data “fit” that site.
Many opportunities for extension activities can be associated with this lesson. Upon completion of the activity, students could be assigned an oral presentation, written report, or formal lab report. Suggested components for students to address may include: What are PCBs? Why is it important to monitor certain environments for PCB contamination? At what level of concentration is it unsafe to consume fish that are contaminated with PCBs? Is PCB contamination prevalent in your region?
Advanced students or advanced classes could investigate where the fish spend the most time, such as closer proximity to the surface (like sunfish) or closer proximity to the bottom (like catfish), and where PCBs are more likely located in the stream. Organic compounds typically float on an aqueous surface, but halogenated hydrocarbons (like PCBs) can often be more dense than water. This can lend itself to a discussion on density and solubility trends, along with a biology-based discussion on other toxins absorbed by fish, such as mercury.
Conclusion
This article describes a simple, inexpensive, and safe lesson that simulates environmental monitoring for a common contaminant—polychlorinated biphenyls (PCBs). The lesson can be easily adapted to simulate the monitoring of nearly any pollutant, and can also be easily adapted to use in multiple courses at multiple grade levels, including high school chemistry, high school environmental science, or even a middle school science course.
The lesson is presented in the context of an advanced high school science course requiring more complex considerations of the resulting data, yet the lesson can be easily modified to generate resulting data of lesser complexity. The authors present one simulated case study and discuss opportunities for differentiated approaches and provide supplemental resources that can be adopted for immediate use or adapted for a multitude of learning goals. With creativity, nearly any science teacher at any grade level could adopt this approach to simulate a fictionalized case study.
Jacob White (jacob.white@ohio.edu) is a Senior Executive in Residence for Education and Evaluation at Ohio University, Athens, Ohio. John A. Means (jmeans@rio.edu) is a Professor of Chemistry and Tim Hall (thall@rio.edu) is an Assistant Professor at the University of Rio Grande, Ohio. Denise Shockley (dshockley@galliavintonesc.org) is Superintendent of the Gallia-Vinton Educational Service Center, Rio Grande, Ohio.
Environmental Science Labs Teaching Strategies High School