
Getting Messy with Data
Tools and strategies to help students analyze and interpret complex data sources
The Science Teacher—January 2020 (Volume 87, Issue 5)
By Joshua Rosenberg, Alex Edwards, and Bodong Chen

Analyzing and interpreting data may present challenges to teachers and students because the Next Generation Science Standards emphasizes data analysis–related capabilities that are not often studied in the classroom, such as developing quantitative models (Kastens 2015). Even making “simple” observations, such as the height of the school’s flagpole, requires knowing what, how, and how many times students should measure and record observations in light of variation in the data (Lehrer, Kim, and Schauble 2007). Due to the shift called for in the NGSS from knowing about scientific theories and ideas to figuring out how the world works (Schwarz, Passmore and Reiser 2017), students can now learn about data not only as interpreters of quantitative models, but also as creators of those models themselves (Lehrer, Kim, and Jones 2011).
In addition, analyzing and interpreting newer sources of data, such as the “big” data sets collected and created by scientists and engineers, presents additional opportunities and challenges for science educators (Finzer, Busey, and Kochevar 2018; Kastens, Krumhansl, and Baker 2015; Lee and Wilkerson 2018). Traditionally, as part of the data-modeling approach, students use the data they have collected themselves. In the context of larger sources of data, students often use data originally collected for some other purpose, such as data from the city in which they lived (Wilkerson and Laina 2018). Facing large data sources, students also need to deal with analytical challenges with large data sources, such as the importance of structuring hierarchical data (Konold, Finzer, and Kreetong 2017) and using technological tools (Finzer 2013).
It is also essential to consider how the educational tools align with particular pedagogical aims, content areas, and context (Mishra and Koehler 2006). Thus, we selected tools that we think exhibit some of the characteristics of effective data analysis platforms for learners (see McNamara 2015). Additionally, the tools for working with data we identify are those that are freely available (and do not require purchasing a license), browser-based (and so can easily be used across computer operating systems), and relatively easy to use, especially for students. This article also describes three strategies for analyzing and interpreting complex data using the Common Online Data Analysis Platform (CODAP).
Tools for working with data
Desmos
Mathematics and science teachers commonly use Desmos (see “On the web”) with, or in replacement of, graphing calculators. Like graphing calculators, Desmos works well with functions that do not require a data table, such as the use of the function f(x) = sin(x) to display the form of that function. It also works well with datasets. Data can be typed directly into Desmos or can be copied from Google Sheets or other spreadsheet software. Then, functions, such as a sin, linear, or quadratic function, can be estimated based on the data and added to a graph. Even those who are not accustomed to writing an equation can easily write complex functions.
Google Sheets is widely used by science teachers and students, especially in school districts using Google Suite. A benefit of Google Sheets is that it bears similarities to other, widely used tools, namely Microsoft Excel. This may make it easy for students to begin to use this tool. Unlike Excel, Google Sheets is browser-based, making it is easy for students to collaborate through a single Google Sheet. While many high school students may be familiar with Google Sheets, its advanced functionality, such as writing commands to populate cells with values that rely on other cells (i.e., to create the mean of multiple variables) or fitting functions to data, likely requires additional support. Finally, while easy to use, sometimes Google Sheets can make it so easy to create a figure that students may not have the opportunity to think carefully about what each part of the figure represents.
JASP and R
JASP is a statistical software program based on R, a programming language designed for data analysis (R Core Team 2019). JASP offers a point-and-click interface, through which it is possible to perform a wide array of statistical tests. JASP may be most useful for teachers who want students to conduct complicated analyses, such as t-tests for how two means (or averages) differ and for multiple regression analyses. In addition, R is most commonly used via R Studio software, which executes R and provides additional functionality for enhanced data-analysis workflows. While challenging to use, in some advanced applications—such as for analyzing phylogenetic data—it may be useful to turn to R. JASP has both a desktop version and a browser-based version. There is a browser-based version of R Studio available, known as R Studio Cloud.
The Common Online Data Analysis Platform (CODAP)
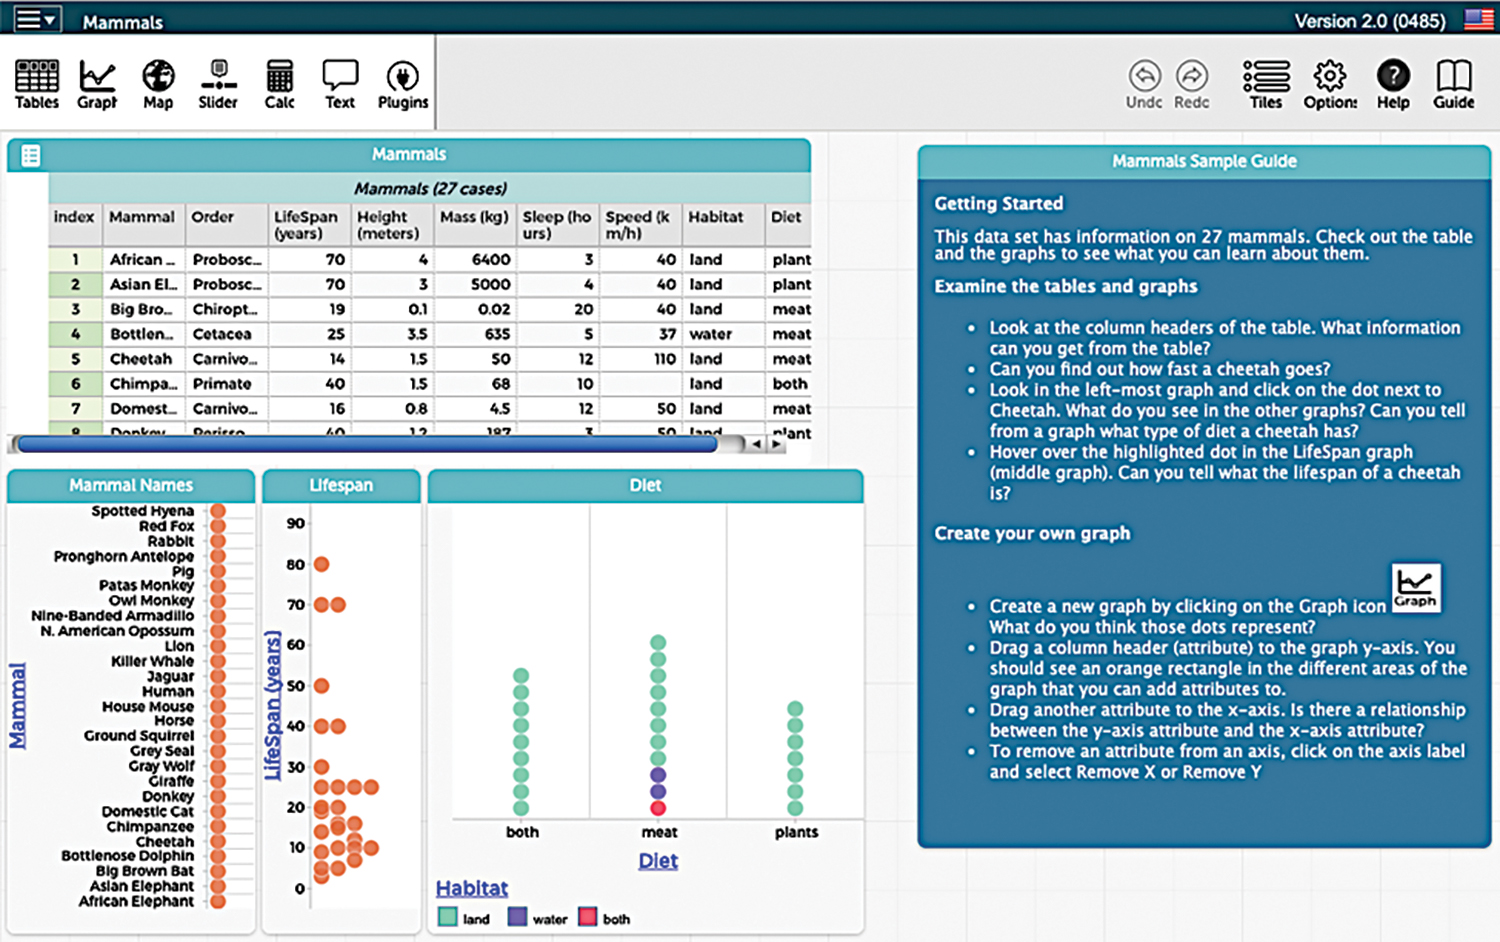
The Common Online Data Analysis Platform (CODAP) provides a distinctive interface to view, transform, and analyze data and create and interpret graphs. Developed by the Concord Consortium, CODAP (see “On the web”) draws upon past research and development of TinkerPlots and Fathom statistical software. One distinctive feature, related to how both data and graphs can be viewed together, is that elements of graphs, such as dots on a scatterplot, can be clicked on to view the data to which they correspond (Figure 1). Another distinctive feature of CODAP is its drag-and-drop interface. For example, to create a graph, columns from a data table can be dragged to the x- or y-axes or the grid of the graph, to color points based on the values in the column. It is also easy to load data (as long as you can save the data as a CSV file, which can be done in Google Sheets or other software). A CSV file can be dragged into the window to load the file as a table. In addition to being easy to use, CODAP has more advanced functionality, such as the ability to fit quantitative models (i.e., linear models or models for simple linear regression). Additional resources include tutorials, example data sets, and activities.
Screenshot of the freely available, browser-based CODAP software.
Strategies for analyzing and interpreting complex data sources within CODAP
We have been engaged in research about how tools such as those described above—and in particular CODAP, because of its distinctive features—can be used to support student learning in the context of the NGSS. We have identified several research-based strategies that align with past research, and that can be used as a part of longer investigations across a lesson sequence, over a unit, or as a part of a single lesson or class.
While we focus on how these strategies can be employed using CODAP, each could also be employed using other tools described in this article or other than those described here. Finally, while the strategies can be considered on their own, they may best be considered as a part of a cycle, where students first explore how the data were collected, then prepare a data set for analysis, and finally model the data in order to answer a driving question.
Strategy 1: Explore how the data were collected or created
Creating or collecting data is an essential step in the data analysis process (Hancock, Kaput, and Goldsmith 1992). This step can also serve as an introduction to working with data, particularly for students who are familiar with the practice. When students record observations themselves, they have the opportunity to consider how the data gets created and may be more confident when analyzing it later on. When students use already-collected data or secondary data, there are still benefits to considering how the data came to be. Thus, when students are analyzing already-collected data it is still important for students to have the chance to think about how the data were originally collected or created. These discussions may lead students to question how and why the data were collected and to consider sources of bias (deliberate or unintentional) that change the nature of the data, which can be seen as an example of critical data literacy (Hautea, Dasgupta, and Hill 2017).
To help students explore how the data were collected, start with data that represents a single case. Often, the data that students are analyzing are aggregates of individual cases of data, such as when a data set includes a column representing the mean of a measurement collected multiple times. In CODAP, this is supported by the connections between the data points and the figure (see Figure 2). Another way is to talk through, with students, what the data collection process was like, or what it could have been like, as facilitated through a discussion of a description of a study associated with the data, a codebook describing what the variables are, or a data collection instrument (or a description of one).
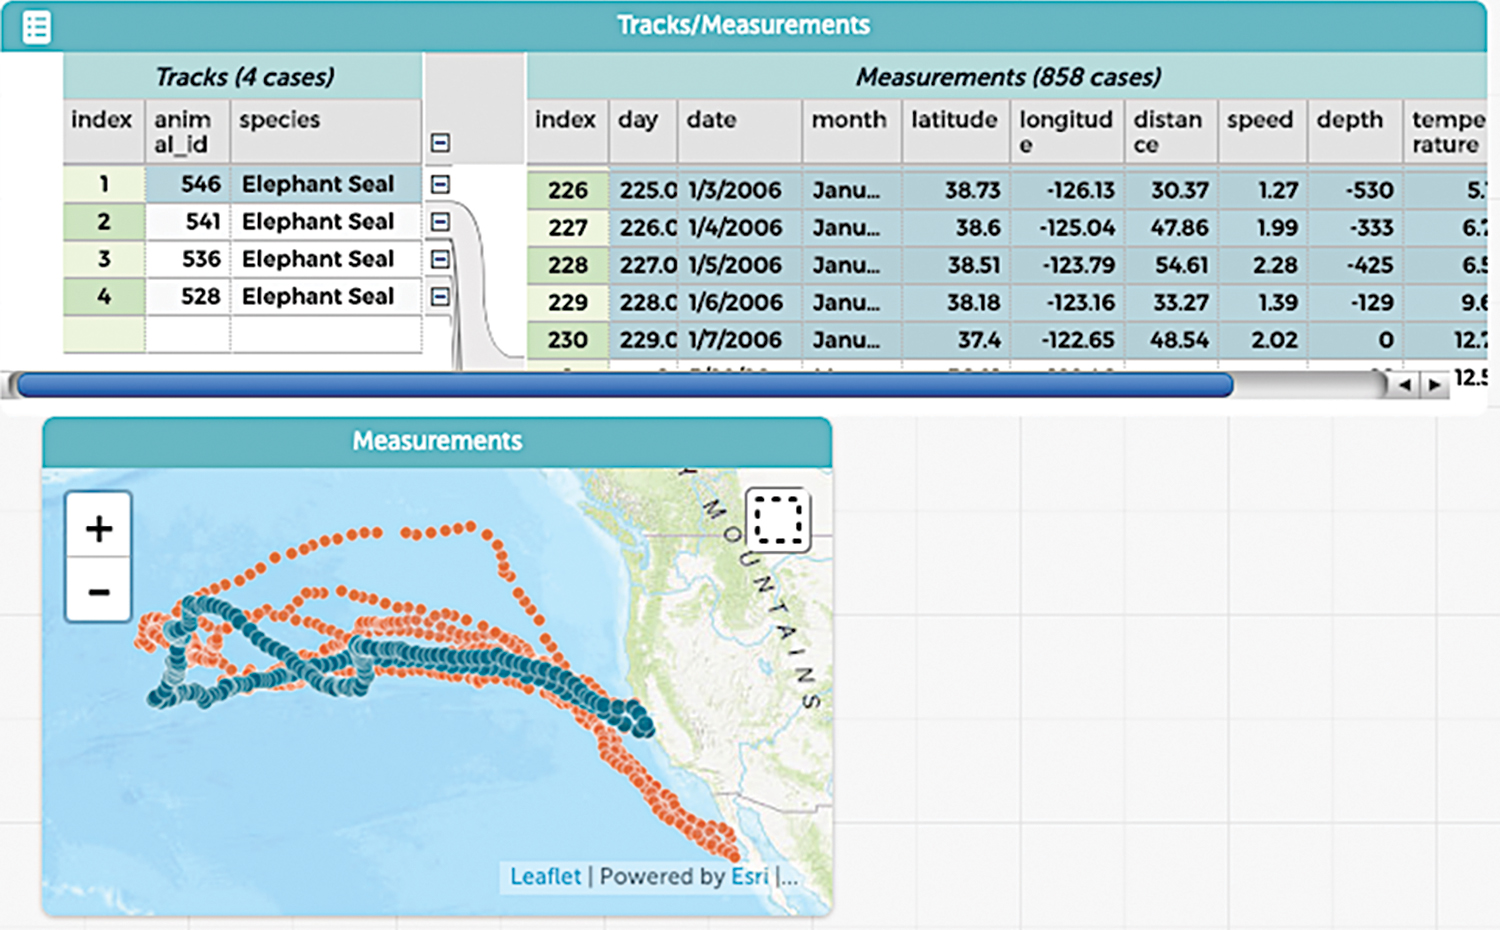
Working with clean, tidy data makes it easier for students to reach conclusions; however, particularly with complex sources of data, the need to think about and work through the messier parts of the process—such as renaming and selecting variables and joining together multiple data sets—can also be beneficial (Kjelvik and Schultheis 2019; Konold, Finzer, and Kreetong 2017; Schultheis and Kjelvik 2015). In CODAP, it is easy to include data sets that are hierarchically structured or to create nested data structures. In this way, students can see and explore connections between data at multiple levels. Figure 3 depicts how all of the observations associated with one elephant seal are grouped.
Analyzing hierarchical data in CODAP.
Another way to engage students in the messier parts of data analysis is even more simple: allow some time for students to explore the data and to generate their own ideas about the data. This can be an especially useful way to expose students to raw, messy data, akin to the kinds that scientists create and use, but which may also require greater time and effort than is required in typical data analyses (see Data Nuggets for structured activities that involve students in analyzing complex data from scientists).
Strategy 3: Model and explain variability in the data to answer a question and solve a problem
Finally, a central goal of statistical models—and statistics—is to understand what is going on in light of variation in the data (Aridor and Ben-Zvi 2019; Lehrer, Kim, and Schauble 2007). Importantly, explaining variability does not need to involve highly complex models: even a mean or a median can be an important summary. A key part of using this strategy is recognizing that it is not essential for students to learn about the mean or the median; it is important that students have the opportunity to use statistics that are useful for determining what is going on with something concrete: a phenomenon.
When using this strategy, it is important to push students to reach and to defend their conclusions in light of variability to answer an authentic question, such as a driving question that allows students the opportunity to answer the question in multiple ways, as well as share and revise their answers. In CODAP, modeling and explaining variability is easy to do by clicking on an already-created figure, as demonstrated in Figure 4. In addition to adding a model, such as the linear model depicted in Figure 4, students can also add statistics, such as the mean and median to a graph (and to groups depicted within a graph). Students can also represent how spread out a variable is through the inclusion of statistics, such as the standard deviation or the range and through adding graphical representations of these statistics to a graph.
Conclusion
Working with data is essential to the practice of scientists as well as to science teaching and learning. As you consider these tools and strategies, we encourage you to think creatively: data do not have to be about something separate from students’ investigations of the world. In many cases, data can come directly from students’ experiences in your classroom—or their lives. We encourage you to not only seek out complex data sources that help your students demonstrate a performance expectation, or standard, but to seek out sources that provide chances for students to investigate, critique, and share what they find about topics that are of interest, personal investment, or relevance to them. Doing so can support a shift away from students learning about the world toward figuring out how and why the world works in the ways it does.
On the Web
CODAP: https://codap.concord.org/releases/latest/static/dg/en/cert/index.htmlhttps://codap.concord.org/for-educators/
Data Nuggets: http://datanuggets.org
Desmos: www.desmos.com/calculator
Google Sheets: www.google.com/sheets
Fathom: https://fathom.concord.org
JASP: https://jasp-stats.orgwww.rollapp.com/app/jasp
R Studio: https://rstudio.cloud
Tinkerplots: www.tinkerplots.com