
feature
How Does Climate Change Affect Oyster Populations?
Exploring the impact of ocean acidification on shell formation in oyster larvae
The Science Teacher—January 2020 (Volume 87, Issue 5)
By Jane Wolfson, Mary Stapleton, and Asli Sezen-Barrie
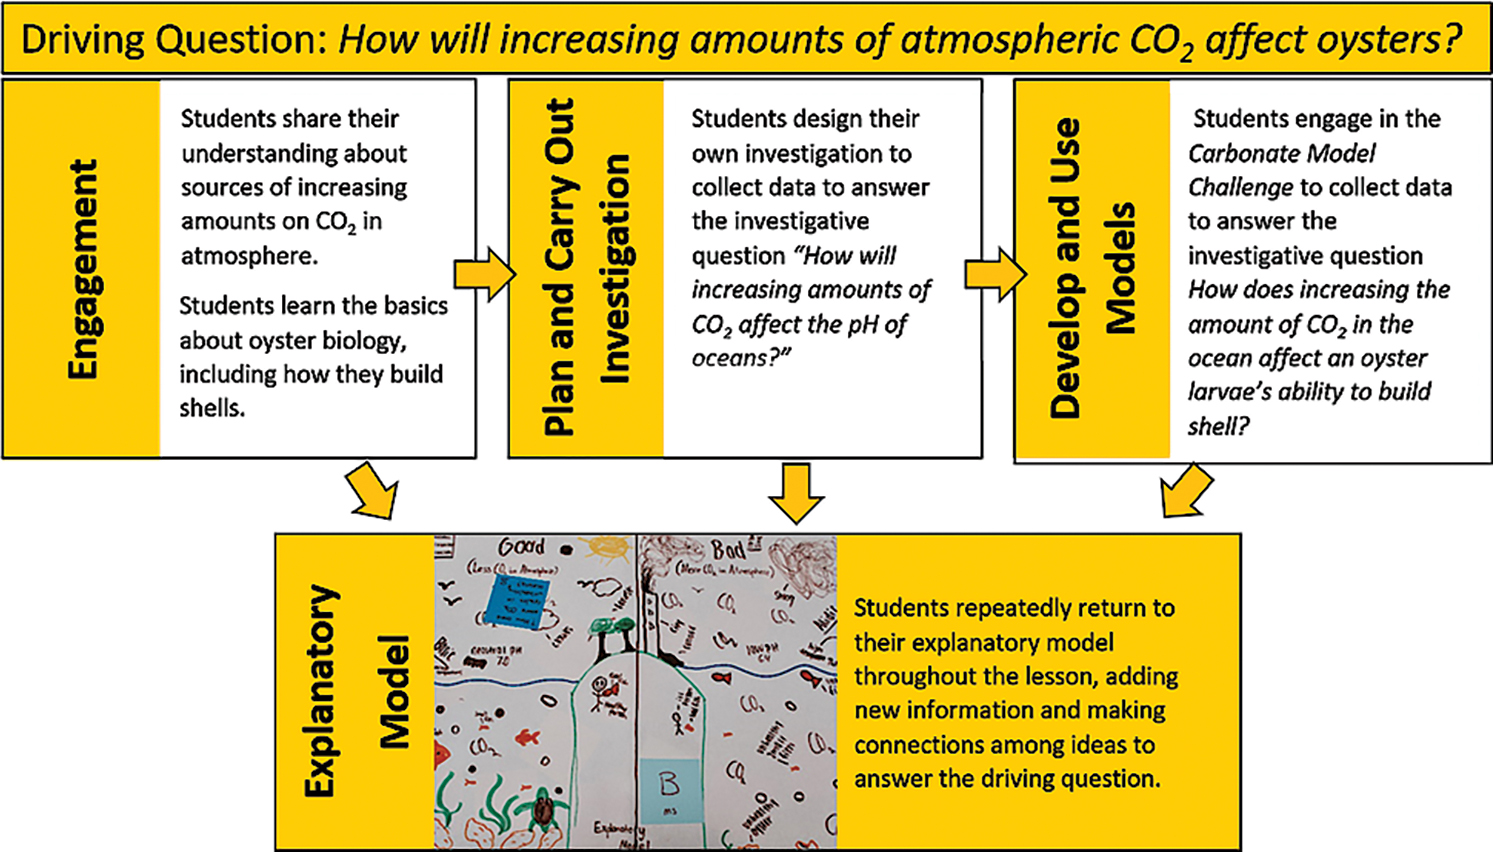
Ocean acidification (OA) has been called climate change’s evil twin for a reason. Increased levels of carbon dioxide, caused by humans burning fossil fuels, are not only causing a rise in global temperature but are also having adverse impacts on marine ecosystems. In this lesson, students conduct investigations using models to explain how increases in CO2 affect ocean pH and examine the impact of ocean acidification on the ability of oyster larvae to produce shells. This lesson is organized around an overall driving question and two more focused, investigative questions (see Figure 1). The lesson has been designed for, and implemented in, both the middle and high school levels, and takes less than 250 instructional minutes. An extensive teacher’s guide for the lesson is available (see “On the web”) and contains the activity setup and facilitation information, readings for teachers and students, scaffolding suggestions, student handouts, and anticipated student responses.
While many OA activities for students focus on its effects on adult marine organisms, such as weakening and dissolving of shells, this lesson highlights how OA impacts the ability of larval oysters to build their shells, a critical process that must occur in the first 24 hours of life (Waldbusser et al. 2015). This lesson was explicitly designed to engage students in three-dimensional learning (see Connections, p. 49), as called for by the Next Generation Science Standards (; NGSS Lead States 2013).
Background
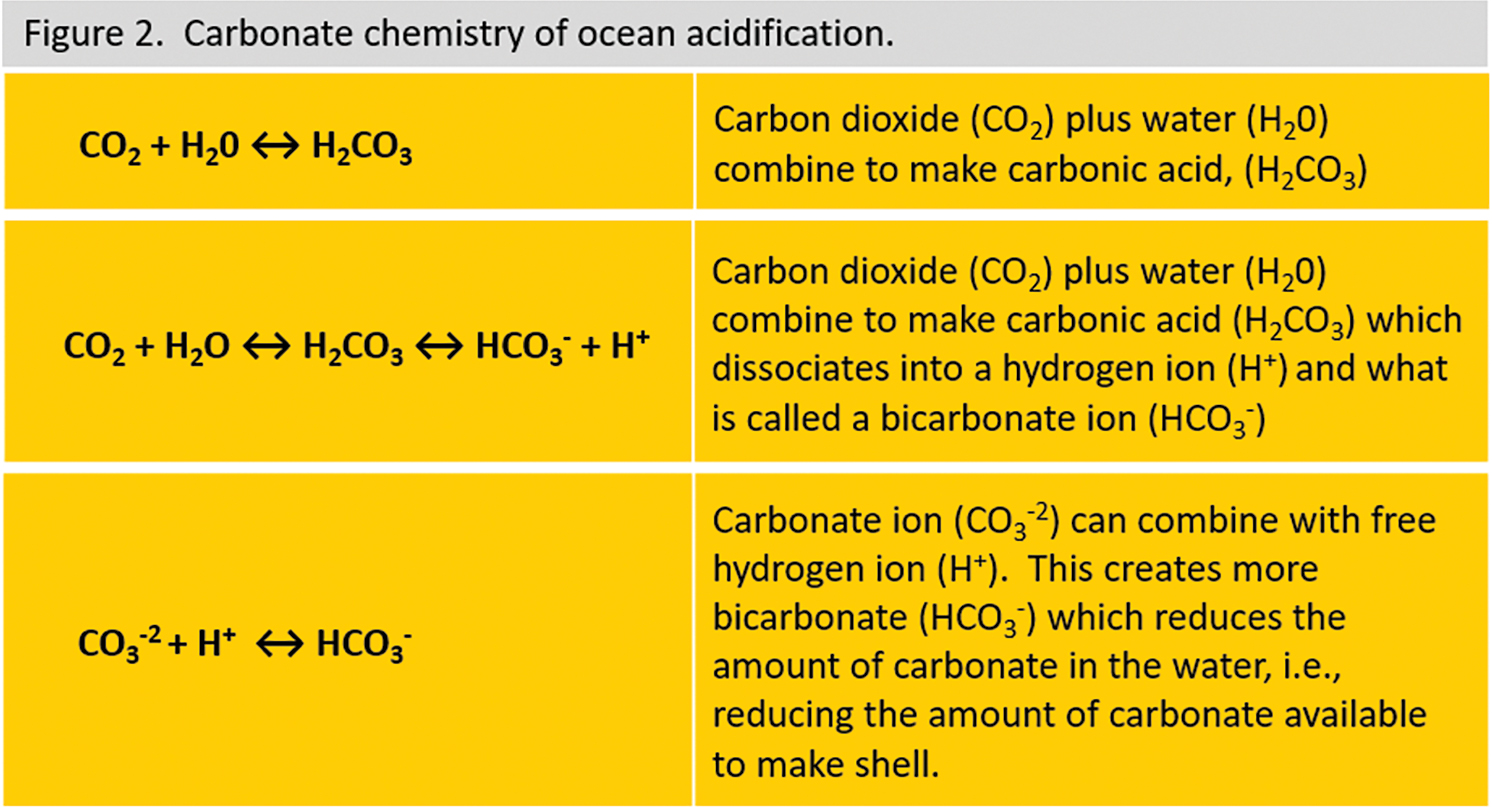
The role of increased atmospheric carbon dioxide on global temperatures is well known (IPCC 2014), but not all of the carbon dioxide released by the burning of fossil fuels enters the atmosphere. About 30% of the CO2 enters the oceans where it undergoes chemical reactions with sea water, resulting in ocean acidification (Figure 2). Acidification, in turn, affects marine life in a variety of ways. Scientists initially focused on the benefits of oceans as carbon sinks (reducing the amount of atmospheric CO2), but more recent research (Hoegh-Guldberg et al. 2014) reveals the downsides of too much CO2 in oceans (e.g., ocean acidification).
Carbonate chemistry of ocean acidification.
The Lesson
Engage
To begin, we elicit students’ prior knowledge about carbon dioxide and climate change through such questions as “What does the carbon dioxide in the atmosphere do for Earth?” and “What happened when people began burning more fossil fuel?” By the end of this discussion, students understand the following concepts:
- Some levels of greenhouse gases are good and keep Earth warm enough to support life as we know it.
- As more and more greenhouse gases are released into the atmosphere, they cause global warming.
- The “extra” carbon dioxide released by burning fossil fuels goes into both the oceans and the atmosphere.
- When carbon dioxide enters the ocean, there is less going into the atmosphere, which is “good” in terms of global warming.
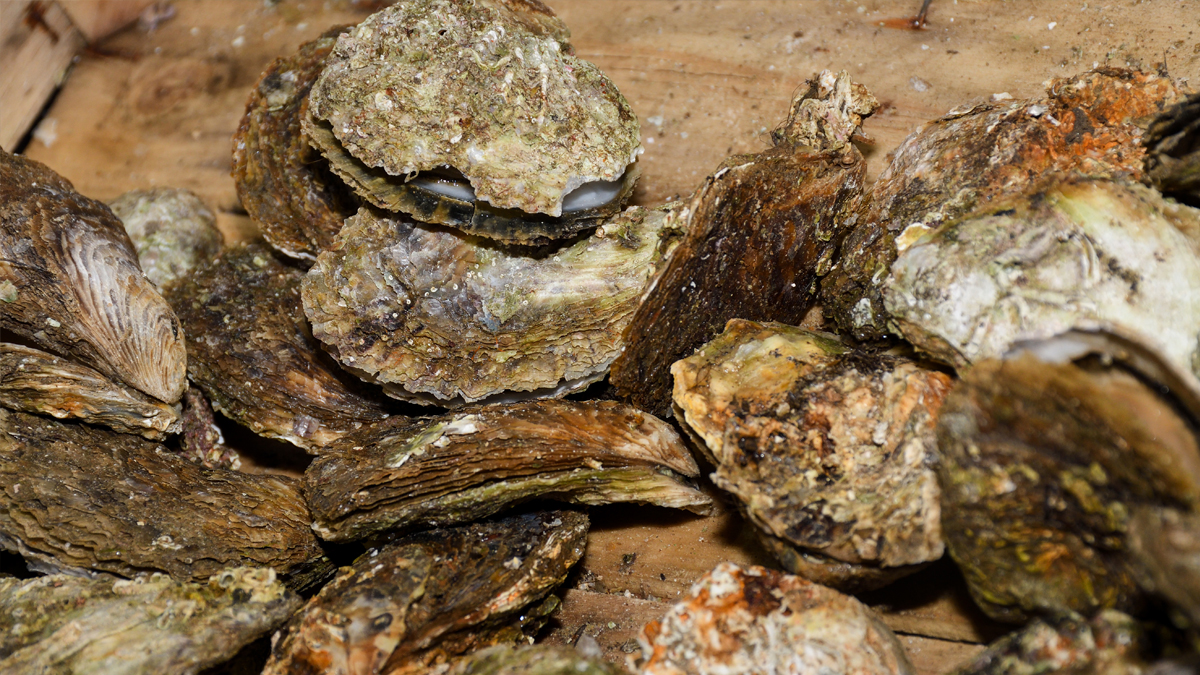
Next, we introduce oysters by giving each group of three to four students an oyster shell and a magnifying glass and asking them to look at the object and make observations and inferences. Alternatively, pictures or videos can be used to engage students with oysters. As they share their observations and inferences, we provide grade-level specific readings describing basic oyster biology and ecology (see teacher’s guide in “On the web” for the “All About Oyster” reading). We use the first minute of a video on ocean acidification by the Alliance for Climate Education (see “On the web”) to introduce the following ideas:
- Carbon dioxide released by power plants burning fossil fuels is going into and changing the oceans.
- These changes are affecting oysters and other marine life.
- People depend on the oceans for food.
Explore
To begin this phase, we ask students the first investigative question: How will increasing amounts of CO affect the pH of oceans? Planning and carrying out investigations (PCOI) is one of the focal science practices in this lesson, and we want all students to be actively engaged in designing an investigation (as opposed to us providing a set of step-by-step instructions for them to follow). We begin with a grade-level appropriate discussion of pH and include such critical ideas as “pH is a characteristic of water that determines whether organisms can survive in that environment or not.” Even students with only a basic understanding of pH can be successful in this activity.
Next, we assign our students to work in groups of three or four and challenge them to design their own investigation to determine whether and how the pH of the ocean water is affected by increased carbon dioxide. In order to scaffold the process for students and to make materials management for the teacher easier, we provide a set of limited materials, such as beakers, straws, pH test strips, and salt water, that they can use in their investigation (see teacher’s guide in “On the web” for detailed materials list).
The planning aspect of the PCOI practice provides an opportunity for students to engage in authentic real-world science. However, because many of our students are more familiar with cookbook-type investigations where the planning has already been done for them, many of our students struggle with PCOI. Some are not sure where to start, and others find themselves with an investigative design that does not actually address the investigative question.
As we circulate among groups to support and scaffold student learning, we ask a variety of prompts:
- What question are you trying to answer?
- Is your test a fair test?
- What are your variables?
- How many trials will you do?
- How will you know what is responsible for any change in pH you might see?
- Where are you going to record your data?
- Is your plan detailed enough that another group could conduct your investigation?
Many students have no idea what to use as a source of carbon dioxide, but some students understand that we exhale carbon dioxide, which also helps students figure out how to use the straws to add CO2 to the water.
Some students struggled with how to read the pH test strips, so we go over as a class how to read them. To make sure that your students are able to detect pH changes,
- use pH paper with small gradations—one strip is able to differentiate at 0.3 units in the middle of a pH range of 6–10,
- use 50–100 ml of commercial ocean salt mix (e.g., Instant Ocean) made with distilled water,
- and add carbon dioxide via exhalation through a straw for 30–45 seconds.
A list of where we purchase most of the items used in this activity is available (see “On the web.”)
Once all groups have a preliminary design for their investigation, we have our students do a peer review before the investigation (see teacher’s guide in “On the web” for a rubric students can use for the peer-review process). This allows students opportunities to practice communicating scientific ideas. Once the designs have been peer reviewed and revised, the students carry out their investigations, record their data, and share it with the whole class.
Explain
Using the class data, students are asked to construct a scientific explanation to answer the investigative question: What effect does increasing the amount of CO in the ocean have on ocean pH? We use the Claim-Evidence-Reasoning (CER) framework (McNeill and Krajcik 2012) to scaffold the process of constructing explanations for our students. For students with a more advanced background in chemistry, we have suggested an optional video (details in teacher’s guide, see “On the web”) that talks about acids, bases, and ocean acidification that students can view prior to constructing their scientific explanation.
Evaluate: Explanatory model (Phase 2)
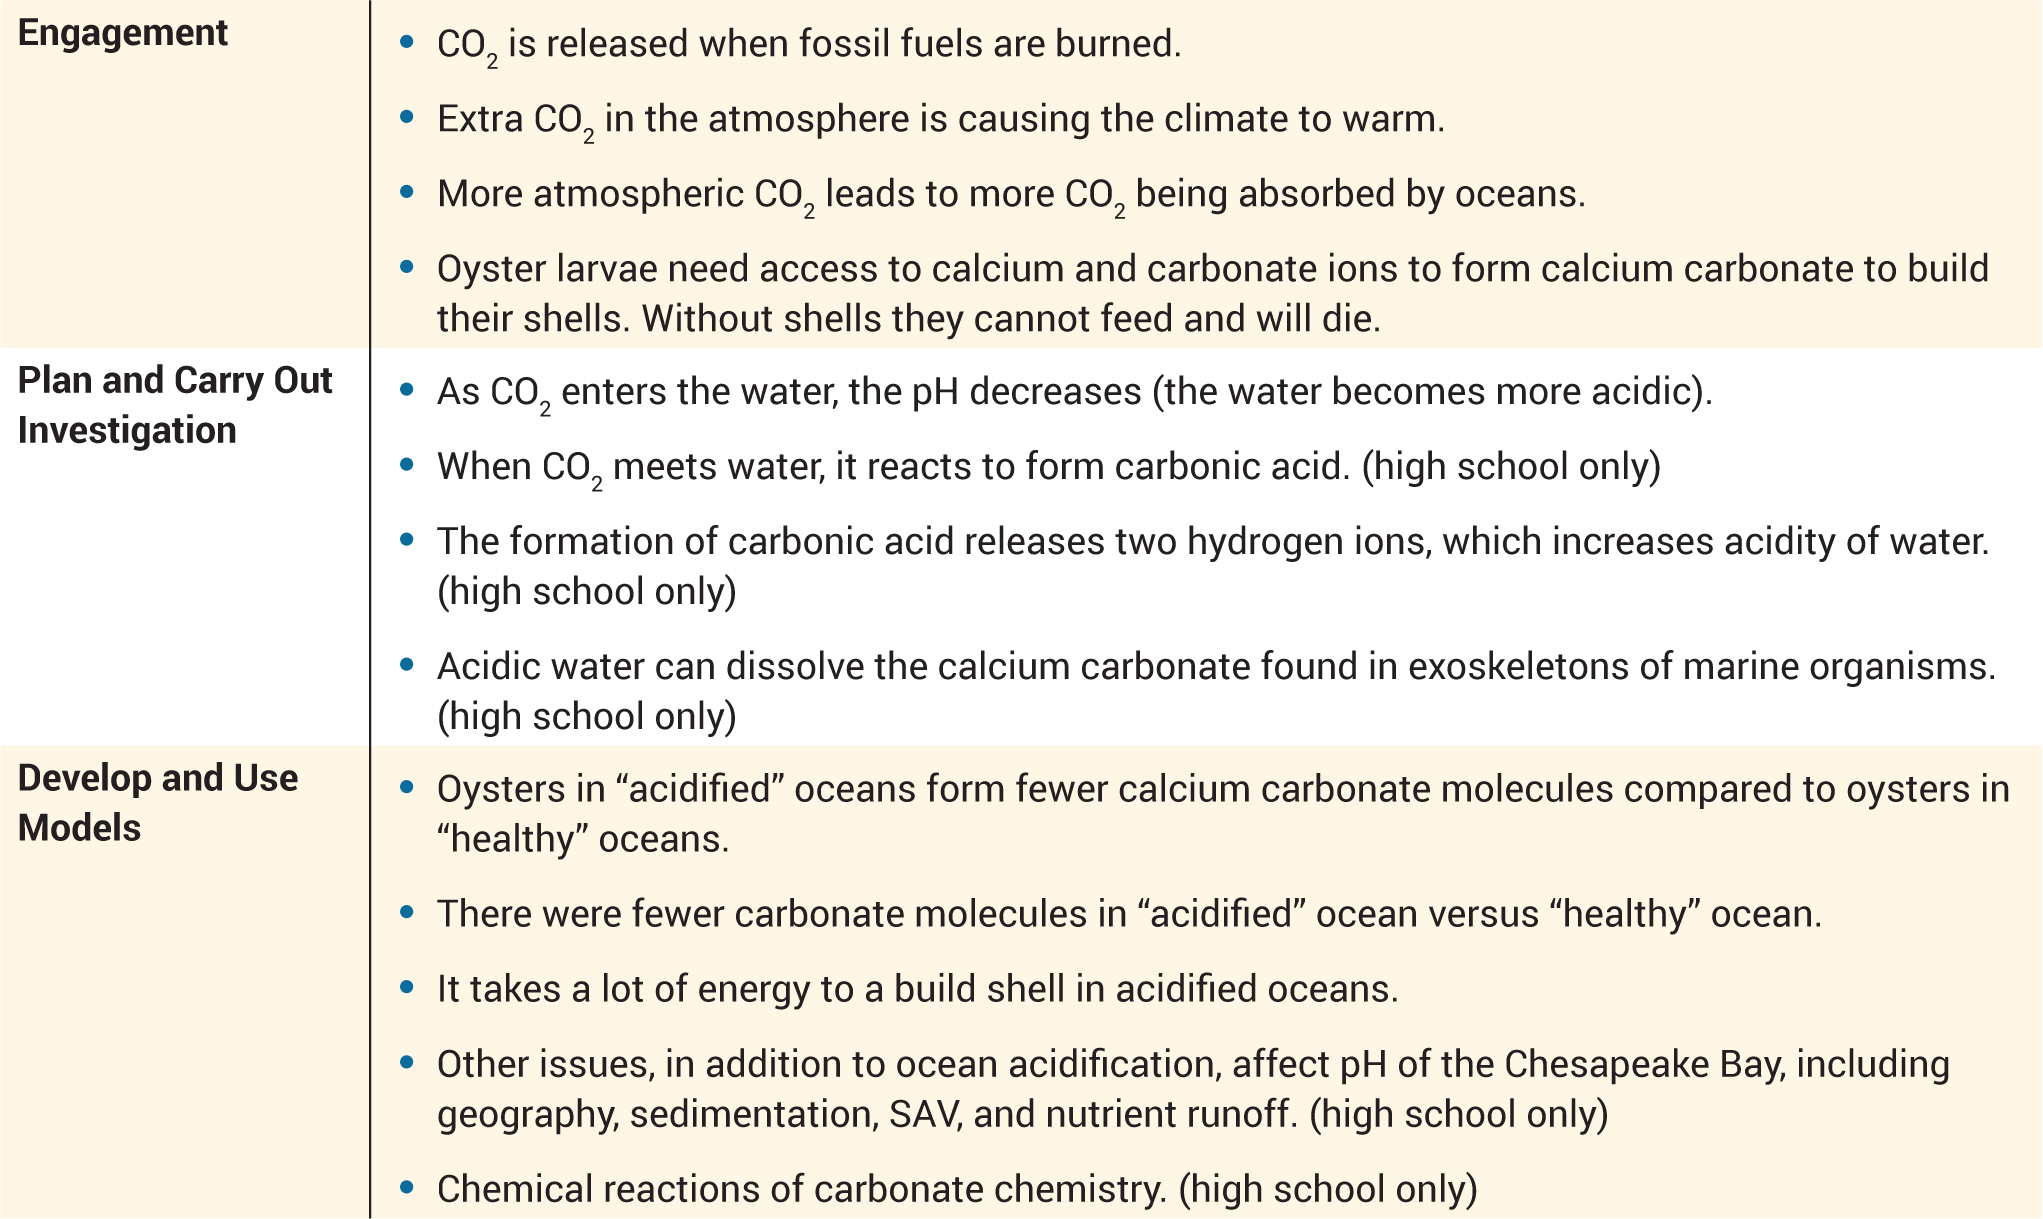
Students return to their EM armed with the results of their experiments. They still don’t know why carbon dioxide has an impact on pH and what this might mean for organisms, but they have seen that the addition of carbon dioxide will decrease the pH—and they have learned that a lower pH means a more acidic environment. Again, before they begin adding to their EM, we create a class list of “Gotta Have” ideas they should include (see Figure 4).
Explore
Students learned through their early reading that larval oysters cannot eat until they have a shell, and they must build one within 12 to 24 hours or they will die. They also learned that larval oysters build their shells by combining calcium and carbonate ions that they take from the surrounding ocean water. In the next activity, The Carbonate Model Challenge (Figure 5), students use a kinesthetic model to learn the chemistry behind the processes oyster larvae use to build shells in an acidified ocean and a healthy ocean.
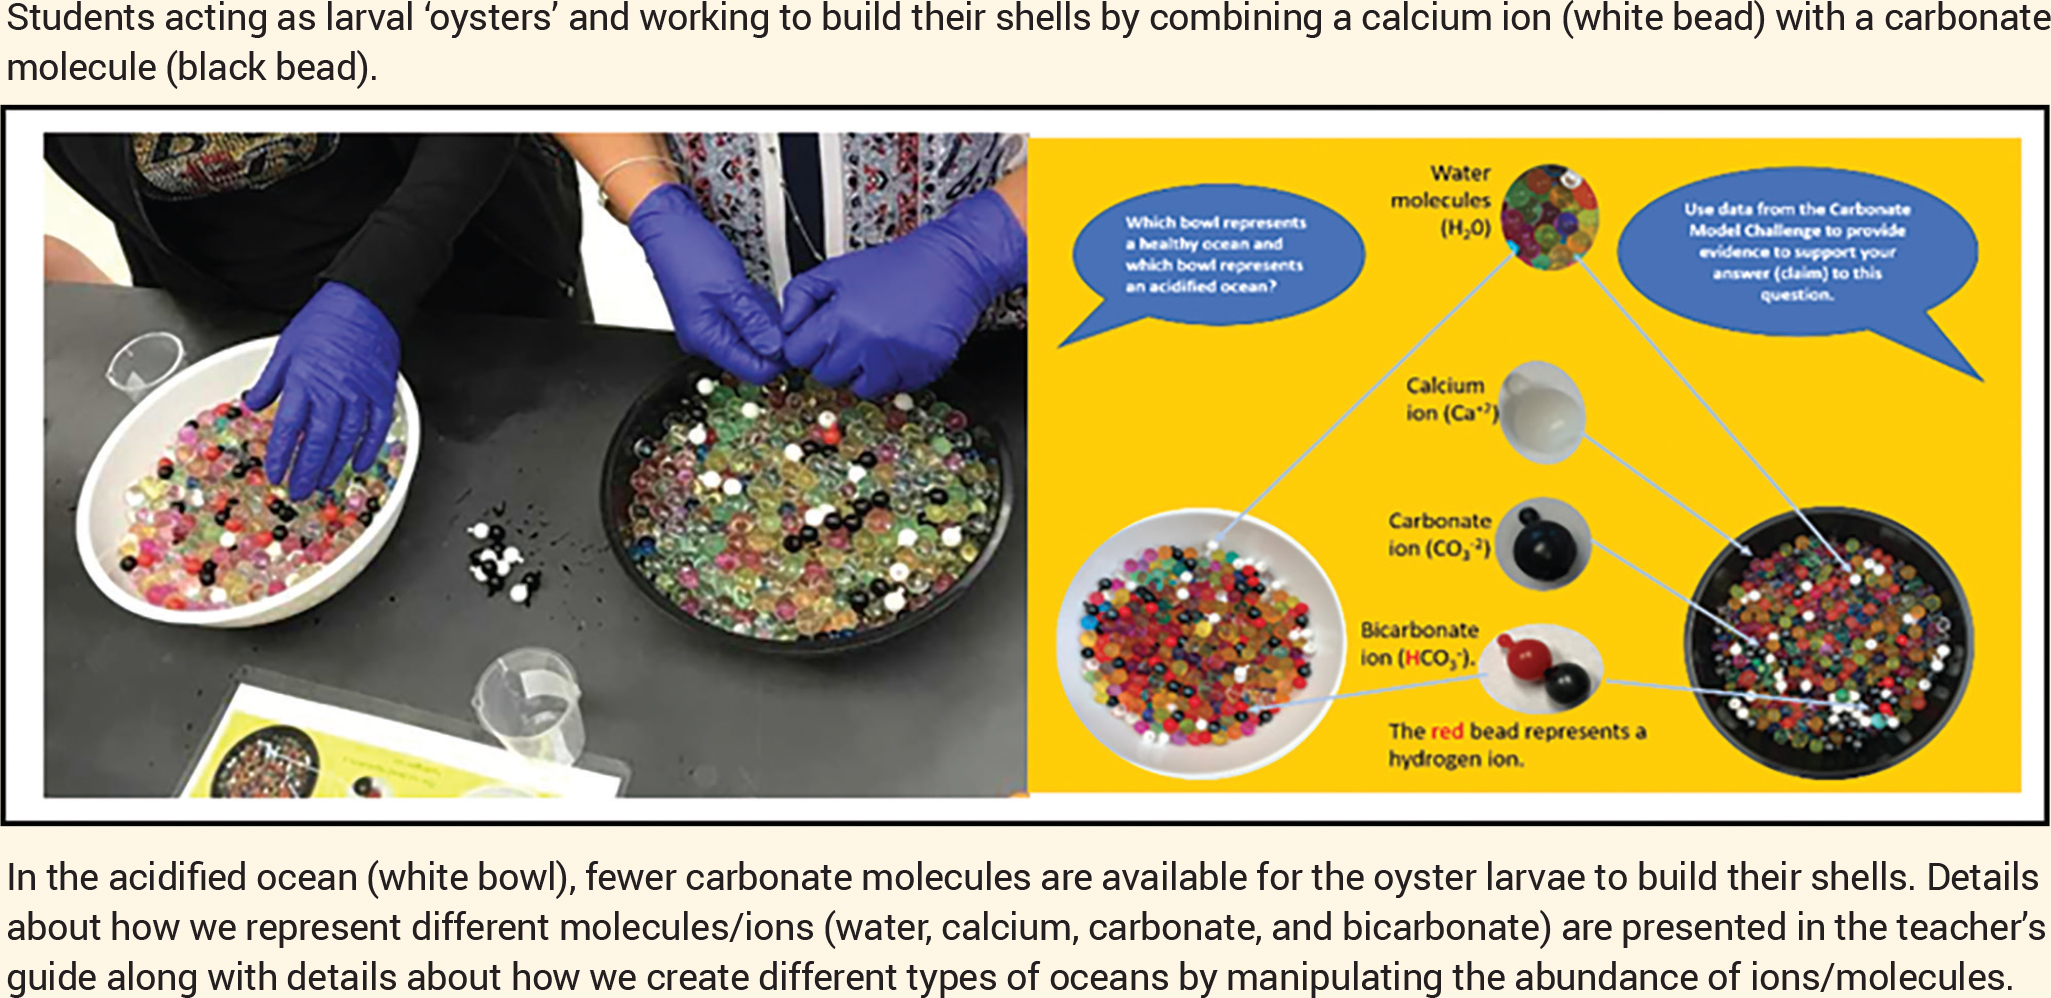
This challenge helps students answer the investigative question: How does increasing the amount of CO in the ocean affect an oyster larvae’s ability to build a shell? During the Carbonate Model Challenge groups of three to four students assume the role of newly hatched oyster larvae and attempt to build shells in different types of oceans by creating as many calcium carbonate molecules as they can within a 90-second interval. To create calcium carbonate molecules, students combine a white calcium ion pop-it bead with a black carbonate ion pop-it bead. With multiple trials, students can change roles so each can be an oyster larva in each type of ocean and the other can be the time keeper.
Explain
Once students have completed the challenge, they combine their results into a class data set, which they use to construct a scientific argument about which bowl represents a healthy ocean and which bowl represents an acidified ocean. Before they begin constructing their arguments, we have a class discussion about their experiences as larval oysters. Our students readily recognize that in one of the bowls, it was very hard for them to make calcium carbonate molecules by combining black and white beads because the majority of carbonate (black beads) were already bound to hydrogen (red bead). In the other bowl, carbonate (black beads) were readily available to be combined with calcium (white beads). After eliciting these observations from students, we provide a reading about the effect of ocean acidification on shell-building organisms, which translates the lessons learned through the Carbonate Model Challenge into more traditional chemistry.
Evaluate: Explanatory Model (Phase 3)
The Carbonate Model Challenge allows students to learn that oyster larvae in more acidified oceans are unable to make as many calcium carbonate molecules due to the unavailability of carbonate ions. This idea is further supported by a video and the OA reading we provide. Together, these materials connect the underlying chemistry (see Figure 2) to the biological challenge oyster larvae face while building shells in more acidic environments. After brainstorming a list of “Gotta Have” ideas (Figure 4) from the Carbonate Model Challenge and associated readings and videos, students return to their EM to add more information and make additional connections among ideas and concepts.
Evaluate
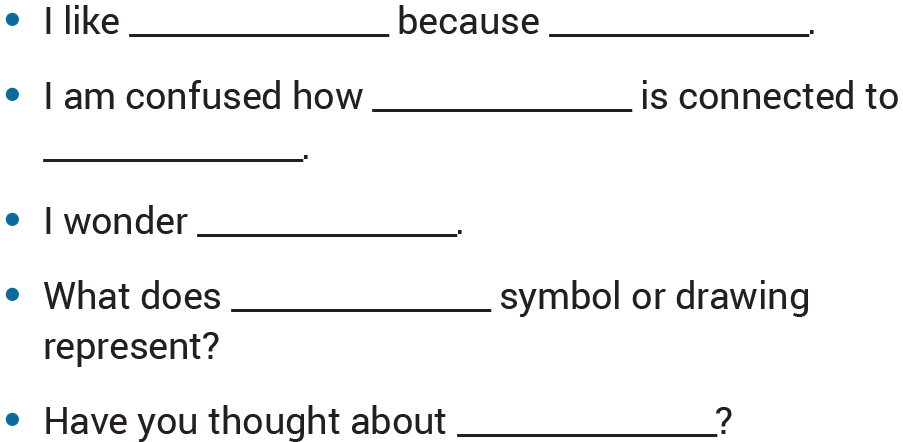
Once the small group EM are completed, we suggest engaging students in a peer-review process to receive feedback on their models. There are a variety of techniques you can use with your students to facilitate the peer-review process, including a gallery walk where all posters are displayed and students leave feedback on each poster using sticky notes (see Sticky-Note Feedback in “On the web”). We have found that some of our students benefit from scaffolding designed to support effective peer feedback, including sentence starters and prompts (see Figure 6).
Sentence starters and prompts to facilitate peer review of explanatory models.
There are opportunities for formative assessment throughout the entire activity, including listening to and observing student discussions, reviewing student responses to reflection questions and written scientific arguments, and reviewing of the EM at all stages of construction. Teachers can also use the final versions of the student EM as a summative assessment (a rubric is included in the teacher’s guide, see “On the web”). You may also choose to have students generate a final EM as individuals, using their small-group model for reference and incorporating the feedback provided by their peers, to facilitate evaluation and assessment at the individual level.
Extend
We finish the activity by discussing with students what they can do to address the issue of ocean acidification. We encourage students to learn more about these issues, pay attention to local and national policies, and do their part by reflecting on how they can reduce their own carbon dioxide footprints. ■
ACKNOWLEDGMENTS
We would like to thank all the teachers and students who provided thoughtful feedback as we piloted and worked to improve this activity. Dr. George Waldbusser provided helpful discussions on the effect of ocean acidification on larval oysters. This material is based upon work supported by the National Science Foundation (DUE 104262). Any opinions, findings, conclusions, or recommendations expressed in this material are those of the authors and do not necessarily reflect the views of the National Science Foundation.
ON THE WEB
Teacher’s guide:
http://www.towson.edu/fcsm/centers/stem/loanerlab/documents/ ocean-acid-manual.pdf
Ocean Acidification Video by Alliance for Climate Education:
http://www.youtube. com/watch?v=Wo-bHt1bOsw
OA Materials Purchasing List:
http://www.towson.edu/fcsm/centers/stem/loanerlab/ documents/oa-purchasing.pdf
Sticky-Note-Feedback:
http://ambitiousscienceteaching.org/wp-content/ uploads/2014/10/Sticky-Note-Feedback-Tool-for-Students.pdf