
Feature
Why Wetlands Matter
Using modeling and data analysis to understand wetland functions
The Science Teacher—November/December 2019 (Volume 87, Issue 4)
By Megan H. Reed, Tom Jenkins, and Lisa Kenyon
Nitrogen- or phosphorus-based fertilizers, used in agriculture, can run off into nearby waterways during periods of heavy rain or high flow and cause harmful blooms (Paerl et al. 2016), low oxygen (Joyce 2000), and decreased biodiversity (Sebens 1994). Studies of the effects wetlands can have on water and habitat quality (Verhoeven and Meuleman 1999) have shown that they contain many highly productive microorganisms that can improve water quality by absorbing excess nutrients (Johnston 1991).
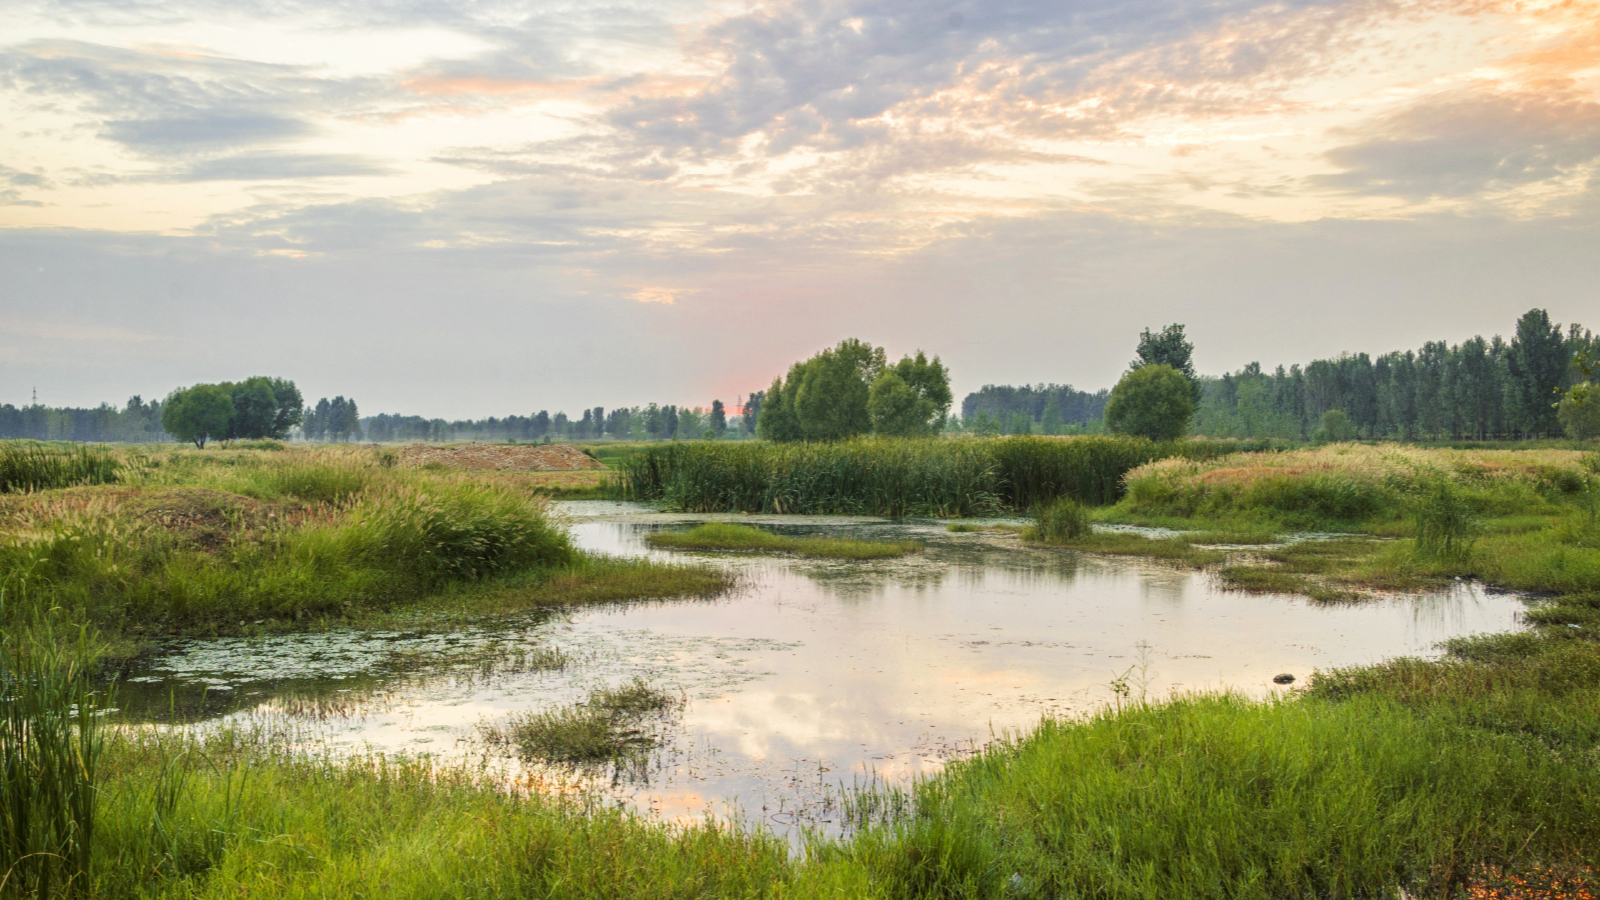
Additionally, wetlands feature a multitude of aquatic, terrestrial, and microbial organisms and can retain water during periods of high flow (Junk et al. 2006). Wetlands are a vital ecosystem, and provide supporting, regulatory, provisioning, and cultural services (Table 1). Focusing on wetlands is an opportunity for students to learn more about ecosystem interactions, human impact, and management strategies for water bodies affected by runoff.
Ecosystem services provided by wetlands.
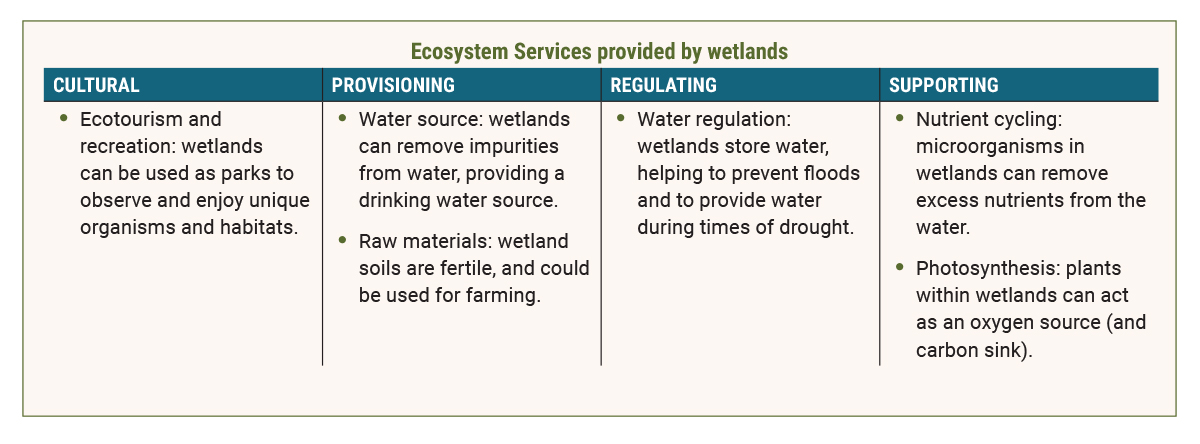
Ecosystem services that can be provided by wetlands broken up into the four types of ecosystem service: cultural, provisioning, regulating, and supporting. These services provided by wetlands can be used to give the students ideas about what components to include in their models, the students should consider what components of wetlands allow them to provide these services.
We designed this lesson to expand on the idea of ecosystem services and allowed ninth-grade students to construct a scientific model of an ideal wetland. The students explored clean water and discussed strategies to make “dirty” water “clean” or pristine.
We first led the students through an interactive conversation, showing images of pristine lakes, drinking water, and the ocean. Students offered differing ideas of clean water: drinking water, water that can support many species, and more. Students looked at images of local lakes that have a thick, green scum layer of harmful algae and we asked them to think about what makes this water dirty. The students discussed how water in the local lakes differed from our ideas of clean water, citing real-world examples such as the Gulf of Mexico dead zone or local systems like Lake Erie, as areas that have been increasingly negatively affected by runoff.
Students hypothesized possible mitigation strategies, including reducing nutrient loading to crops, and how wetlands can provide a multitude of services to help mitigate harmful effects of nutrient loading in water (Table 1, p. 36). To further explore the differences between clean (or potable) water and dirty (or raw) water, students collected water samples from water fountains on campus and were provided water from a nearby pond that had a layer of algae.
The students first visually compared the samples, discussing differences in color or clarity. The students then placed the dirty water under the microscope and described the physical shapes and colors of the different microorganisms, discussing the differences with one another. This conversation was then expanded to a full-class discussion about helpful microbes and harmful microbes, such as those present in harmful algal blooms. The students discussed how some microbes are essential in aquatic environments as part of the food chain. Some also commented that microbes can be harmful, such as the blooms discussed earlier. This activity allowed the students to gain a hands-on understanding of wetlands. With this knowledge, the students then designed a model wetland, including the types of plants, sediment layers, or internal processes that would be important for the wetland to function as an ecosystem service. They had to determine, by analyzing synthesized data from before and after wetland construction, if their wetland model was functioning as an ecosystem service.
Part 1: Modeling
Scientific modeling includes the important components of a system and their relationships to one another (Kenyon, Schwarz, and Hug 2008). Understanding and constructing models allows the students to notice trends that can help them better explain ideas. In this lesson, models were used to test the concept of “clean versus dirty” water, using the model to explain changes in the surrounding environment as a result of the wetland. The prompt for the model was “What are the components of an ideal wetland and how are they related?”
The students worked on their models in small groups, using meaningful interaction with one another to decide how an ecosystem could best be represented. Students had to model both micro and macro components and interactions that can occur in wetlands. The micro view focused on the sediment-water interface, where students labeled and explained processes that are not visible to the naked eye. For the macro view, students included plants, sediment layers, and hydrology (Figure 1).
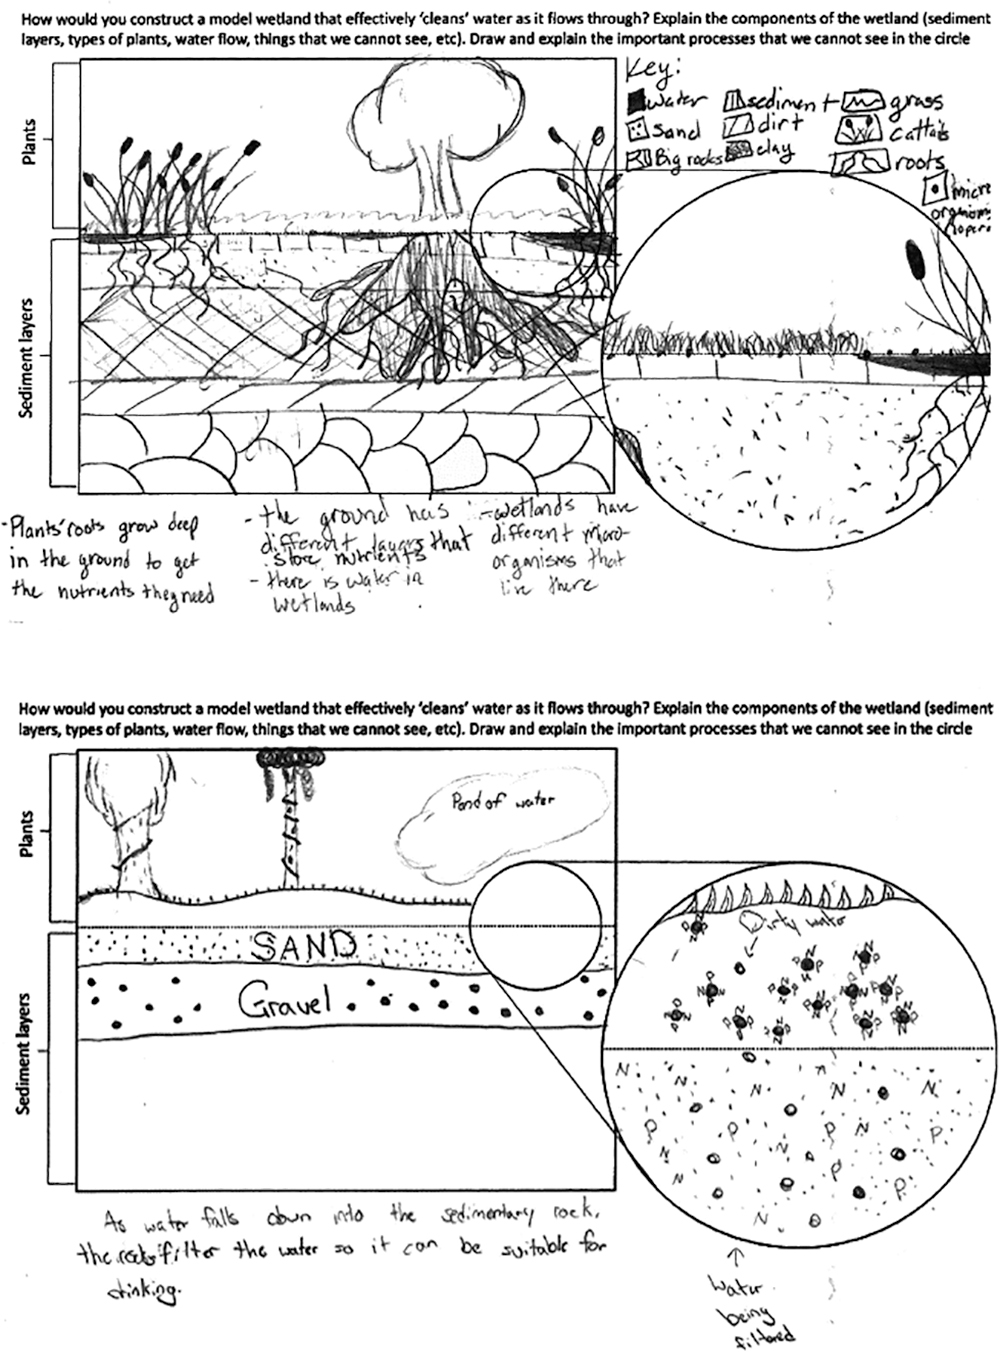
Students presented their models to the class, and were given time to provide explanations and revise their models based on other students’ contributions. For example, one student explained why he included a certain plant over the other, claiming that the “plant’s deep roots would help slow water flow.” The students were doing science while also understanding why we do science, gaining knowledge of how science is communicated (Reiser, Berland, and Kenyon 2012). This helped students think about what components of a wetland are crucial to its function, and allowed them to consider what mechanisms and processes in wetlands facilitate these functions.
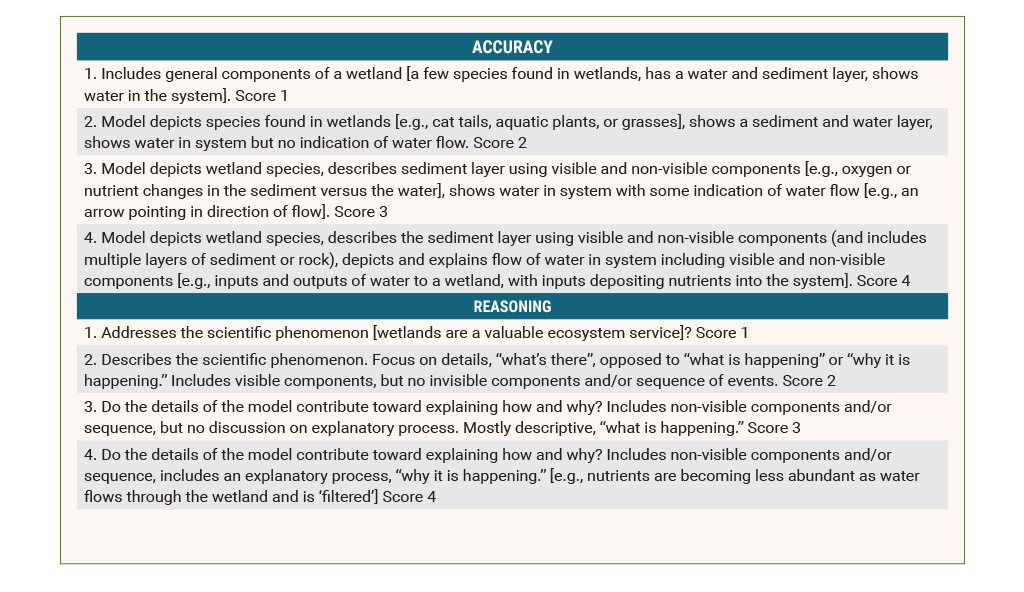
We assessed the student models based on accuracy and the use of reasoning. Accuracy refers to the scientific concepts and components explained within the model, such as species composition, water movement, or sediment layers. Reasoning refers to the explanatory thinking that the students used to justify the components added to their model. A successful model identified important components of a wetland, included understanding of interactions between those components, and explained why those interactions were important on a larger scale (Figure 1).
For example, one student model contained layers of vegetation, sand, and gravel in the macro view. In the micro view, the student showed dirty water seeping into the sediment, and nitrogen and phosphorus associated with that dirty water filtered by the sand. This student identified important components of wetlands, explained the interactions between water and sedimentary rock, and explained the big picture concept: that the wetland “filters water so that it can be suitable for drinking.” Other students used legends to identify the different components of their models, including multiple layers of sediment and multiple types of plants or microorganisms. One student depicted plant roots deep within the sediment “to get the nutrients that they need,” a good example of using explanatory thinking.
The models connect to the crosscutting concept of energy and matter, with successful models including explanations of how matter (water, nutrients, etc.) travels through and is cycled within a wetland.
Rubrics for accessing scientific models for accuracy and reasoning about ‘What are the components of an ideal wetland and how are they related?’
Part II: Analyzing and interpreting data
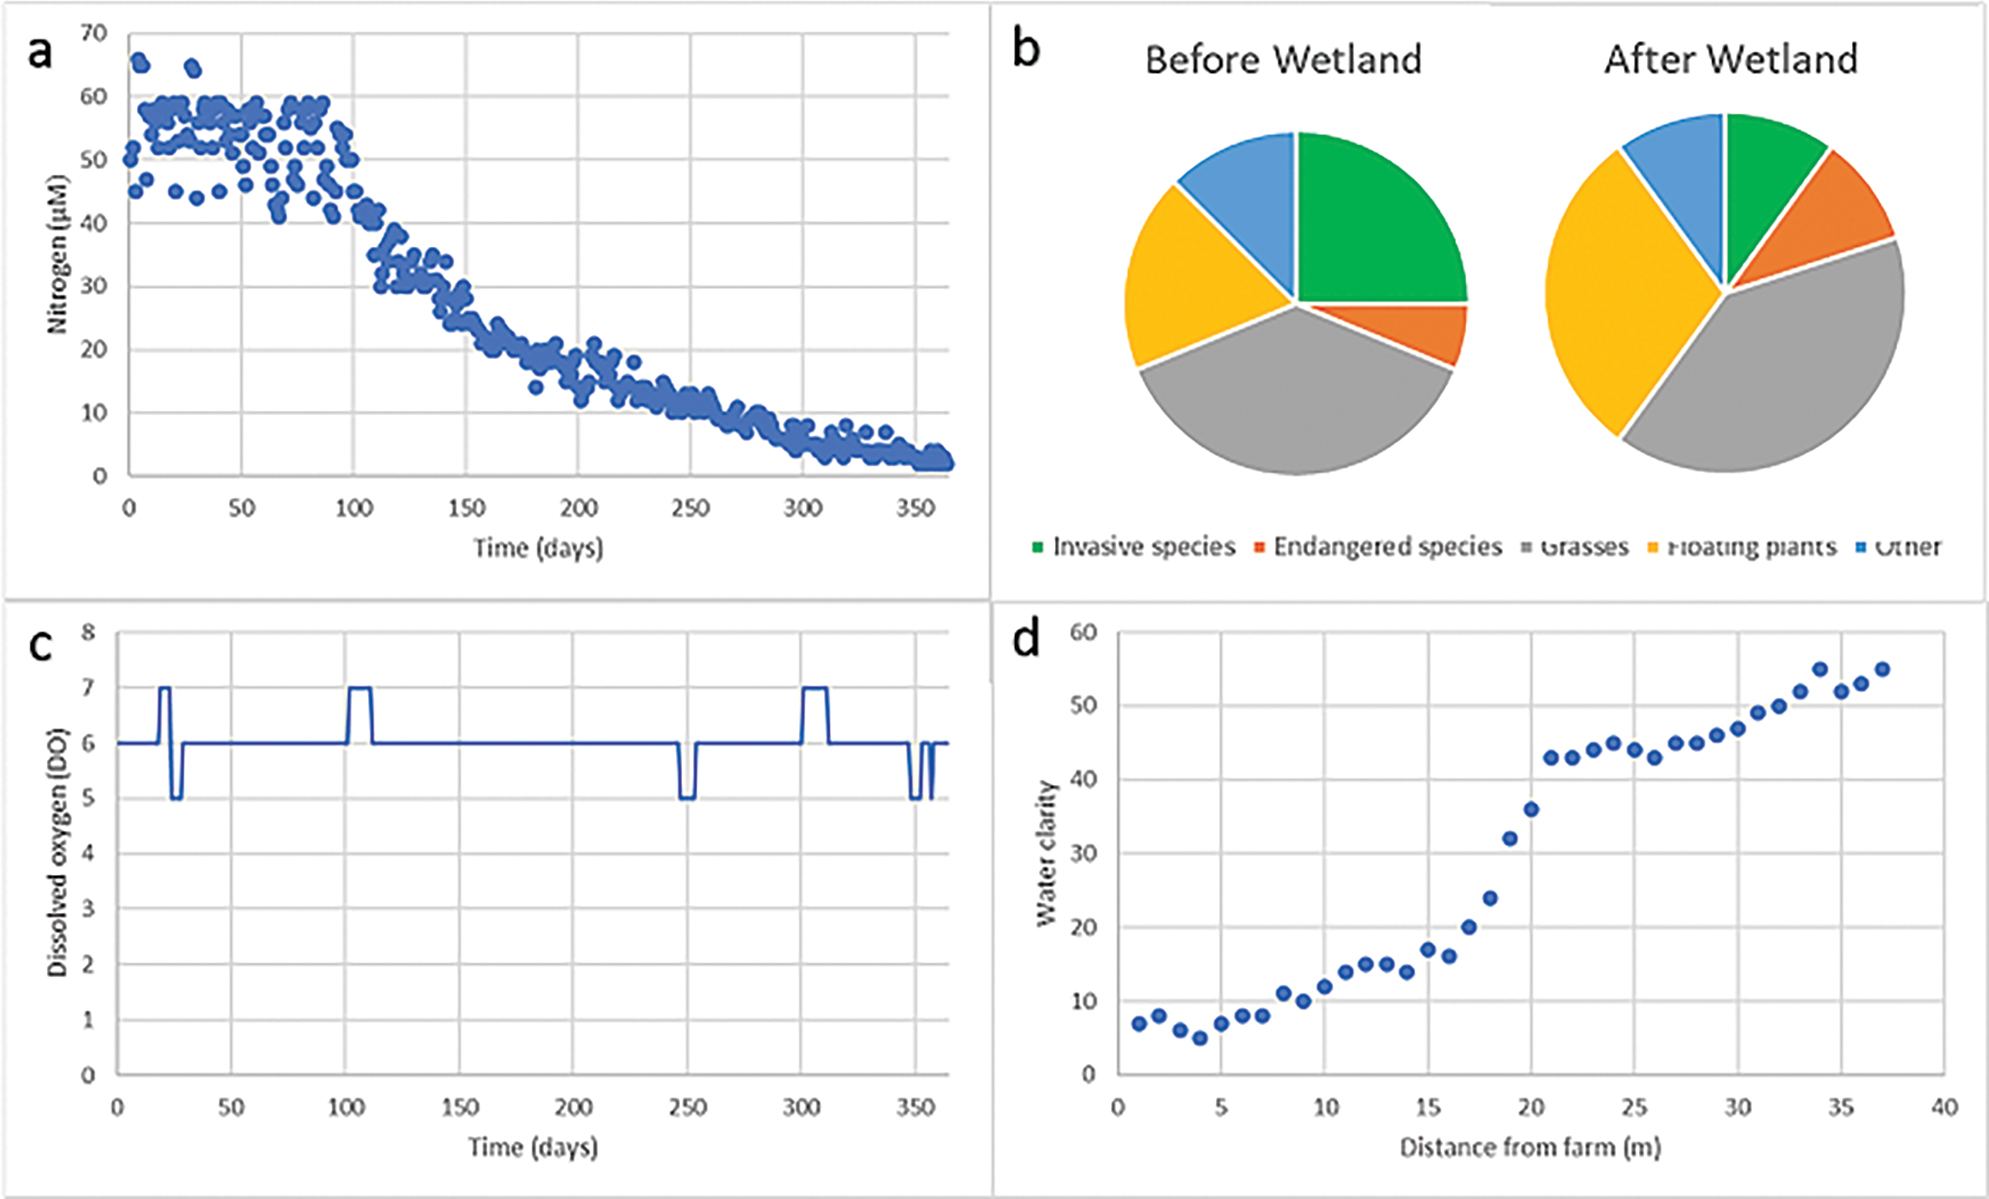
In the next part of the lesson, students were given figures of different parameters, such as nutrient concentration, species composition, water clarity, and oxygen content plotted against time (Figure 2). These data simulate data collected before and after the placement of a constructed wetland. To help students interpret the graphs, we prompted them with questions that related the graphs to their models (Table 3).
Teacher prompt questions used to help the students discuss and formulate answers to the data analysis questions.
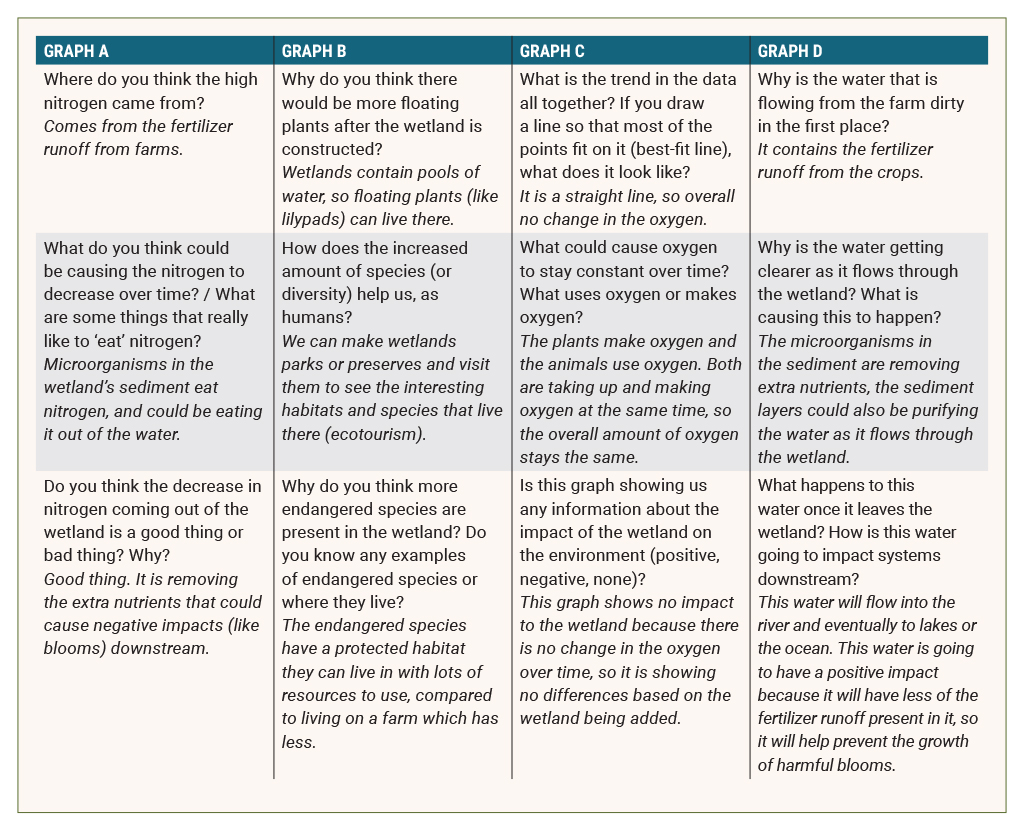
The questions tie in the phenomena of wetlands to the graphs, and try to draw from the student’s knowledge of wetlands to make informed decisions.
After identifying graph characteristics, such as axes and units, students analyzed the data to determine how each parameter was changing over time. For example, did invasive species increase after the construction of a wetland? Using these data, students selected one figure that best described the overall function of the wetland. The students chose the parameters they felt were the most important indicators of the ecosystem’s health or that best represented the wetland’s ability to provide an ecosystem service.
Some of the figures showed no change at all, indicating that the wetland was having no effect on that parameter. These data were given to students so that they would think more about interpreting results rather than what should or shouldn’t happen, and students were reminded that even though the data sometimes does not show what you are expecting, that does not mean those data are not valuable. The students had to interpret the four graphs, explaining what was displayed and what those results meant in the broad sense of wetland function. Once the students analyzed the data, they shared what data they chose and what these data conveyed about the function of their wetland as an ecosystem service with the class.
When interpreting graphs, students explained the trends in the data in multiple ways (Table 4). These interpretations can be categorized as:
- looking at one graph and interpreting it alone,
- comparing and contrasting graphs to determine which was “best,”
- using one graph to explain another graph, and
- using their models to explain the graphs.
Sample explanations students gave to the analysis questions provided for each graph.
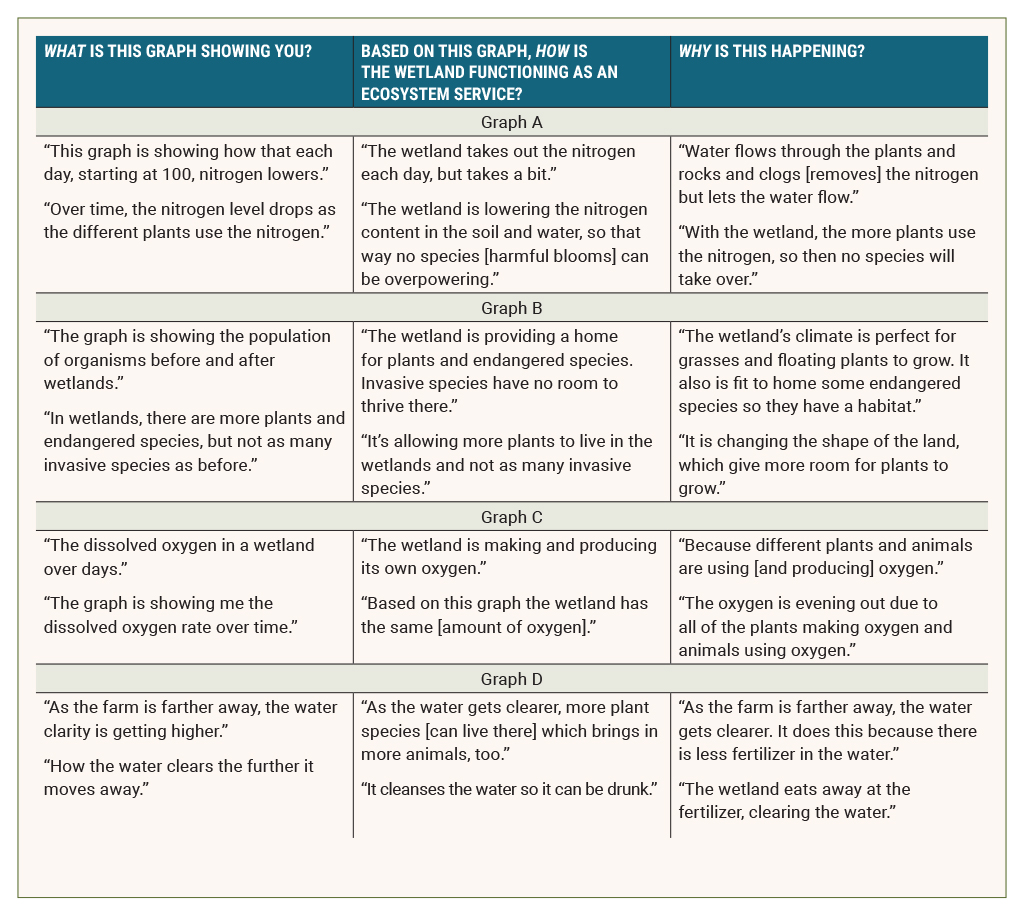
Some students used other graphs to explain the trends in the data (“as the water gets clearer, more species can live there”). Other students relate the graphs to the phenomena of clean water (“[the wetland] cleanses the water so it can be drunk”) or to harmful algal blooms (“the plants will use the nitrogen, so then no species can take over”).
The graphs all had a specific intent that the students interpreted and discovered (Figure 2). From this data analysis, the students decided which graph best represented the wetland.
To better engage students, we related the selection of their final graph to their upcoming trip to Washington D.C., explaining that when selecting a graph, they should choose the graph that they could bring with them to D.C. and best tell a policymaker “Wetlands are important and here is why.” This allowed the students to apply the practice of data analysis, while also considering the larger impact data analysis and interpretation can have on the public (politicians, non-scientists, etc.).
One of the groups was divided between selecting the change in nitrogen graph (Figure 2a) or species composition graph (Figure 2b). One of the students thought that the species composition graph showed more information because it had many different components and included multiple types of plants. The second student argued that the nitrogen graph was more important because it showed that runoff was being “cleaned up” by wetlands, and that this was a more important service provided by wetlands. The second student said that the nitrogen graph was more persuasive because it “gave people clean water,” while the species composition graph only helped the plants and animals.
In contrast, another group was torn between the two same graphs, but the student arguing for the species composition graph said it was more important because it showed that wetlands can support multiple types of life, and that “people would want to visit there and see the species.” Both arguments connected figures to their models and to the concept of wetlands as an ecosystem service.
Other than the figure that shows no change (Figure 2c), there is no wrong answer for which graph is most important. Rather, we assessed the explanation that the students used to justify their selection of the graph. One group used the species composition graph to explain the graph depicting a loss of nitrogen over time, stating that the “increased species were using up the extra nitrogen.”
Some students also used their graphs to explain big picture concepts. One group said that the water clarity graph (Figure 2d) showed the water being cleaned by the wetland, “getting rid of harmful algae caused by runoff.” The generalization of the graphs, using the crosscutting concept of stability and change and referring to their models, depicts exceptional data analysis and interpretation.
Stability and change can be evidenced in this lesson from the student explanations of the graphs, and the disciplinary core idea of Human Impact on Earth Environments can be depicted from the big picture explanations the students use to justify their graph analyses. For example, one group of students said that the high level of nitrogen in the nitrogen versus time figure was a result of runoff, and that the decrease of nitrogen over time meant that there was a change in the water quality, helping to reverse the human impact on the water.
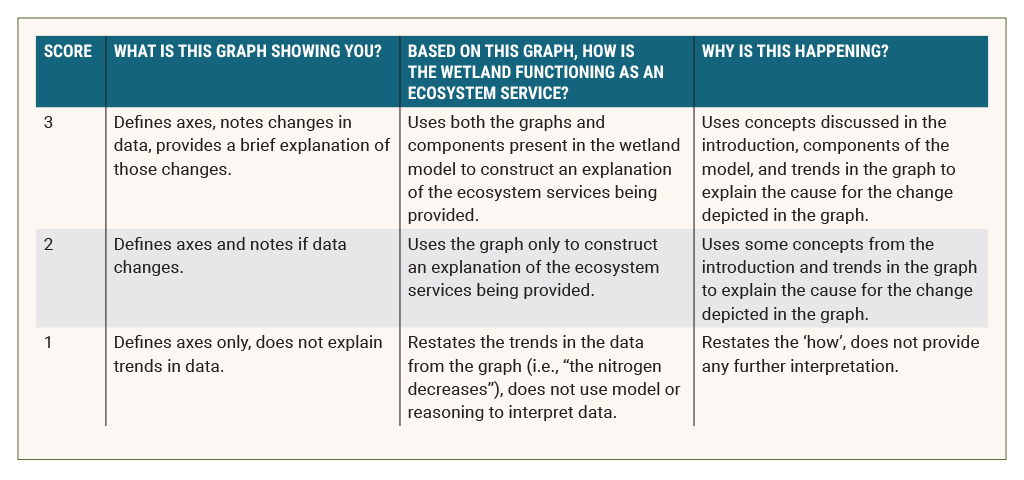
Rubrics for accessing student data analysis about different wetland parameters.
Conclusion
This lesson allowed students to gain an understanding of how natural systems can help mitigate negative human impact on the environment. Students explored the ideas of communicating science, and the importance of science in many other disciplines (agriculture, policy, etc.). This lesson is a unique way for students to gain knowledge of human effects on the environment; not only what humans have done to harm the environment, but what humans can do now to fix it. Through this lesson, students can explore an ecosystem that many have likely not interacted with before, expanding their own area of knowledge, and potentially facilitating an even greater interest in environmental science.
Biology Environmental Science High School