
Student-Driven Citizen Science
Student-Driven Citizen Science
By Abby Plummer and John Van Dis
Investigating marine plastic pollution
In most citizen science projects, students help scientists collect data to answer a question posed by the scientists. The Maine Math and Science Alliance (MMSA) offers a new twist on citizen science in which students generate and run their own community- and place-based investigations, with the help of scientists and professionals. Students involved in these WeatherBlur investigations see themselves as real scientists because they ask the questions themselves and collect the data about issues important to them and their local communities. WeatherBlur, envisioned and staffed by MMSA, is a community-based nonhierarchical citizen science platform that allows communities to develop their own research programs, called investigations, to help them solve a local problem that is related to weather or climate-changing events.
In the fall of 2017, we participated in WeatherBlur, collaborating with our fifth-, sixth-, and seventh-grade students on an investigation of marine microplastic pollution. Through this citizen science program, students grasped the threat that microplastics have on the environment and wondered why adults were not more aware and concerned. In fact, they became so impassioned that they actively engaged in environmental advocacy, including making a documentary to share with the community.
This article describes our experiences of how this process evolved and how it could be adapted to fit other locations and environmental issues. An investigation similar in scope could take three to four weeks to complete, depending on how many curricular ties are brought into play. Creating the documentary added another five weeks of time, a time frame that could easily be altered by changing the scope of the communication stage of the project. Teachers not working in Maine could contact local conservation groups, the National Weather Service, and university researchers to build the networking needed to support this type of student-centered investigation.
Engage
We started our citizen science investigation process by going on walks and having our students develop questions about what they observed in the different ecosystems on our campus, which includes the ocean, a stream, woods, and school grounds. Schools without these resources could do the same thing by visiting local beaches, wetlands, forests, and botanical gardens.
Using the community of students, teachers, researchers, and professionals established on the WeatherBlur site (see Resources), we then explored what it means to ask “SMART” questions (Specific, Measurable, Attainable, Realistic/Relevant, and Timely). During this process, fifth-grade students worked in small groups to create SMART charts in which they could think critically about their questions and assess them based on their ability to apply SMART questions. In a SMART chart (Figure 1), students create a table in which they record their questions in the left column and then list the components of the acronym across the horizontal columns.
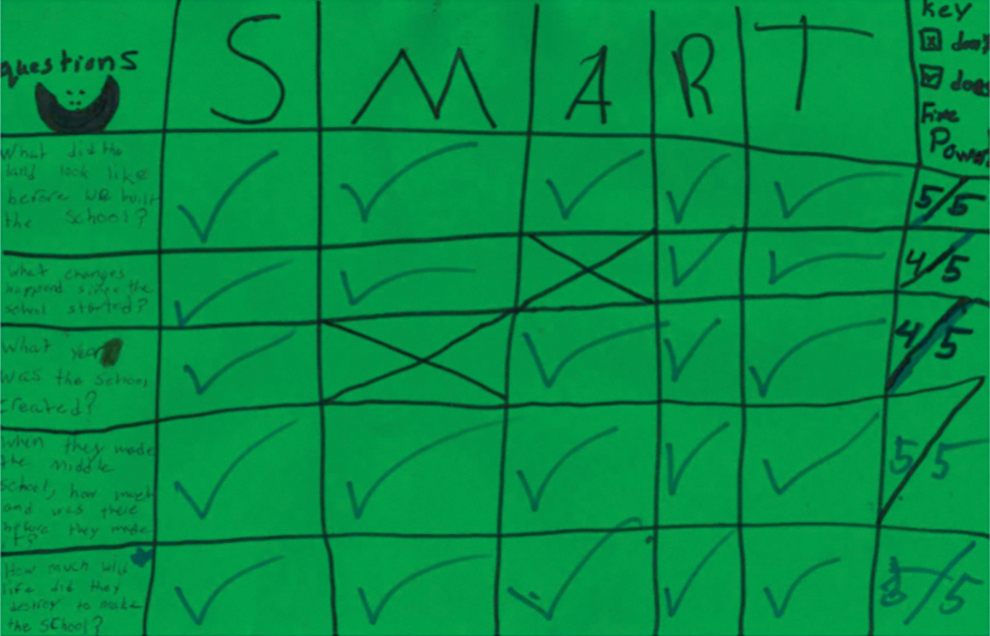
Students use the table to assess whether the question meets each independent criteria of Specific, Measurable, Attainable, Realistic/Relevant, and Timely. After students decide whether their question meets each of these requirements, they then begin to tweak their question accordingly so it could actually be investigated. We had sixth-grade students coach fifth graders on how to strengthen their questions, referencing back to activities the WeatherBlur community created for categorizing questions as SMART or not. (See “WeatherBlur Resources Index” in Resources for the “Engaging in SMART discussion lesson” and “Name that question relay game” for more information about teaching students how to ask SMART questions.)
This allowed us to sift through their inquiries and find questions that could become potential investigations using lessons described in “Generating & Reaching Consensus on Investigable iWonder Questions” from the WeatherBlur Resources Index. Once we had narrowed down our questions, we began posting them in the iWonder space (see Resources) on the WeatherBlur site. The iWonder space offers opportunities for students to post questions and receive feedback and answers from the larger WeatherBlur community. The goal is to help students strengthen their SMART questions so that they can be investigated. Accessing this space allowed our students to practice giving feedback to other schools’ questions as they eagerly awaited comments on their own questions from scientists and other students, basing their responses on the SMART charts and class discussions described above. Most often, questions arose about the specificity of the question and how to collect and measure data.
Seeing a pattern emerging of questions regarding pollution, plastic, and the oceans as a result of the walks, we showed our students The Smog of the Sea (see Resources), a documentary about microplastic pollution. All microplastics measure less than 2.5 mm (0.09 in.), and can contain fibers that are remnants of plastic threads used to manufacture rope, fabric, netting, and clothing. (See sidebar, “Background on microplastics” for more information.) Our young scientists wondered if microplastic pollution was present in our local waters, which resulted in posting new questions on WeatherBlur. Based on feedback and suggestions from students across the state and partner scientists in the iWonder space, we settled on a final question that drove our investigation, “How many microplastics are there per liter of water at our beach, and how does that compare to other beaches around the state?”
Explore
Fortunately, our campus has easy access to woods, a stream, and a gently sloped tidal flat along Penobscot Bay. However, because of the prevalent issue of microplastic pollution, a field trip to any body of water could have made this possible. Students decided they wanted to collect samples from the beach on our campus and from another location 16 km (10 mi.) away where a state ferry service travels to an island. Students thought there would be more plastics there because of the increased boat traffic. We had students brainstorm a procedure for sampling, and combined that with an existing one established by The Shaw Institute. To collect samples, students walked to our own beach and were also bussed to the beach near the ferry where they filled gallon milk jugs with water, placed the cap on the milk jugs, and carried them back to the class for analysis.
We took several safety precautions during this investigation. First, on all of our walks we encouraged students to check their clothing and exposed skin for ticks. Safety note: If a tick is lodged in a student’s skin, the school nurse and student’s family should be contacted. We also only allowed students wearing tall rain boots to enter the water when sampling, and always with adults present. Instructors also need to caution students about the hazards of trash found on the beach and floating in the water. Students should wear nitrile gloves when touching trash on the beach. Because students use needles to manipulate plastic fragments on the filters and microscope slides, proper instruction for handling sharp objects should be addressed. Furthermore, eye protection and gloves should be required when looking for the microplastics. For additional safety information, see “NSTA Field Trip Safety” in Resources.
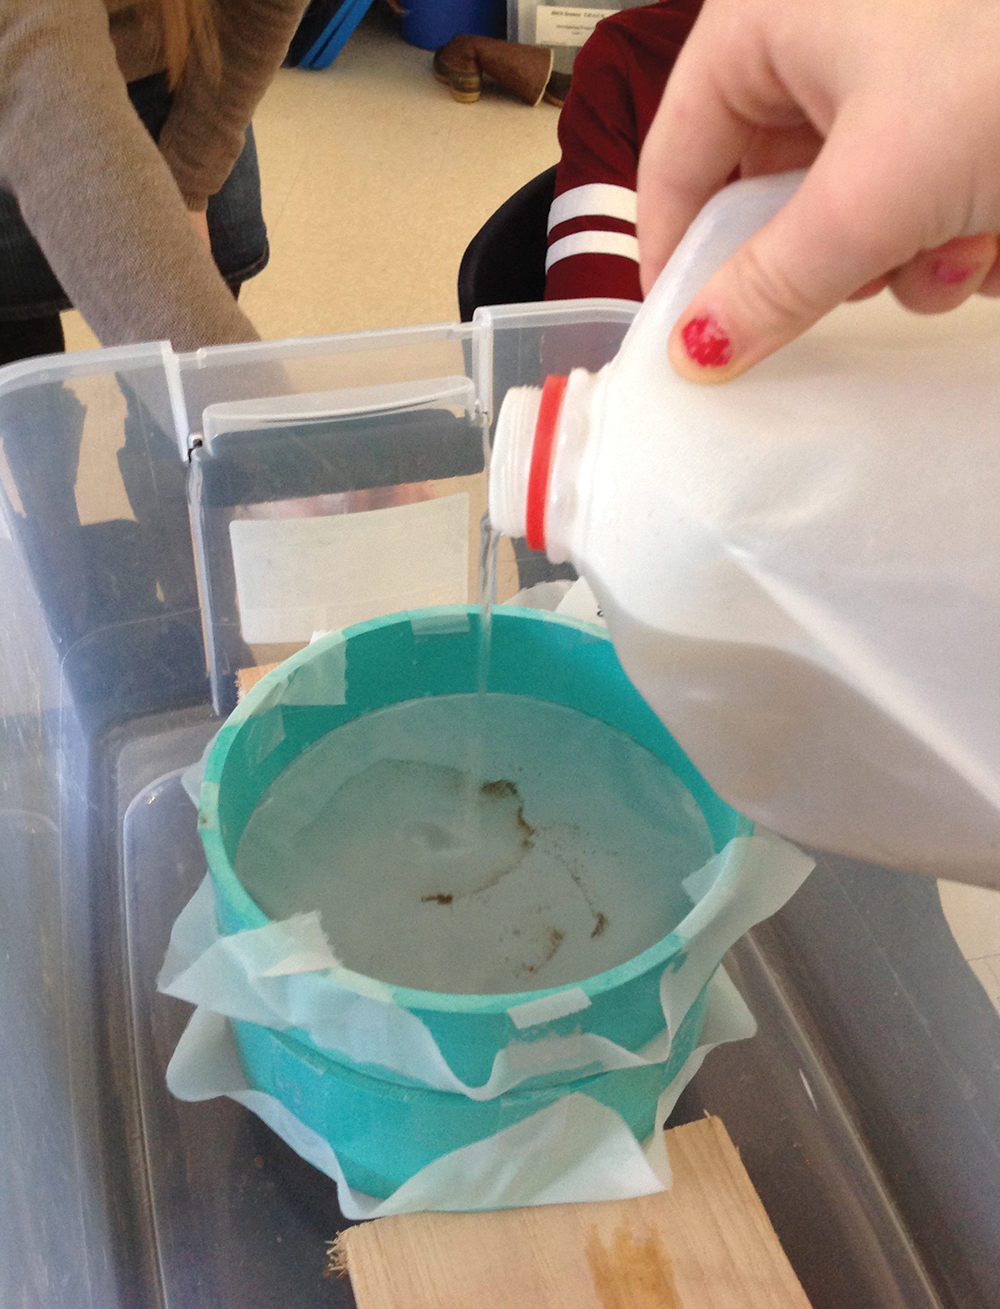
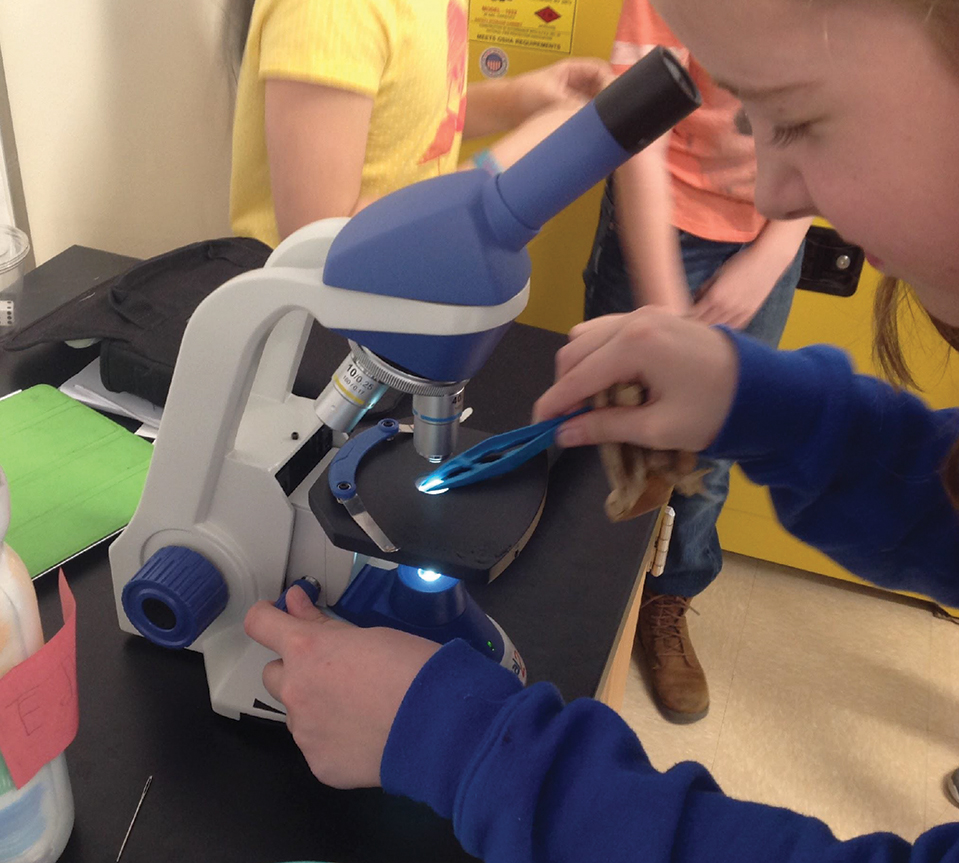
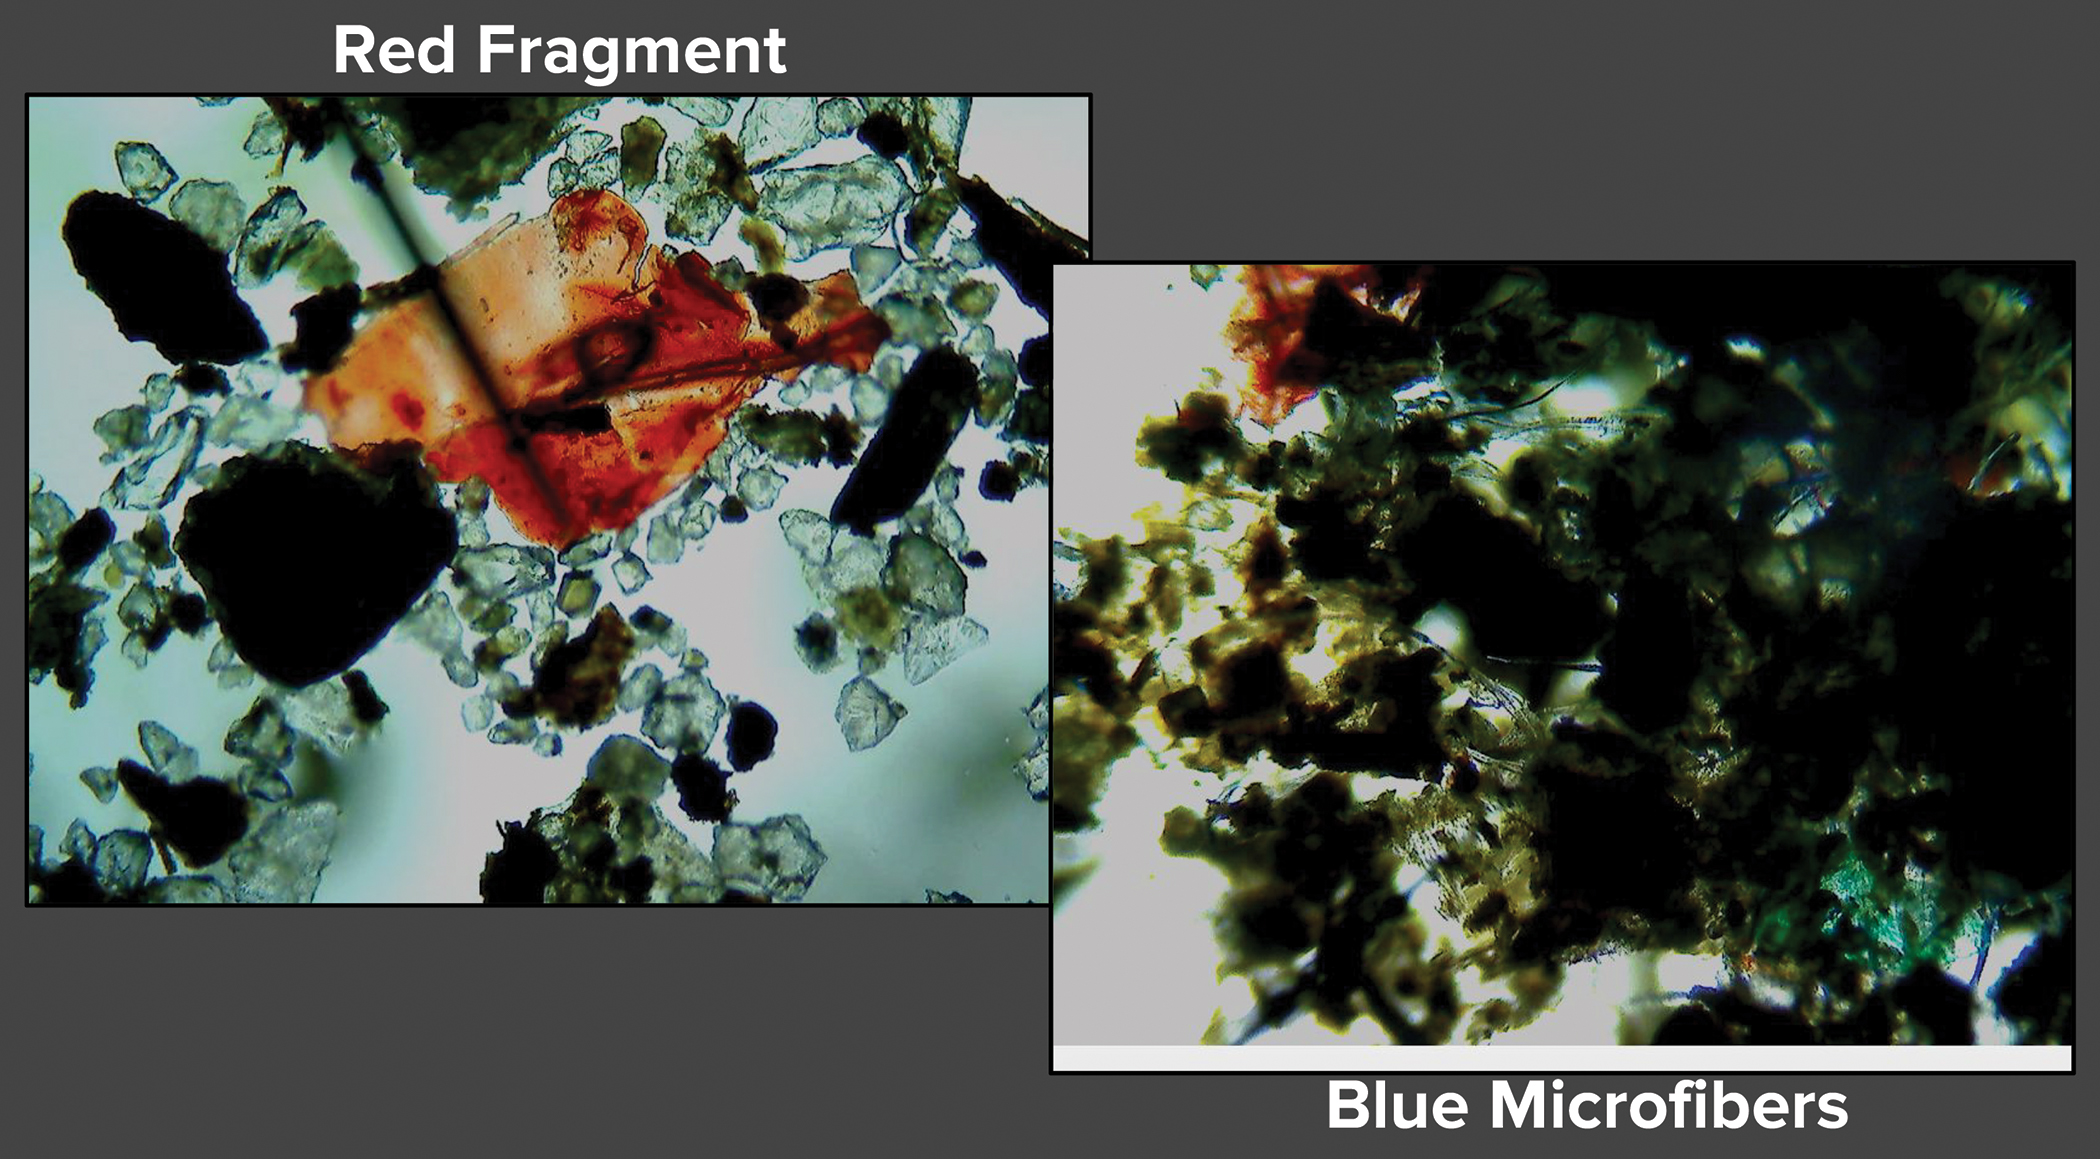
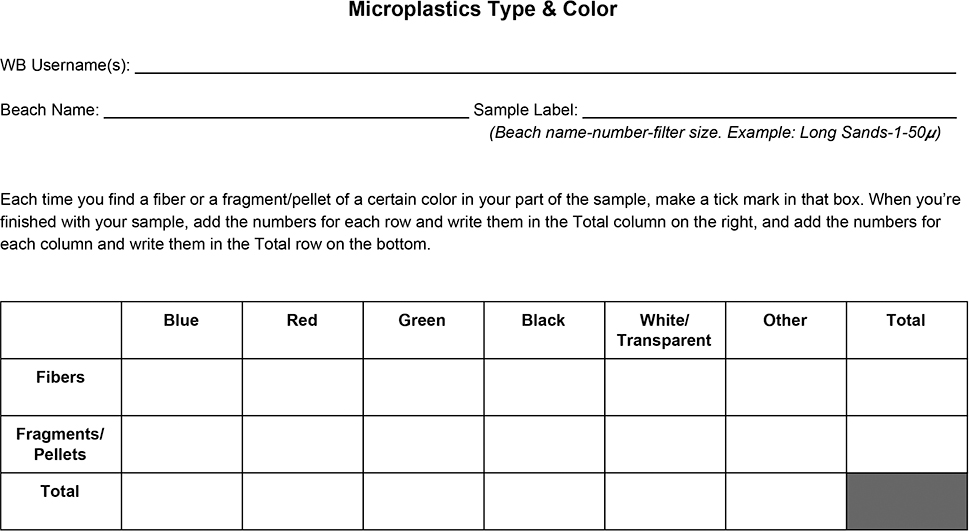
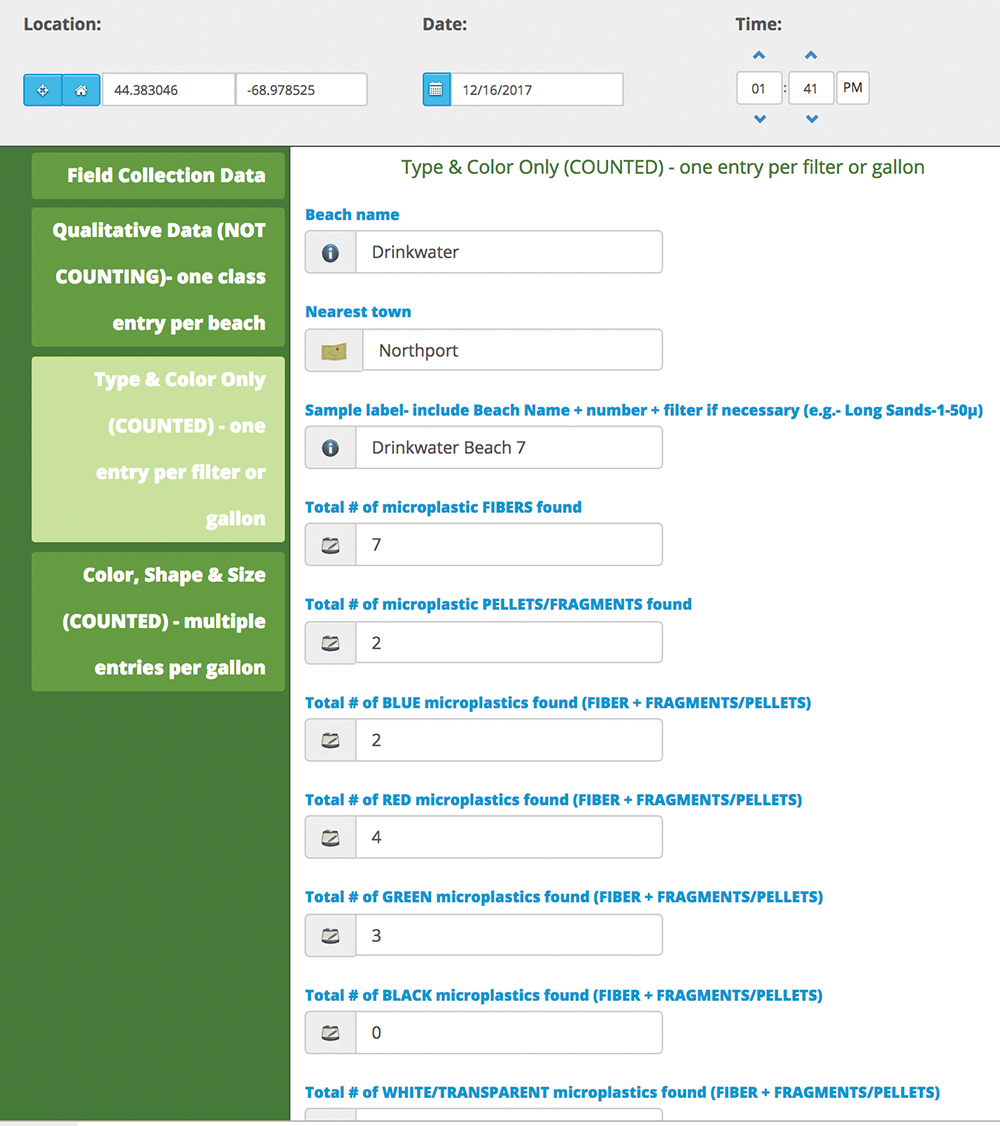
Once we returned to the classroom, students filtered the gallon samples through two stacked sieves (Figure 2), one with 53 micrometer pores and the other with 10 micrometer pores, to collect different-size microplastics. (Students wore chemical-splash safety goggles and gloves during this process.) To make the sieves beforehand, use a chop saw, band saw, or hand saw to cut the 15 cm (6 in.) diameter PVC pipe into rings about 5 cm (2 in.) high (see sidebar, p. 68, “Sieve construction”). Then, we glued the micron mesh to the PVC rings with silicone caulk. Using hand lenses, stereoscopes, and compound microscopes, students analyzed what was left in the sieves. At first, they found lots of rocks and bits of kelp, but little to no plastic (Figure 3). However, they eventually began to recognize the typical colors of plastic (red, blue, green, and clear; see Figure 4) and notice that the fibers did not have cellular structures found in plants and algae. While students were excited to find microplastic, they were horrified that there was so much plastic in the water. Students distinguished between microfibers (fibers of rope and textiles) and fragments (pieces of solid and foamed plastics), keeping track of how many and what color of each they found. Students used data charts (Figure 5) to record tally marks for each color of fiber and fragment they found in a gallon of water. All data were uploaded to the WeatherBlur platform using the online data forms created by the WeatherBlur staff based on the investigation question (Figure 6).
Analyzing data
To analyze the data students collected and to compare our samples with those collected by a school on Chebeague Island, we used our account on TuvaLabs (see Resources) to download our data from WeatherBlur and compile it into a .csv table form with variables in the first row of the table (see “TuvaLabs table instructions” in Resources). We then asked students to work in small groups to generate questions they could answer using the data in the table. Students learned to frame questions based solely on the data, such as “What was the average number of microplastic fibers found at each beach?” and “Were more blue or red plastics found at × beach?” Once each group had generated at least five questions, we asked them to use TuvaLabs to create graphs and charts that represented the answer to their questions (Figure 7).
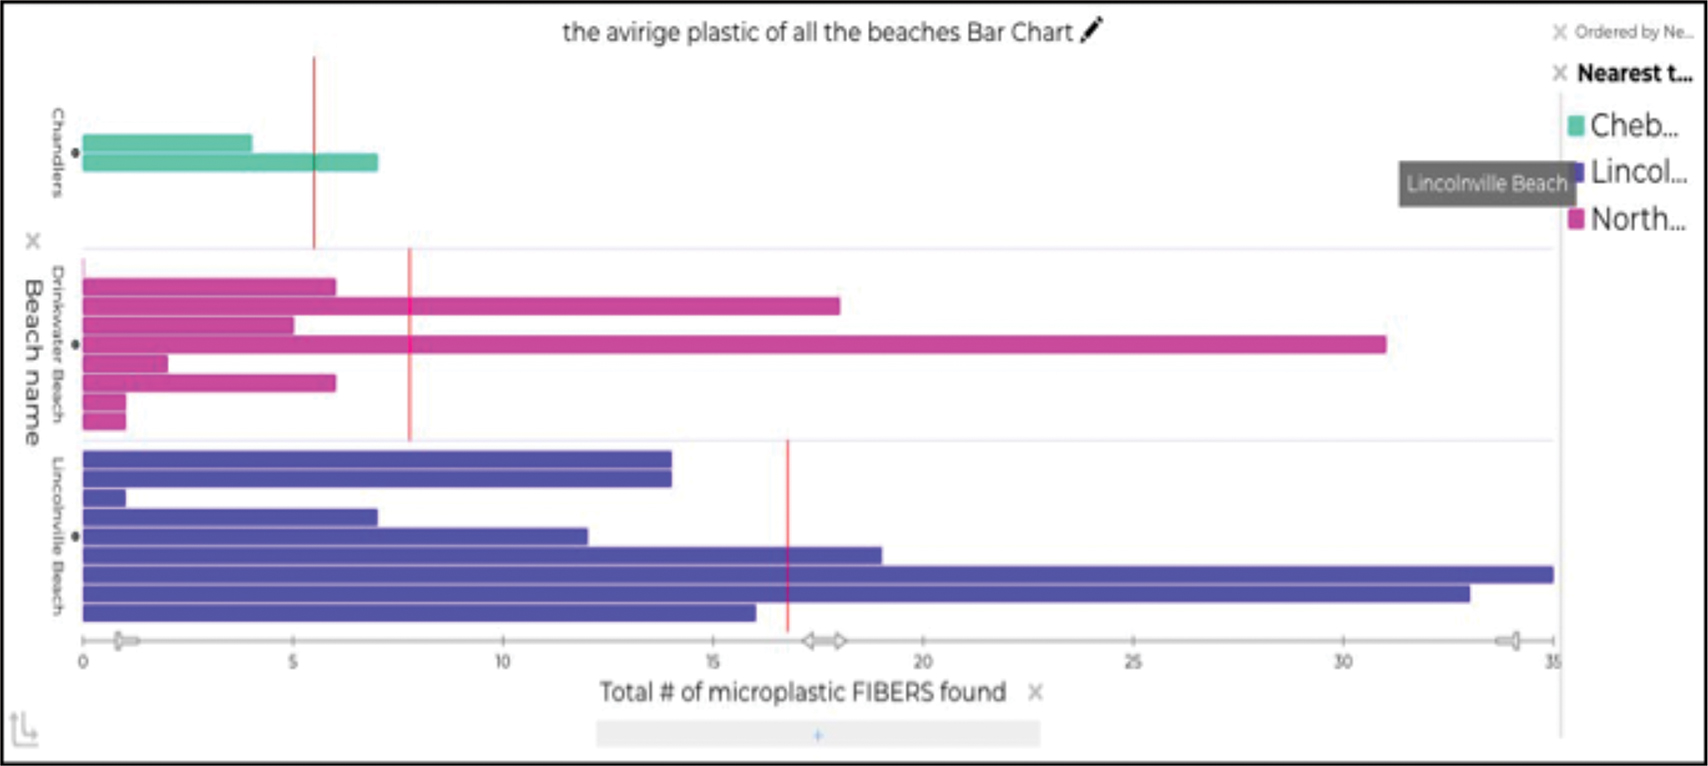
Students generated graphs of the total number of microfibers and fragments at the three locations. For the most part, students made comparisons about which beach had more microplastics and whether our campus beach had more red or blue plastics. Students clearly articulated how their graphs and charts answered their questions, but their choices of graphs and charts led to interesting conversations about what question the chart really answers and if the chart type allows for the comparisons they sought, setting the stage for future lessons to help us decide which chart works best for a given data question. It also opened up connections to math lessons on box plots, finding the center of a sample, and looking for significant differences between sampling sets.
Explain
Students next began investigating through online research and readings the effects of plastic pollution, noting how the plastic and its plasticizing compounds move through the biosphere, geosphere, hydrosphere, and atmosphere during the journey from terrestrial settings to marine settings. They tracked the microfibers as they traveled from garments through the air to the geosphere and hydrosphere, and learned how washing fleece and polyester clothing releases thousands of fibers into our waterways from our laundry machines.
We examined the effects of the plastic in the marine environment through investigations of bioaccumulation and biomagnification that modeled how the effects of these plastics quickly multiply with each trophic level. These included using an activity on TuvaLabs called “Mercury Levels in Tuna” (see Resources), and the “Biomagnification Activity,” published by Penn State Extension (see Resources). Students also learned that many planktonic organisms are reflexive eaters, consuming any particle (food or plastic) that fits a certain size criteria. Once consumed, these plastics can then destroy their digestive tracts and may cause toxic poisoning since the plastics absorb hydrocarbon compounds in water. Researchers are concerned that the hydrocarbons found in these plastics may also slow down the reproductive rate of these organisms that make up the base of the marine food web (Browne et al. 2008; Cole et al. 2013).
During this phase, students were also doing extensive reading, watching science videos, and conducting research using websites, such as the World Wildlife Fund and Surfrider Foundation, to learn about the effects of marine microplastics and efforts to mitigate the problem (see plastic pollution videos and website links in Resources). To differentiate content, we provided leveled articles from NewsELA (see Resources) or articles that we modified. We also used multiple modalities to share content, including videos, images, discussions, and learning stations; and independent, partner, and whole-group readings. Additionally, we used flexible grouping depending on the activity.
Throughout the Explain stage, our students developed a sense of awareness about the complexity of microplastic pollution, how much it impacts the environment and marine food webs, and how challenging and nearly impossible it is to get rid of. Students also began wondering whether or not other communities were thinking of this problem, and how our community could help make a change.
Elaborate
Our young scientists decided it was important to teach the world about what was happening to the environment, and what we should do about it. As a result, students made a documentary titled Plastic: The World’s Worst Nightmare that could easily be shared with numerous people (see Resources). Students were able to choose from different roles, including storyboarders, artists, filmographers, film editors, interviewers, investigative reporters, and writers. Students then filled out a proposal (see Online Supplemental Materials) for their top two roles based on their perceived skills and interests. Because we worked with 35 students in grades 5 and 6, each subgroup had four to five students working together to fulfill their role in the overall production team. The different teams were given their own set of weekly project requirements to follow as a group (see Online Supplemental Materials).
Our students realized that in order for adults to take them seriously, they needed to have evidence of the problem and some realistic suggestions for making a change. We worked with our students to develop the following guiding questions that were designed to be asked and answered throughout the video production: How do people’s choices impact water, and why does it matter? What will happen if the global population continues to grow? What are communities (like us!) doing about the problem? What can we all do to prevent this problem?
Knowing that it was important to gather this information from experts in the field, students brainstormed a list of various environmental groups we could contact, like The Shaw Institute, Hurricane Island Foundation, The Island Institute, and Surfrider Foundation. Students scheduled interviews with these organizations and some community members, including local lobstermen; students believed they would provide us with helpful information and perspectives for the film. The goal was to incorporate their findings from the interviews into our documentary, looking for solutions that they could bring back to their community.
To set up the interviews, students in the interview group were asked to write a letter to each candidate requesting a virtual interview on Skype. They were given a list of questions that helped guide their letter, including “Who are we?” (school, town, organization) “What are we creating?” “What is this video about?” and “Why are we making this video?” We then emailed the students’ letters through our teacher accounts, and set times during the school day to Skype or meet in person.
During the weeks prior to the interviews, we provided the interview group and filmographer group with links to various short documentaries so they could take notes on the types of questions that could be asked and considerations for filming the actual interviews (see Resources). Furthermore, the filmographers practiced using the camera, working with factors such as lighting and sound, and the interviewers wrote and practiced interview questions. In terms of other scaffolding, we provided students with basic interview questions to start with, including the guiding questions previously mentioned that were used throughout film production. In addition, we asked students to brainstorm specific questions that would be helpful for each interviewee to contribute to our video, as well as what kind of information they could share with us that would make our message strong and balanced. After writing the interview questions, students in the interview and filmographer groups divided the different responsibilities for each interview, including who would conduct the interview, who would take notes, and who would be responsible for filming. The interviews took place in a classroom or school library.
In the end, students produced a 15-minute video about microplastic pollution using the research and evidence they collected from their own community and their larger network of experts as part of the investigation. Students shared their documentary to a gym full of over 100 people during our community barbeque, inspiring the larger community to action.
Evaluate
Creating a documentary was the primary summative project piece used in evaluating student understanding of how communities use science to protect Earth’s resources from increasing populations and consumption. Because the work was done in groups and across grade-spans, for grading purposes we simultaneously assessed our students’ understandings and misconceptions through additional independent projects. This allowed us to differentiate the products students completed, offering opportunities for different learning styles and preferences.
Additionally, studying microplastic pollution in grade 5 ties in well with energy and matter in ecosystems, so we assigned students a food webs graphic novel, allowing for both narrative writing and illustrations to help students show their understanding (see Online Supplemental Materials for the activity outline and rubric). Furthermore, students researched regions around the world whose ecosystems have been threatened by human impacts, tying in their work with geography. For this project, students chose a region around the world that was featured on the World Wildlife Fund website, and wrote research reports, created world maps, made pie charts to show water distribution, and produced murals that showed how natural resources are affected by humans in their region. Their murals also showed comparisons of what the region could look like if those resources were protected (see Online Supplemental Materials for activities and rubrics).
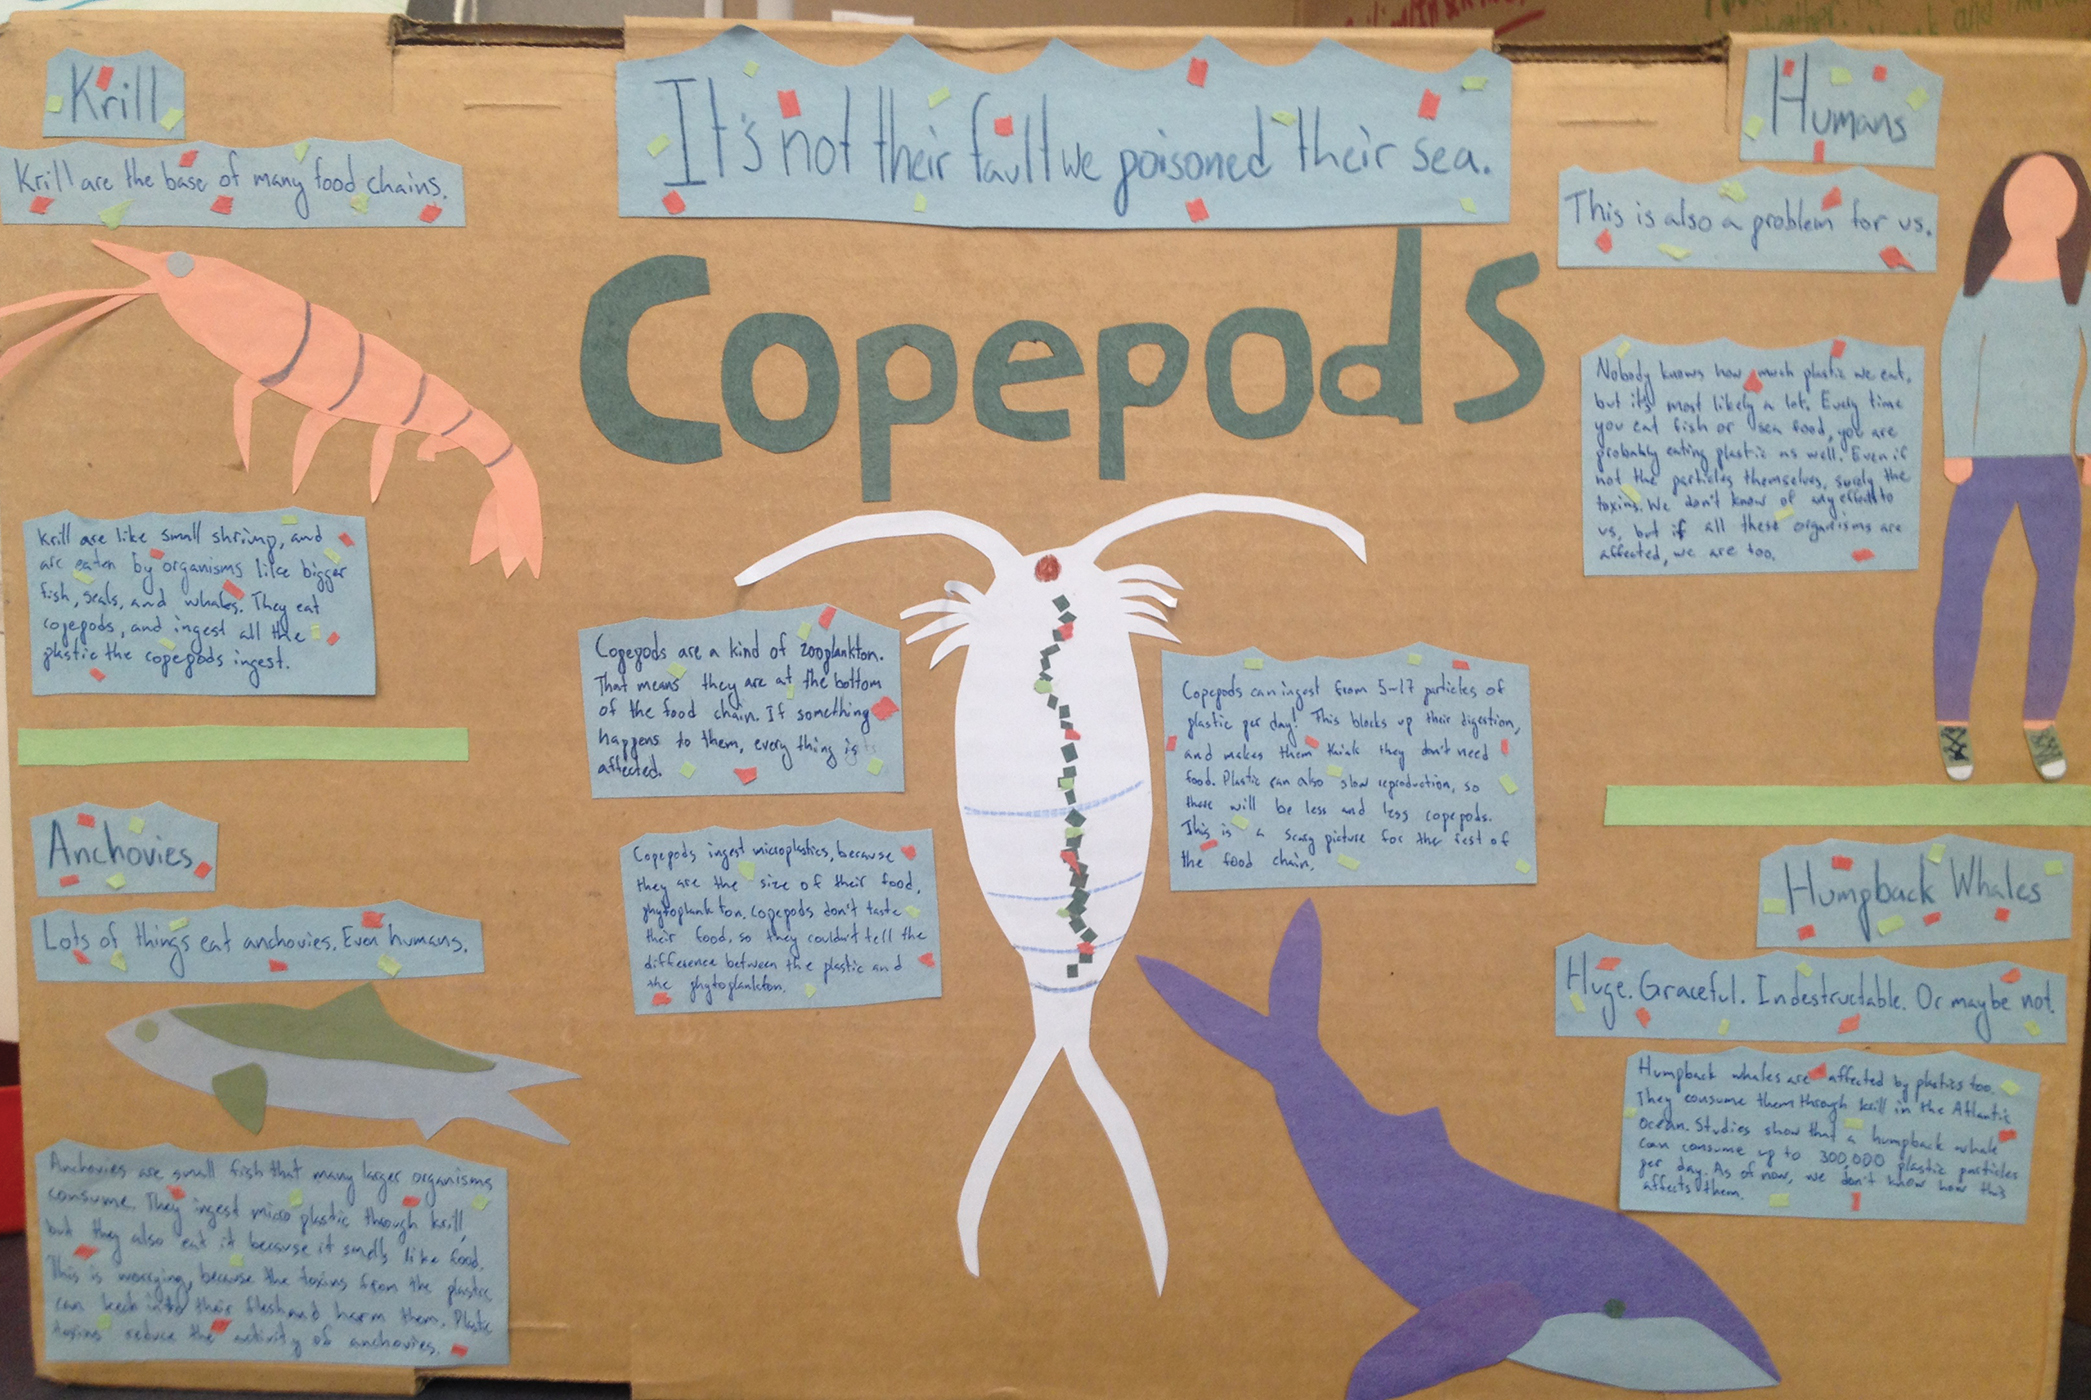
In middle school, the microplastic pollution investigation made solid connections with energy and matter in ecosystems. We looked at how food is metabolized and used for growth and energy and how plastic interrupts that process since the poisoning and disappearance of these organisms affects all higher trophic levels. Students were surprised by how many organisms are affected, so we created the project “Who Hurts the Most?” (see Online Supplemental Materials for handouts). This activity required students to determine how an organism is negatively affected by plastic biomagnification, and then trace that plastic back to the interface where it entered the living world through bioaccumulation. Students finally created a poster displaying that route (Figure 8).
In addition, WeatherBlur hosted a final summit to invite all participating schools to share their investigations through 91 cm × 122 cm (36 in. × 48 in.) digitally produced posters. At our school, we tackled this project in the platform of a contest, allowing small, heterogeneous groups of students to create posters, which included the title, research question, methods, materials, results, conclusions, and acknowledgements.
Connecting to the Next Generation Science Standards (NGSS Lead States 2013)
- The chart below makes one set of connections between the instruction outlined in this article and the <i/>. Other valid connections are likely; however, space restrictions prevent us from listing all possibilities.
- The materials, lessons, and activities outlined in the article are just one step toward reaching the performance expectation listed below.
Standard
MS-ESS3-4 Earth and Human Activity
Performance Expectation
MS-ESS3-4. Construct an argument supported by evidence for how increases in human population and per-capita consumption of natural resources impact Earth’s systems.