
Sustainable Forest Management
By Darrell Hendrickson and Marcia Goodrich
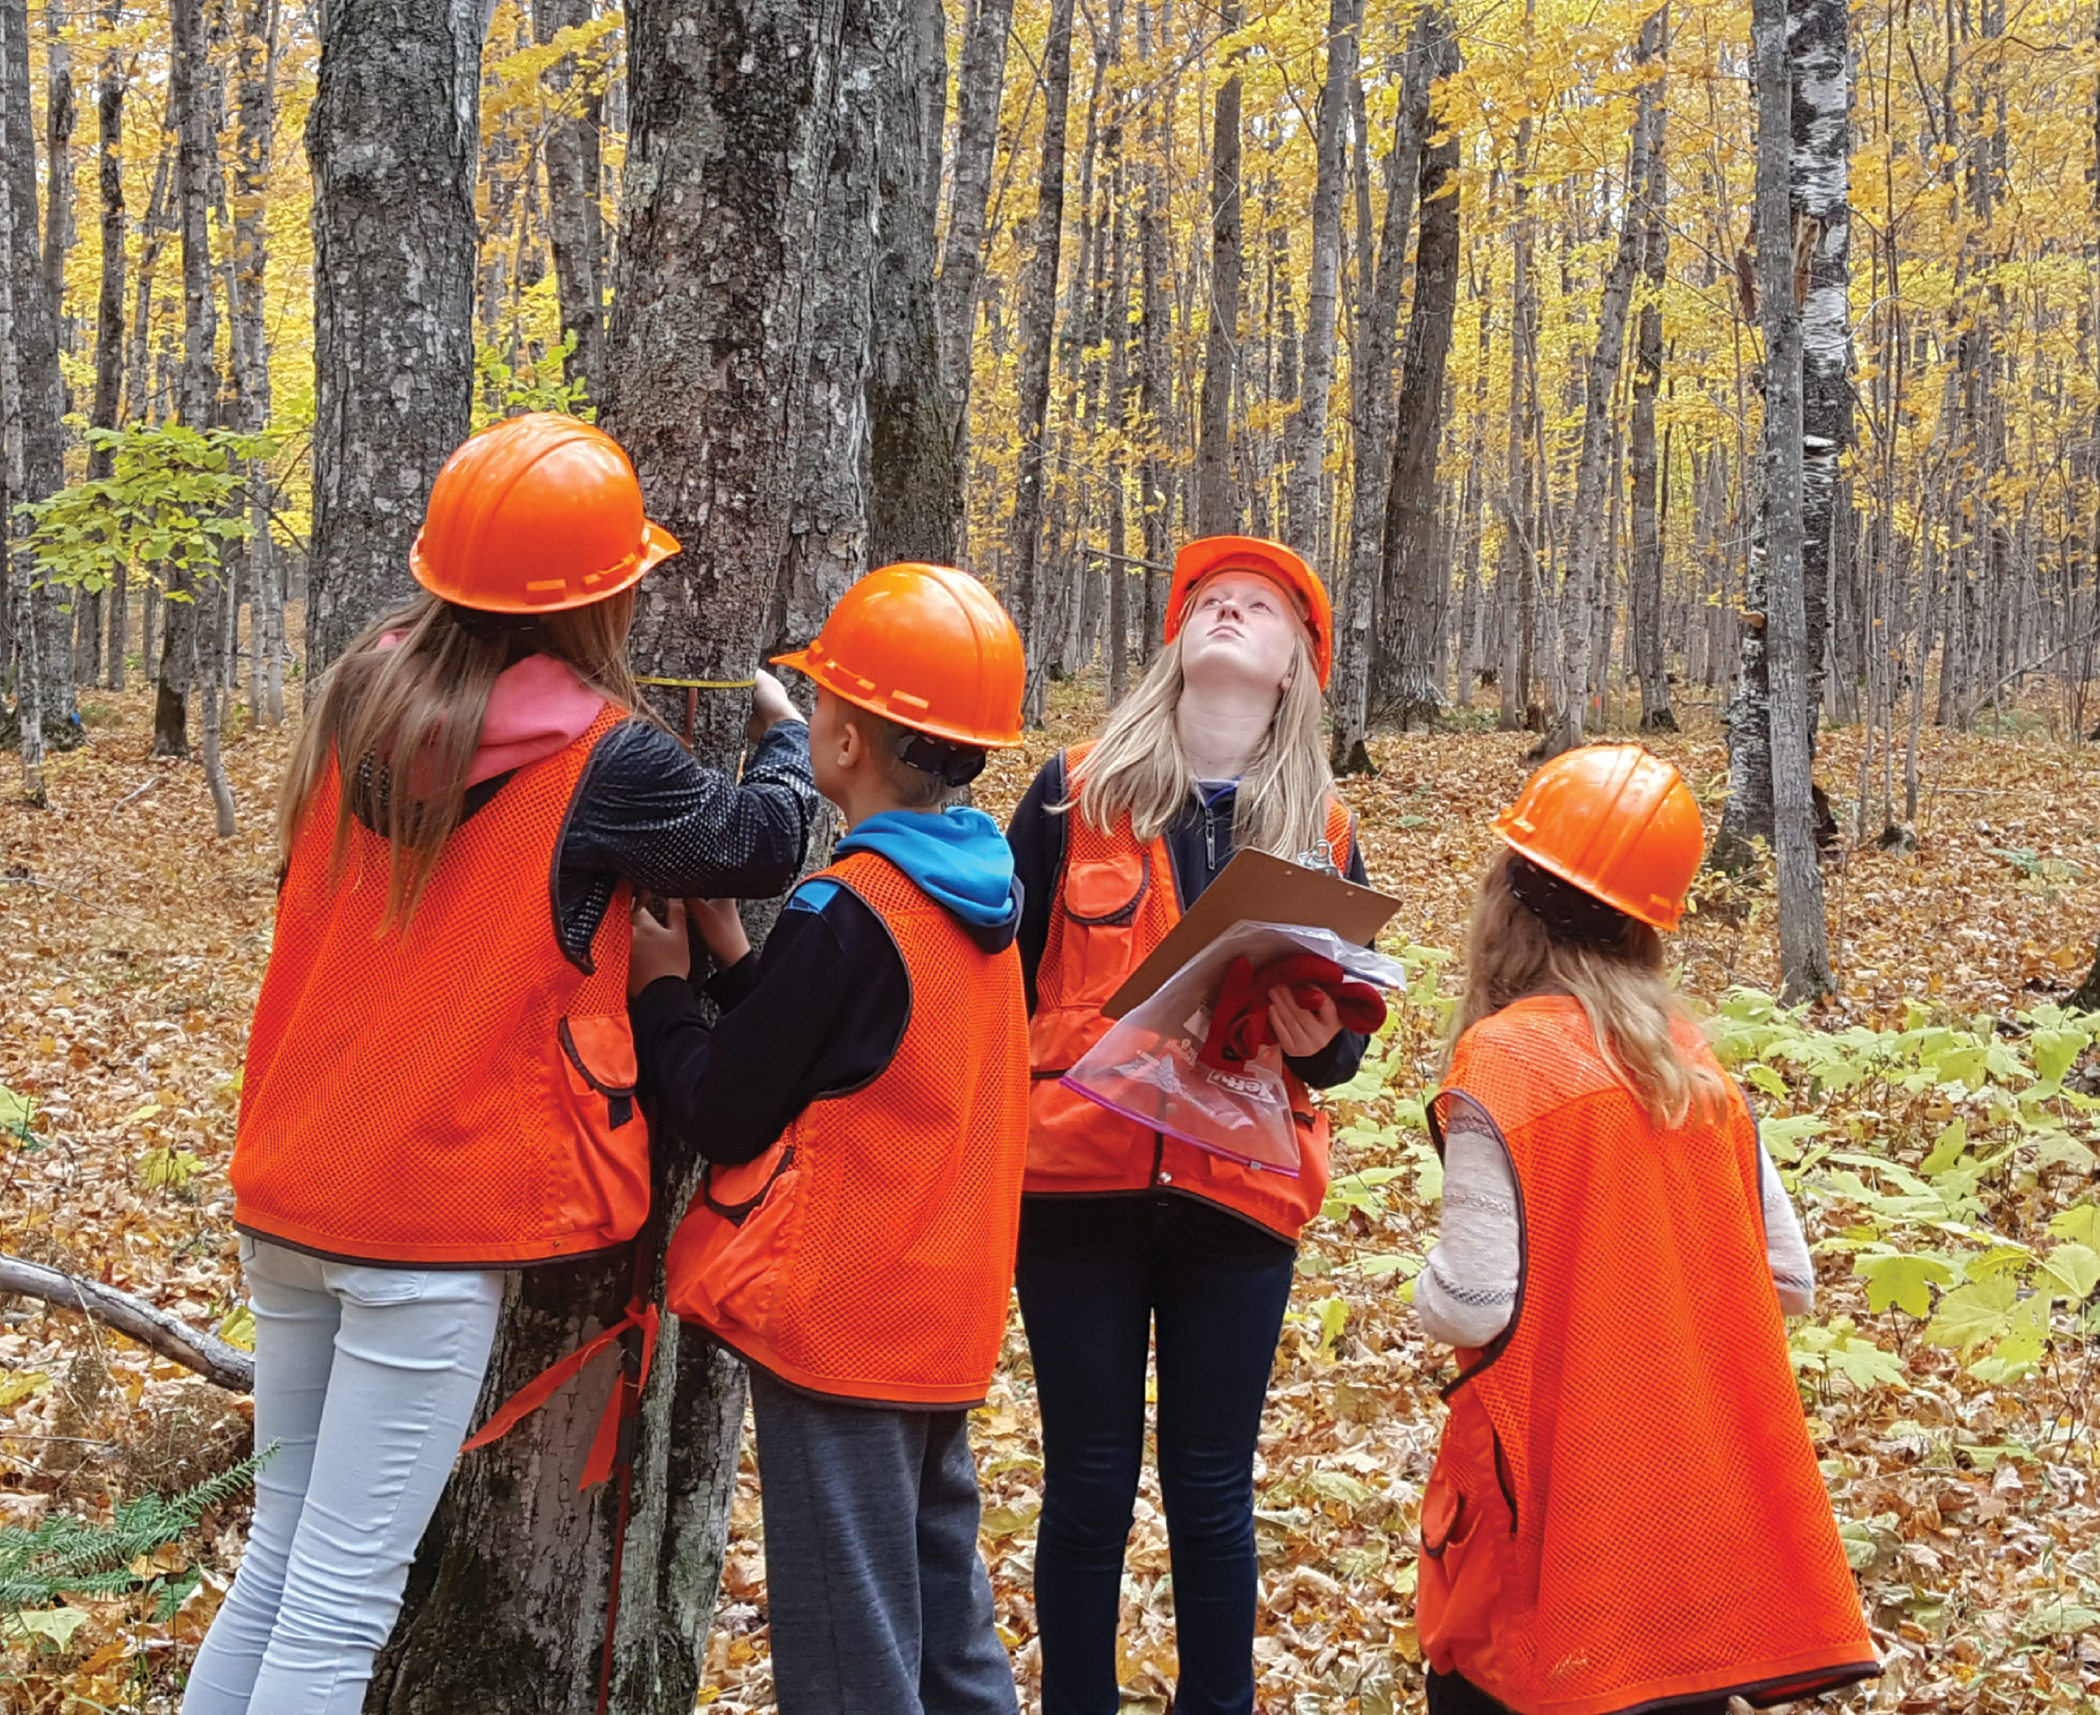
Students measure growth trends in the school woods.
Ultimately, students will determine when and how the sugar maples should be harvested using established management practices they learn in other lessons, which address wildlife, climate change, and silviculture (the growing and cultivation of trees). In the case of a sugar maple stand, the best approach is an uneven-aged management plan, which removes mature and undesired trees as the forest grows (Neumann 2015). When their 10 acres are ready to harvest, my students will present their findings to the governing boards of our township and school district. Everybody wins: The community and the schools get a great management plan, the sugar maple forest is managed sustainably, and the wildlife and watershed are protected. Most importantly, my students develop a deep understanding of how good management can yield a valuable crop of trees while protecting and even enhancing the ecosystem.
Certainly not every teacher has a community forest out the back door, but many do. According to the Michigan Department of Natural Resources, there are more than 250 school forests in Michigan alone, making this unit a realistic option for teachers throughout the nation. While we have an advantage—my bachelor’s degree is in forestry—teachers could recruit that expertise by partnering with forestry professionals from higher education, government agencies, or private land management firms. Furthermore, our unit is based on sampling and analysis techniques that can be applied to many different investigations involving change over time. For example, a variation could be used to analyze slug populations on school lawns at different times of the year or to conduct a census of monarch butterflies, perhaps linked to an effort to improve their habitat by planting milkweed.
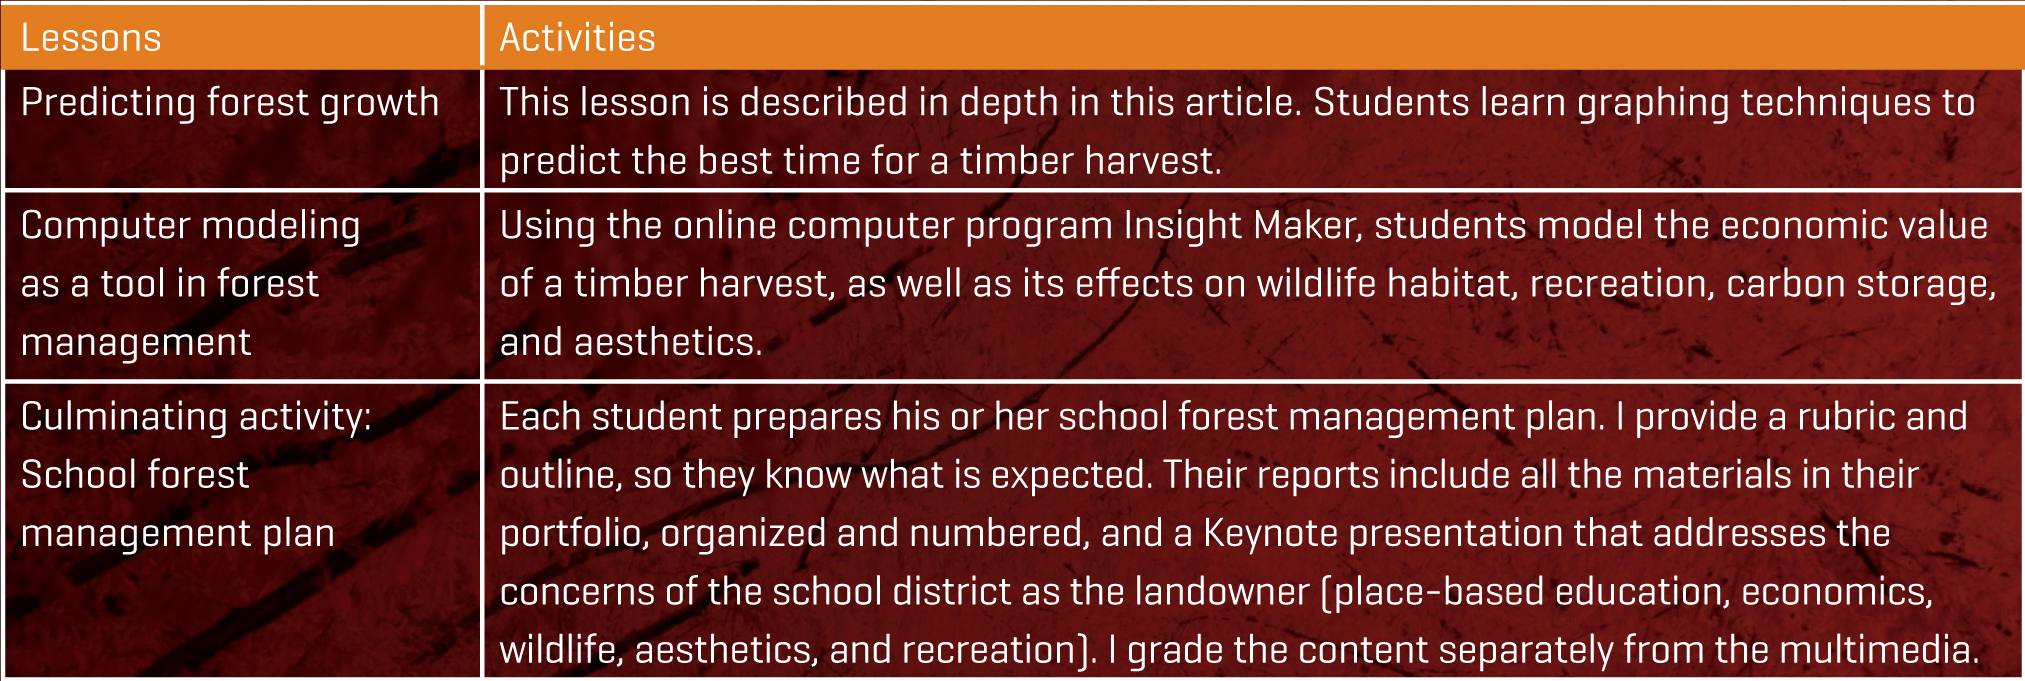
Lesson: Predicting forest growth
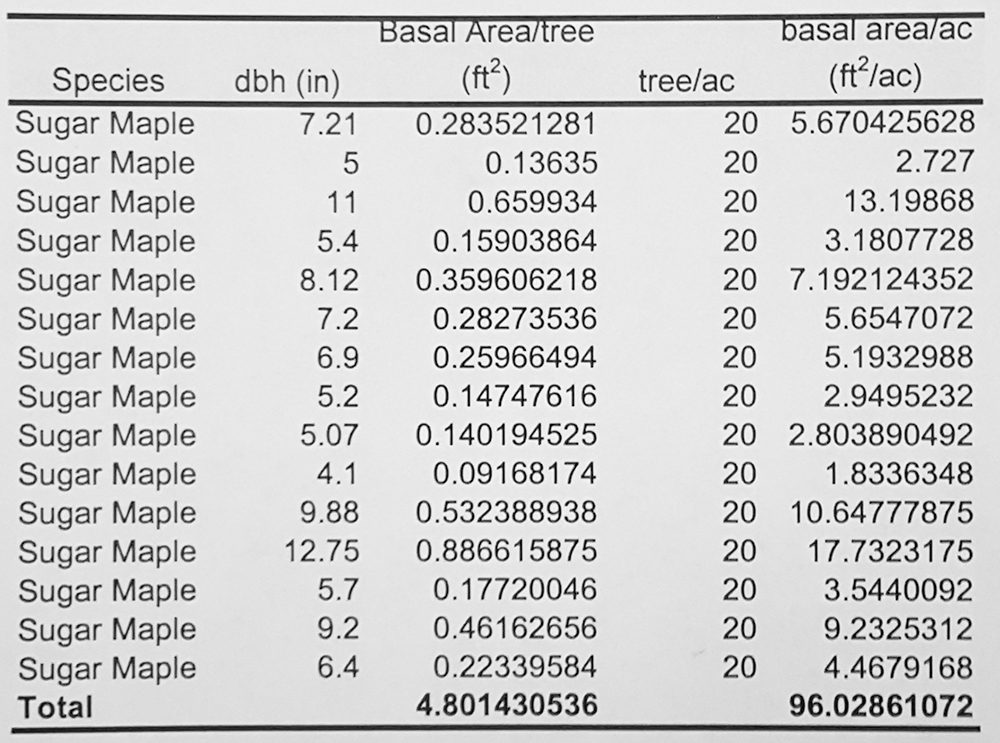
This lesson can be completed in two 55-minute class periods. It addresses the question “How will analyzing past and present data inform us about the future growth of our school forest?” To replicate this lesson, your students will have to gather their own tree- diameter data from plots in their school forest (I have my students sample 16 plots of 1/20th of an acre) and record the data in their portfolios. Then, after learning how to calculate basal area, they will convert their tree-diameter data to determine the basal area of their plots and then average their results to determine the basal area of all their plots together (Figure 3, Barlow and Elledge 2012). To calculate basal area for one tree, they will use the standard forestry formula: BA = 0.005454 * DBH, where DBH is diameter at breast height, or the tree’s diameter at 1.3 m (4.5 ft.) from the ground. Then they add the results of all the trees in their 1/20th-of-an-acre plots, and multiply by 20, which gives a per-acre basal area estimate.
I then bring students’ portfolios to their computer technology teacher. In their computer technology class, students input their basal area data into Excel spreadsheets, which are printed out and saved in their portfolios. The technology teacher notifies me when the students finish their spreadsheets, and I go to his classroom to collect the portfolios. Though the students do calculate the basal area of their entire woodlot, I do the same summary calculation myself, which is the number that my students use in the lesson. This minimizes the chance of error.
Day 1
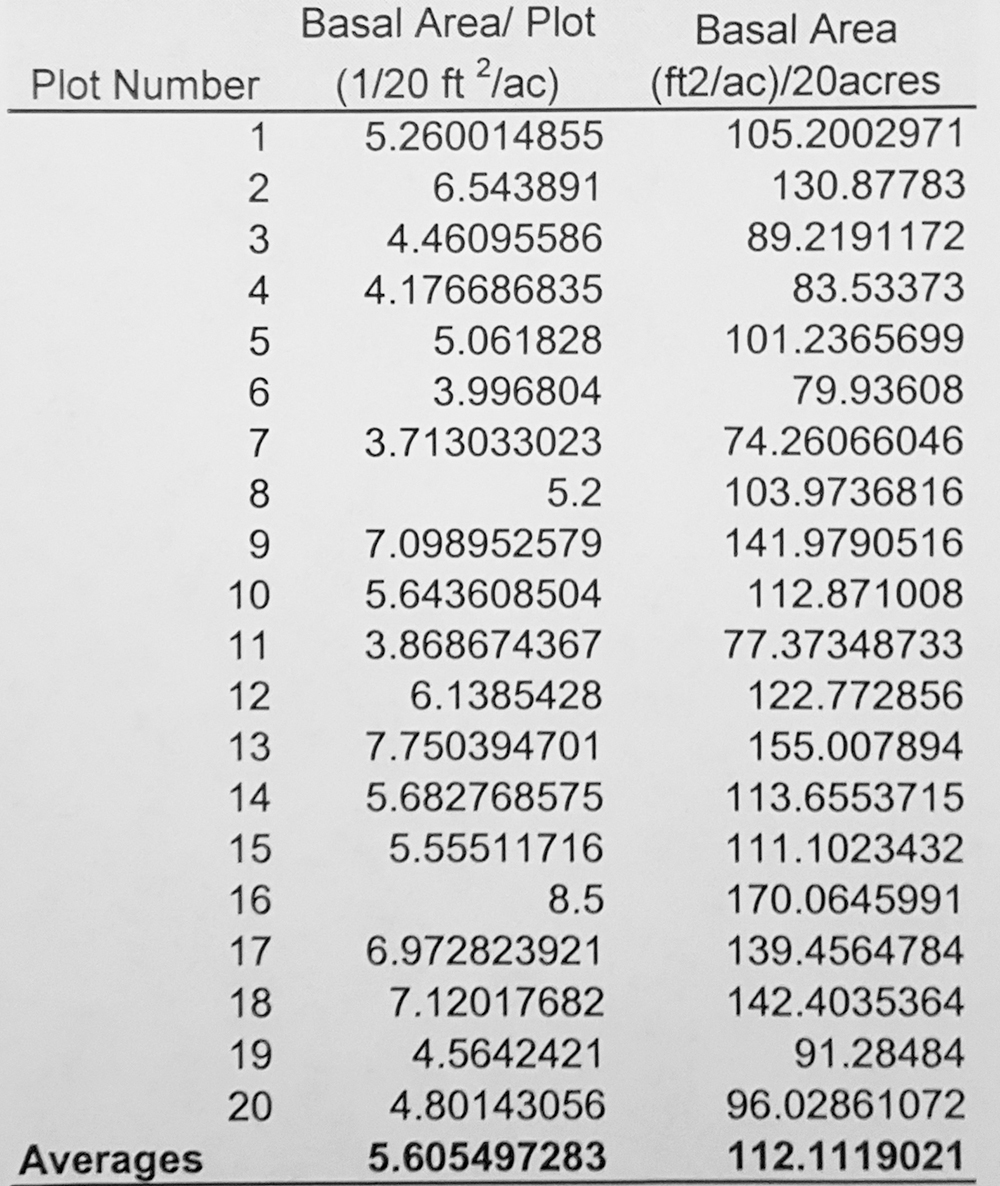
During the first day of this lesson, students will look at their data in depth and determine how they may be used to manage their school forest. I provide each student the average basal area of all their plots (Figure 4), which I have calculated; a worksheet for graphing school forest trends; and a think-pair-share worksheet (see Online Supplemental Materials). Then, I briefly review the definition of basal area (see Barlow and Elledge 2012) and the timber-harvesting methodology developed in previous lessons. For a sugar maple forest in the Great Lakes states, such as ours, this involves an uneven-aged harvest, which aims to create timber stands that have three or more age classes of trees occupying approximately equal areas (Leak and Snyder 2011).
The forest will be harvested when it reaches a basal area of 11 square meters (120 square feet) per acre, leaving a residual basal area of 8 square meters (90 square feet) per acre after harvest (Baughman 2011; Leak and Snyder 2011). Students already have a good grasp of these concepts, but I have found that this review provides a good foundation for the lesson.
Next, I have students bring out their think-pair-share worksheets and separate into table groups of two or three. I project the three think-pair-share questions on the Smartboard and read them one at a time, reminding students of what they already know and how that knowledge might be applied to answer the question. I tell students to write down their own answers and then discuss them with their table. I also tell students they can change their answers if they wish, based on their small-group discussion. The think-pair-share questions are listed below, with ideal answers in italics.
- How can we predict forest growth? <i>By measuring basal area over time</i>.
- How should we do this? <i>By graphing our forest’s basal area over time and observing the growth trend</i>. (I ask if there’s a way we could show this on paper.)
- How will tracking forest growth help our school district manage our school forest? <i>This will help our school district know the best time to harvest to accomplish its goal of maintaining our forest as a sugar maple stand</i>.
I go from table to table, looking at students’ progress and encouraging them. When the class is done with the activity, I ask for volunteers from each of the table groups to read their answers to the class and discuss. By the end of the lesson, all my students typically have a full understanding of how to present their data and what they can be used for. If I am done early, we review the handout of the class results and the worksheet for graphing school forest trends.
Day 2
Materials for each student
- graph paper
- 12-inch ruler
- one regular pencil
- one red pencil
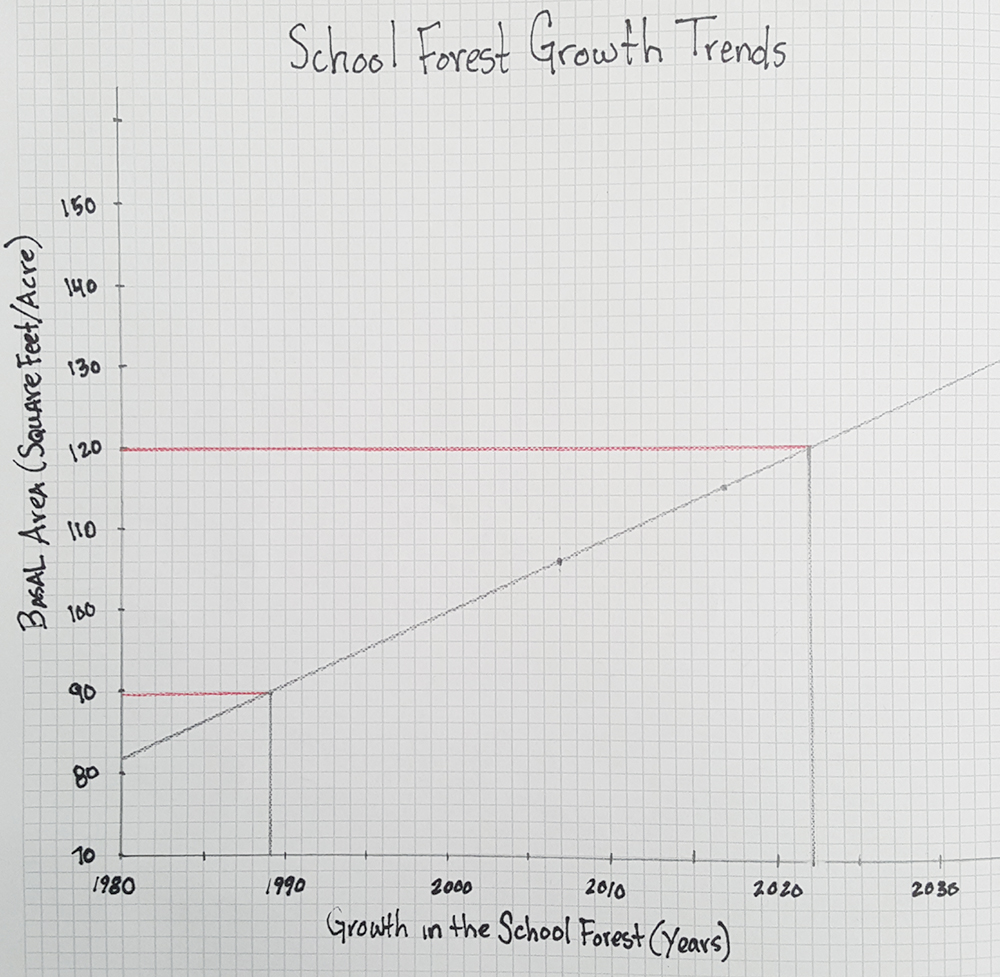
On Day 2, students create a line graph of the data (the basal area values from 2007 and 2016–17) to show how the forest’s basal area changes over time and use that information to predict when the forest should be harvested and to estimate its forest harvest cycle—that is, the optimal number of years between timber harvests. (For more information, see Online Supplemental Materials for the graphing worksheet.) Have students work in small groups of two or three, with the teacher providing guidance at the Smartboard.
I review each of the steps involved in developing a graph, and make sure students understand what the axes represent and how they should be labeled. Then, students draw their graphs (Figure 5), helping each other as needed while the teacher goes from table to table to guide each group. When it looks as though all table groups are done, I hand out the school forest summary questions worksheet (see Online Supplemental Materials). I project the questions on the Smartboard and review them one at a time. Then I turn the table groups loose to answer the questions. I walk around the room, giving extra support to any groups that are struggling.
School forest summary questions
- What year will the school forest be ready for harvest according to Great Lakes cutting recommendations? <i>2022</i>. What measure of growth in the forest will be used to determine this? <i>Basal area</i>
- What is residual basal area? <i>The basal area remaining after a timber harvest</i>. What is the recommended residual basal area for our school forest? <i>90 square feet per acre</i>
- What considerations should be taken when deciding the residual basal area? Hint: What species of tree do we want to manage (e.g., sugar maple, yellow birch, or red pine)? What growing conditions does this species prefer? (Note: This question draws on knowledge gained earlier in the unit, which addresses forest growth and succession. See <a class="fig" href="#SS_84_F2">Figure 2</a>.) <i>Some tree species, such as the sugar maple, like more shade. If we want to maintain our sugar maple forest, we need to consider this as we determine our residual basal area.</i>
- With your red pencil, plot the residual basal area for the school forest on your graph. <i>Students will draw a red line across their graph from 90</i> (<a class="fig" href="#SS_84_F5">Figure 5</a>). At what year was this last achieved? 1989. Based on your graph, estimate the length of a growth cycle for harvest. In other words, do the math to show the amount of time in years that the forest grew from a residual basal area of 90 square feet per acre to a harvest basal area of 120 square feet per acre. <i>2022 − 1989 = 33 years</i>
Critical thinking
- 5.
- Based on your results, after this harvest cycle, what year will the next harvest cycle end? Show your work. <i>2022 + 33 = 2055</i>.
Not all students will get the same results. Explain that this is due to differences in their graphing techniques and some variation is to be expected. Finally, I finish this activity by going through the questions one by one and asking for volunteers to tell the class their answers. If time runs out, we finish this activity at the start of class the next day.
Assessment
My students’ answers to the school forest summary questions are derived from a deep understanding of the graphing process. To make sure students master this lesson, I walk around the class as they complete their worksheet for graphing school forest trends. Overall, students should be able to: plot points correctly showing basal area for years 2007 and the current year (in this case, 2018); draw a straight line across the graph that intersects those two points; draw horizontal red lines from 90 and 120 on the y-axis (Basal Area) across the graph, creating two points where they intersect with the first line; draw vertical lines from those points to the x-axis (Growth in School Forest by Year); and use that information to predict when the forest should be harvested (approximately 2022) and estimate the time period between harvests.
Classroom management tips
Each student has a portfolio that includes all their handouts and work. I keep the portfolios in my room, and students pick them up on the way in and drop them off at the end of the period. If they take them out of the classroom, inevitably some students forget to bring their work to class. Whenever I ask students to take out any paperwork, I show students a copy of the specific handout at the front of the classroom so that students do not get confused.
During the graphing activity, I project a graph onto the Smartboard while I explain the various parts of the graph (the axes, numbering, etc.). This makes it easier for them to complete the activity correctly.
At the beginning of this unit, when students start their fieldwork in the school forest, I divide them into groups of five to eight, making sure each group has a mix of successful and struggling students. That has proven very important to this lesson and the unit’s success, from the time the groups gather data from their own plots in the field to the completion of their management plan. This group dynamic does more than keep students engaged. We have a lot of at-risk students in our school, and they have a higher-than-average absentee rate. I have observed that students who have missed class time are routinely and easily brought up to speed by their peers in their groups. That has taken a lot of pressure off of both me and the students.
In the lesson described in this article, I divide the class into smaller table groups so that each student has more opportunities to participate.
Adaptations
I have adapted this unit for students dealing with learning challenges. One of my students needed to use crutches to walk, for example, so I made sure this student’s plot was near the bus. The student was able to complete the field work without difficulty. Another student was quite disruptive in class; I had this student work with me in the field instead of assigning him to a team. This extra attention allowed him to progress without interfering with other students’ learning. Based on these experiences, the unit could be adapted for students with a variety of learning needs.
A note on safety in the woods
Before our field trips, which we take in October, I address a variety of safety issues, including dead trees and potential dead limbs, which can fall and cause injury. Students are trained to stay away from potentially harmful trees within their plots. They all wear safety headgear, and field trips are rescheduled if winds are high. I always supervise students during the field trips and sometimes have assistance from volunteers and paraprofessionals, especially if students have special needs. Furthermore, this is not my class’s first field trip, and my expectations are high, which is reflected in their behavior. Additional direction on preparing students for these trips can be found in the Resources, bearing in mind that safety concerns may vary greatly depending on when and where the field trip is taken.
Extension
This lesson is part of a series that teaches students to analyze field data and develop a management strategy for our school forest (see Resources). The unit also includes computer modeling, but I start with this lesson because it allows students to work with numbers, read tables, and graph data. With this pencil-and-paper foundation, the computer modeling lessons make more sense to students, since computer modeling involves abstract concepts and more-advanced analysis. We use Insight Maker (https://insightmaker.com), a free, web-based computer modeling program, to understand how a number of variables—tree growth (increase in basal area), habitat, forest economics, and climate—affect the forest ecosystem. This helps students develop a forest management plan that aligns with the school and township forest-management goals.
In these lessons, students import data to run model simulations that answer the management plan’s basic questions: 1.How does overall forest growth impact the habitat of organisms? 2.How does basal area affect long-term forest growth? 3.When should we harvest our forest? 4.Can climate change affect our decisions?
The culminating activity for the unit is a School Forest Management Plan that students create with Keynote on their iPads. This can also be created using PowerPoint or Google Slides. Assessment is based on a rubric (see Resources) that addresses the key recommendations in students’ management plans, which I give to the students, along with an outline of the requirements for the culminating activity. When the forest is ready to harvest, students will present their plan to the school and township boards. Until that time, the students’ culminating activities provide a snapshot of the forest’s current status in reference to all the management applications in the plan, including change in its basal area, implications for wildlife, and carbon storage. This is how a professional would evaluate a forested area.
Conclusion
After this lesson, students are able to generate a timeline for optimal harvests within their school forest using data they gather themselves. This guided investigation leads to deep understanding of abstract concepts, such as basal area, and brings real-world forest management practices to the classroom. My students often have trouble understanding mathematical concepts, and this lesson bridges the gap between the abstract and the concrete. Since I have started bringing my students into the school forest to learn these basic management techniques, a number of students have gone on to major in the environmental sciences, and they have told me that the same material they learned in seventh grade is covered in their college courses. Whatever their career choice, all students will gain an understanding of how forest management decisions are made, both for sustainable timber harvest and, in other lessons, for wildlife protection and climate change mitigation. This contributes to an ethic of stewardship for our valuable, sustainable, forest resources.