
Research and Teaching
Technology Meets Pedagogy: Comparing Classroom Response Systems
Technology Meets Pedagogy: Comparing Classroom Response Systems
By Andrew J. Petto
The author of this article explores the impact of different student response systems in successive years in a general education human biology course.
Student engagement in active learning in large lecture settings has long been recognized as a challenge, and there is a rich literature on approaches that promote this outcome (McClanahan & McClanahan, 2002). Earlier studies tended to focus on subjective student impressions, but more recent research examines the impact on mastery of learning outcomes. These include the relationship between class participation and content retention (Crossgrove & Curran, 2008), student reasoning (Knight, Wise, & Southard, 2013), cognition and affect (Hunsu, Adesope, & Bayly, 2016), and the mastery of basic disciplinary concepts (Shapiro et al., 2017).
The general consensus from the literature suggests three impacts on the college classroom. First, these student response systems (SRS) technologies are successful only to the extent that faculty make them an integral part of their pedagogy (Andrews, Leonard, Colgrove, & Kalinowski, 2011; Kolikat, Drane, & Calkins, 2010). Second, once the pedagogic adjustment to using SRS effectively is made, there should be no significant impact from the choice of SRS format (Gray, Owens, Liang, & Steer, 2012; Gray & Steer, 2012; Richardson, Dunn, McDonald, & Oprescu, 2015). And third, the students’ attitude toward and acceptance of the technology and the way it changes the classroom experience might affect the success of its implementation (Lennox Terrion & Aceti, 2012; Preszler, Dawe, Shuster, & Shuster, 2007; Richardson et al., 2015).
The chief question for instructors, then, is whether different SRS perform differently in the classroom and which, if any, is best suited for a particular classroom environment or instructional style. This study focuses on the relationship between engagement and SRS technologies and makes a comparison of three different SRS technologies in successive semesters of a nonmajors human biology course. We compare their impact on student success in the course and their relative performance on a uniform measure of student success.
The first suggestion that the different technologies might affect student outcomes differently arose serendipitously from analysis in a study of a new interface for student access to reading materials (Strawn, n.d.). That study analyzed variables expected to influence the final grades of students in a large-lecture Introduction to Human Anatomy and Physiology course (BIOSCI 202).
In the second semester of the study, the instructor replaced the previous SRS with a different system, based on issues of technical support and cost. In the final report from the study, we discovered an unexpected statistically significant difference of the impact on the final course grade of the student participation component in lecture (Table 1).
| Logistic regression of student characteristics on final course grade BIOSCI 202. | ||||||||||||||||||||
|---|---|---|---|---|---|---|---|---|---|---|---|---|---|---|---|---|---|---|---|---|
|
Because the course was taught by the same instructor, using the same assignments and course materials in both semesters, these results suggested that the choice of SRS technologies in other courses might show similar differences. We had retrospective data on a related course that had similarly changed only the SRS over three subsequent semesters that we could test for a similar effect.
The second course (BIOSCI 201, Human Structure and Function) is a 4-credit lecture course with a laboratory component focused on human anatomy and physiology. It is designed as a one-semester course for nonmajors that meets natural sciences general education requirements at the University of Wisconsin‒Milwaukee (UWM; ). This course is taught in the spring semester only, and from 2011‒2013 the course used three different SRS technologies in the lecture portion of the course; as with BIOSCI 202, these changes were made for reasons other than the expectation that there would be any significant differences in their impact on student performance. During this time, the course had the same instructor and used the same textbook, in-class materials, and course assignments. In spring 2011, students used Turning Point Anywhere (TPA; ) as the SRS. In spring 2012, they used eInstruction’s Classroom Performance System (CPS; ), and in spring 2013, they used Top Hat Monocle (THM; later Top Hat; ).
The SRS technologies in this course are mainly used in three ways: (a) as a way of introducing a modified Socratic method () for exploring issues of human biology; (b) as a way to help students connect content to underlying themes and concepts that define the discipline; and (c) as a way of supporting guided inquiry in analytic and computational approaches to contemporary problems in human biology. Content-based quizzing was a minor component of the use of these technologies.
In all three semesters, the scoring protocol for class participation remained the same. The score was divided into two parts. All students submitting any answer in class in response to a question or problem earned one-half the credit for that particular question. Students received the remainder of the credit for a correct answer and no additional credit for an incorrect answer. Thus, students who chose the correct answer on one half of the in-class questions earned 75% of the possible score on this component.
The main goal for this study was to compare the impact on student performance in the lecture portion of the course of the three different SRS technologies used in subsequent semesters. Using the information in Table 1, we examined specifically the impact of students’ in-class participation on the final lecture grade for the course related to the choice of SRS.
Data and methods
The data for this study came from the gradebook records of student performance on the lecture portion of the class. We excluded those students who did not complete the course, whether they officially unenrolled from the course or not. We calculated an adjusted lecture grade based on the components of the “lecture” component of the course grade, excluding the class-participation scores: 13 chapter quizzes (22.2% of adjusted lecture grade), two online exams (22.2% of adjusted lecture grade), and four short directed-inquiry assignments (55.6% of adjusted lecture grade).
The BIOSCI 201 data were examined retrospectively, after the data from Strawn (n.d.) showed that the choice of SRS may be an important variable in student performance. Because the original grant report by Strawn analyzed the impact of class participation using logistic regression, we repeated that procedure with the data from BIOSCI 201.
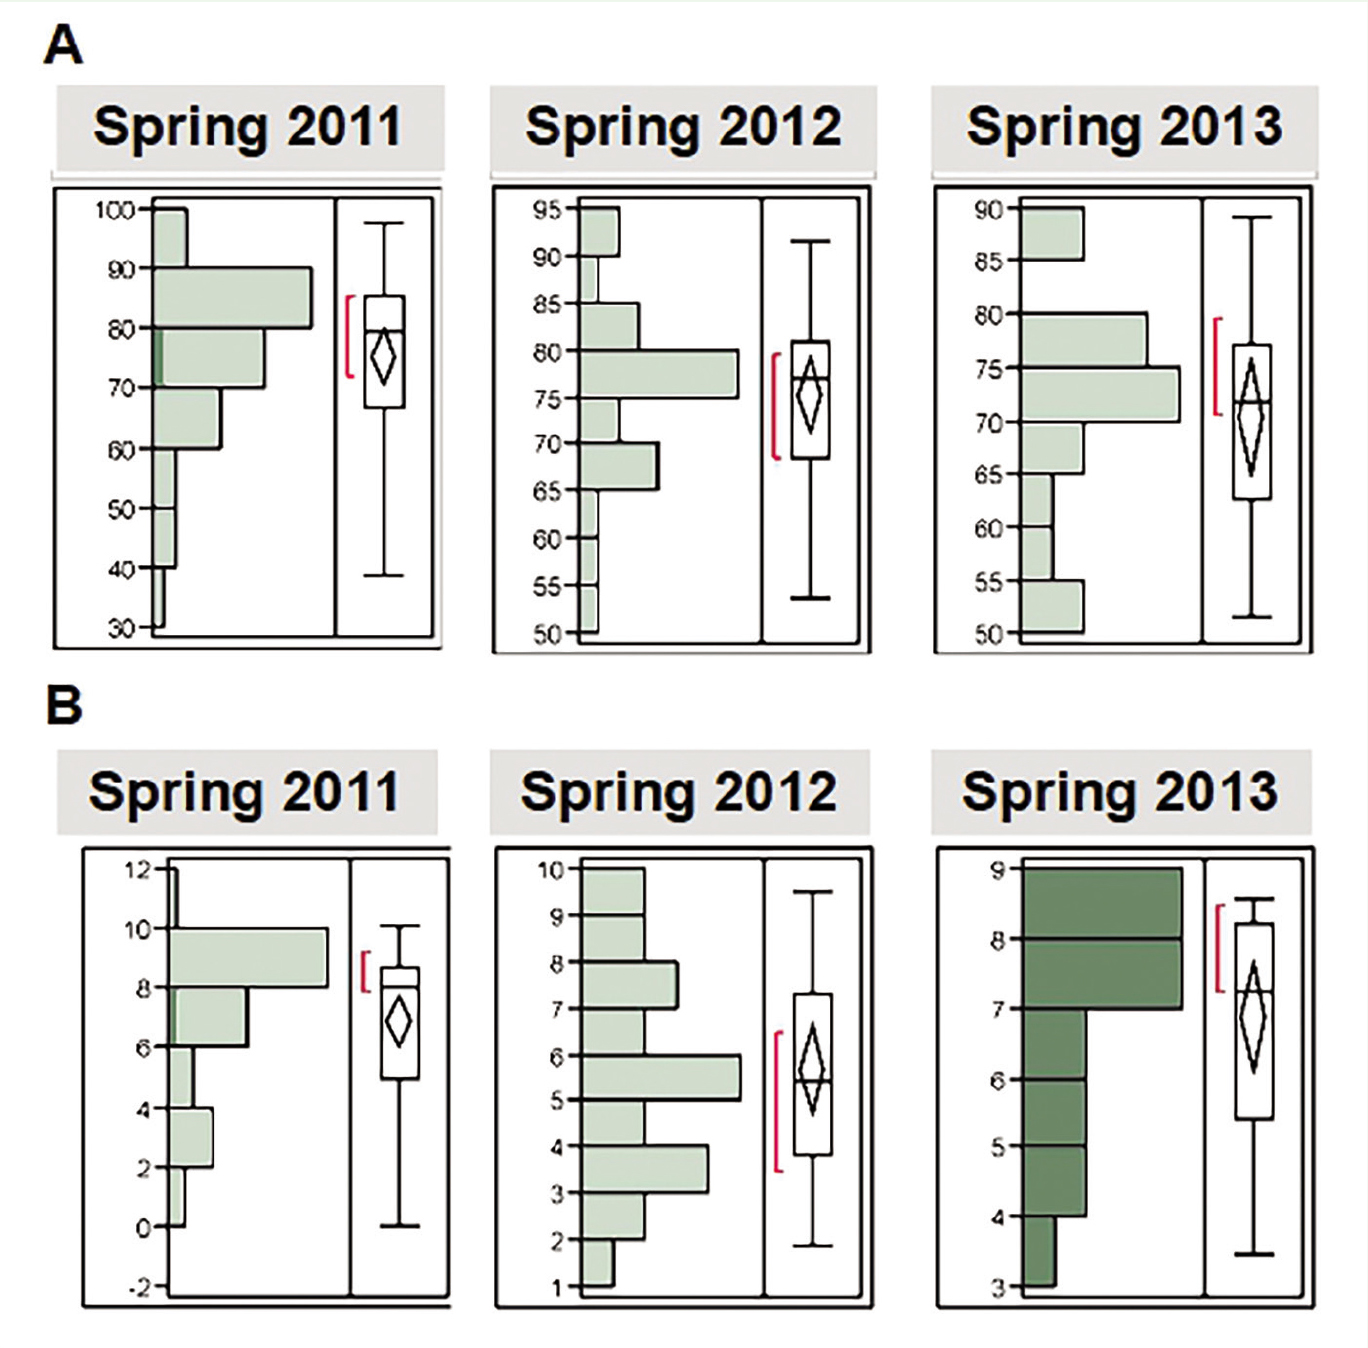
The main analysis here was to compare the odds ratios of the likelihood of attaining an adjusted lecture score of C (73%) or higher in the different semesters using the three different SRS options. We explored these outcomes at two levels of participation: (a) a minimal student use of the SRS in lecture—defined as a score at or above the 25th percentile of observed scores (Figure 1A); and (b) a moderately successful student use of the SRS in lecture—defined as a score at or above 73% of the maximum recorded score for class participation in each sample (Figure 1B). We first examined odds ratios for all semesters combined. Then we calculated the odds ratios of student success at the two levels of participation for each of the three successive semesters.
Because the different semesters had different enrolments, we tested for the effects of sample size discrepancies using bootstrapped data (repeated samples with replacement). The VassarStats website () allowed paired t-tests of differences in mean values among the semesters with equalized sample sizes (n = 1,000). We also used the bootstrapped data set to compare measures of statistical significance with those obtained from original data set.
Finally, we used Cohen’s d (Daniel, 2005) to calculate the effect size, and the Cochran-Mantel-Haenszel common odds ratio (Agresti, 1990) of conditional independence to test for the effects of confounding variables. In each case, the outcome of interest was the likelihood that a student would earn a C or higher in the adjusted lecture grade based on different levels of in-class participation via the SRS technology in use during that semester.
We created spreadsheet formulae to calculate all statistics but also confirmed the results using the online calculators at VassarStats ().
Results and analysis
The logistic regression confirmed the previous observations that using SRS to promote in-class engagement and participation has a significant impact on the students’ final grades. In the combined data from all three semesters, there was a statistically significant, positive association in the logistic regression between the level of participation in the in-class activities and the likelihood of passing the course with a grade of C or higher (R2 = 0.822; χ2 = 14.14; df = 1; p = .0002).
There was no statistically significant difference in the average adjusted lecture scores from any of the semesters using both the raw data and the bootstrapped data. The only observed difference came in the average for exam grades, which were lower in spring 2013 than in the other semesters.
Figures 1A and 1B show the distribution of scores for the two variables of chief interest: the class participation scores and the adjusted final semester scores. The box plots indicate the median, first and third quartiles and the extremes of the scores for each semester. Further detail is in Tables 2, 3, and 4, showing overall results for all semesters and a semester-by-semester comparison.
| Students earning a lecture grade of C or higher by participation (samples combined for BIOSCI 201). | |||||||||||||||||||||||||||||||
|---|---|---|---|---|---|---|---|---|---|---|---|---|---|---|---|---|---|---|---|---|---|---|---|---|---|---|---|---|---|---|---|
|
| Likelihood of students earning grade of C or higher by semester. Participation above 25th percentile. | ||||||||||||||||||||||||||||||||||||||||||||||||||||
|---|---|---|---|---|---|---|---|---|---|---|---|---|---|---|---|---|---|---|---|---|---|---|---|---|---|---|---|---|---|---|---|---|---|---|---|---|---|---|---|---|---|---|---|---|---|---|---|---|---|---|---|---|
|
| Likelihood of students earning grade of C or higher by semester. Participation scores at or above 73%. | |||||||||||||||||||||||||||||||||||||||||||||||||||||
|---|---|---|---|---|---|---|---|---|---|---|---|---|---|---|---|---|---|---|---|---|---|---|---|---|---|---|---|---|---|---|---|---|---|---|---|---|---|---|---|---|---|---|---|---|---|---|---|---|---|---|---|---|---|
|
| Pairwise comparisons of distributions of final course grades based on coefficients of variation. | ||||||||||||||||||||
|---|---|---|---|---|---|---|---|---|---|---|---|---|---|---|---|---|---|---|---|---|
|
| Pairwise comparisons of distributions of class participation scores based on coefficients of variation. | ||||||||||||||||||||
|---|---|---|---|---|---|---|---|---|---|---|---|---|---|---|---|---|---|---|---|---|
|
Table 2 shows that students in all semesters who participated minimally in the student-response component of the course (participation scores at or above the 25th percentile) were at least 2.7 times more likely to score a grade of C or higher in the lecture portion of the course compared with students with lower participation scores. Students who participated regularly (with scores at or above 73%) were more than five times more likely to earn a grade of C or higher in the lecture portion of the course. The effect-size value shows a strong influence of class participation on performance on the final course grade in all semesters and confirms the general expectation that the use of an SRS in a lecture course meaningfully improves student performance.
Comparisons of the semester-by-semester performance showed no statistically significant differences in the median lecture grades (Fisher’s exact test), mean class participation scores by semester (two-tailed t distribution), or the correlation coefficients between class participation scores and the adjusted lecture grade (two-tailed confidence interval for r). These results were the same for both the original, unequal samples by semester and for the bootstrapped samples of 1,000 cases each. Furthermore, the Cochran-Mantel-Haenszel test showed no statistically significant differences in potential influence of confounding variables among semesters for either of the cut points (25th percentile or minimum participation grade of 73%). This allowed us to proceed with the retrospective comparison without concern for unrecognized bias in the data.
The key finding in this study was that the role that class participation played in the final adjusted grade was significantly different in the three semesters in the study. A closer look at the results by semester shows that this impact varied (Tables 3A and 3B) by students’ engagement and participation. When students participate minimally (minimum score at the 25th percentile for the class), the difference in the likelihood of earning a C or higher in the lecture portion of the course was statistically significant for both spring 2011 and spring 2013 (Table 3A). The size of that difference is shown in the relative risk calculation (RR) in the right-most column.
Tables 3A and 3B also show that the impact on students’ performance among semesters, though always positive, does vary significantly. In Table 3A, we see that students with low-participation rates had the highest likelihood of attaining a C average in the course in the first year of the study (2011) using TPA. However, in the last year of the study (2013) using THM, it was the students with the most active class participation who were most likely to achieve the benchmark C grade. Low-participation students using TPA were almost twice as likely to earn a C as low-participation students using THM, and the inverse was true of high-participating students.
Finally, we returned to the results in Figure 1 to examine the apparent differences in the distributions of the class participation scores in the three samples. Pair-wise comparisons of the ratio of squared coefficients of variation (CV) from the bootstrapped data set (Donnelly & Kramer, 1999) confirmed that the CV ratios for 2011 and 2013 were significantly different compared with the 2012 sample and all samples combined.
For the class-participation grades, the CV-ratio analysis confirms the impression from Figure 1B. There was a statistically significant difference between the more uniform distribution of scores in spring 2012 and the more clustered ranges for both spring 2011 and spring 2013, indicating that there was a higher and more consistent level of participation in these two semesters than for spring 2012.
Results of all the analyses show consistently that although all the SRS technologies enhanced student success in the lecture component of the course, they contributed differently to this enhanced success.
Discussion and implications
These results support the general expectation that any SRS technology improves both student engagement and student success (e.g., Sevian & Robinson, 2011). Results reported by Crossgrove and Curran (2008) may be most relevant to this study, because they reported that SRS technologies improved both exam performance and recall of course content 4 months later (more among nonmajors than majors)—at least for the content that students engaged in class using these technologies.
However, these data show that the three systems differed in their impact on the likelihood of student success in the course. Earlier studies by Andrews et al. (2011), Brickman (2006), and Sutherlin, Sutherlin, and Akpanudo (2013) concluded that the effectiveness of these technologies is enhanced when they are fully integrated into instruction, rather than being “tacked on” merely as a way to review information presented in the lecture. In this course, the SRS technologies were all integrated into the course and aligned with the course objectives in the ways that the systems’ capabilities allowed.
In this course for general education students, the learning objectives focused on understanding human biology as it applies to contemporary issues. The final adjusted lecture grade (and the final course grade) depended more on students’ use of biologic information to solve problems in each of the four instructional units than on specific recall of content in weekly quizzes or the midterm and final exams. This was the approach emphasized in the textbook, and practicing the skills needed to solve these problems was the focus of class participation in the lecture portion of the course.
Our measure of student success in the course is the combination of recall (44.4% of the adjusted lecture grade) and problem-solving assessments (55.6% of the adjusted lecture grade), and the results here show how increased participation in the three different SRS technologies performed in the context of their use in a modified Socratic method that uses content questions to check basic knowledge and essential questions drawn from contemporary issues in human biology to focus the discussion on relevant aspects of the course: nutrition and energy, fitness, body proportions, and human evolution and the life cycle.
So, the salient question is how these three technologies differed in the opportunities that they offer the instructor to integrate classroom practice and to realize the course’s learning objectives. Some of the difference lay in the technologic capabilities of the systems. When used in 2011, TPA only allowed students to respond with a single character, thus all the questions had to be in the form of a multiple-choice selection. In contrast, both eInstruction (CPS) and Top Hat (THM) allowed instructors to ask more open-ended questions that called for numeric or text answers, and the number of characters in the response was not limited. These formats required students to formulate their own answers, rather than simply match one of the choices displayed in the class. THM also provided the opportunity for the instructor to format the questions as sorting, matching, multiselect, or “click-on-target” (which allows students to indicate a location on an image).
Furthermore, because of the ways in which users are identified, both CPS and THM allowed the instructor ease and flexibility to designate some questions to be answered in collaborative groups. In these questions, students benefited from discussions and peer feedback in contrast with responses in the TPA semester (2011), all of which were individual.
Recent research has suggested why these features might have affected the likelihood of students’ success. Sevian and Robinson (2011), for example—though clearly convinced that SRS technologies enhance student learning—called for instructors to engage in “planning the use of clickers in ways that promote learning” (p. 18) and to evaluate why SRS technologies produce positive student outcomes. Elicker and McConnell (2011) also clearly showed that successful integration of in-class questions with fundamental course concepts improves student performance regardless of the choice of technology.
Knight et al. (2013) and Kolikat et al. (2010) showed how the integration of SRS technologies into classroom practice can have a significant effect on students’ comprehension and ability to use course information in higher order problem solving. The attention to this integration is what Kolikat et al. (2010) identified as the main reason that SRS technologies can improve student learning. It was not the technologies per se, but their pedagogic integration into the course that produced the improvement in student performance, which we take as a sign of successful student learning.
What stands out in this study is not so much the differences in the technologies (these, after all, continue to evolve), but the need to evaluate the ways in which they can be used to shape classroom practice so as to enhance student success (Lopez, Love, & Watters, 2014). In this study, the different ways that the technologies allowed the instructor to pose questions, the different ways in which students could develop and format answers, and the ability to engage students in collaborations in solving in-class problems stand out as the main distinctions among the three SRS technologies.
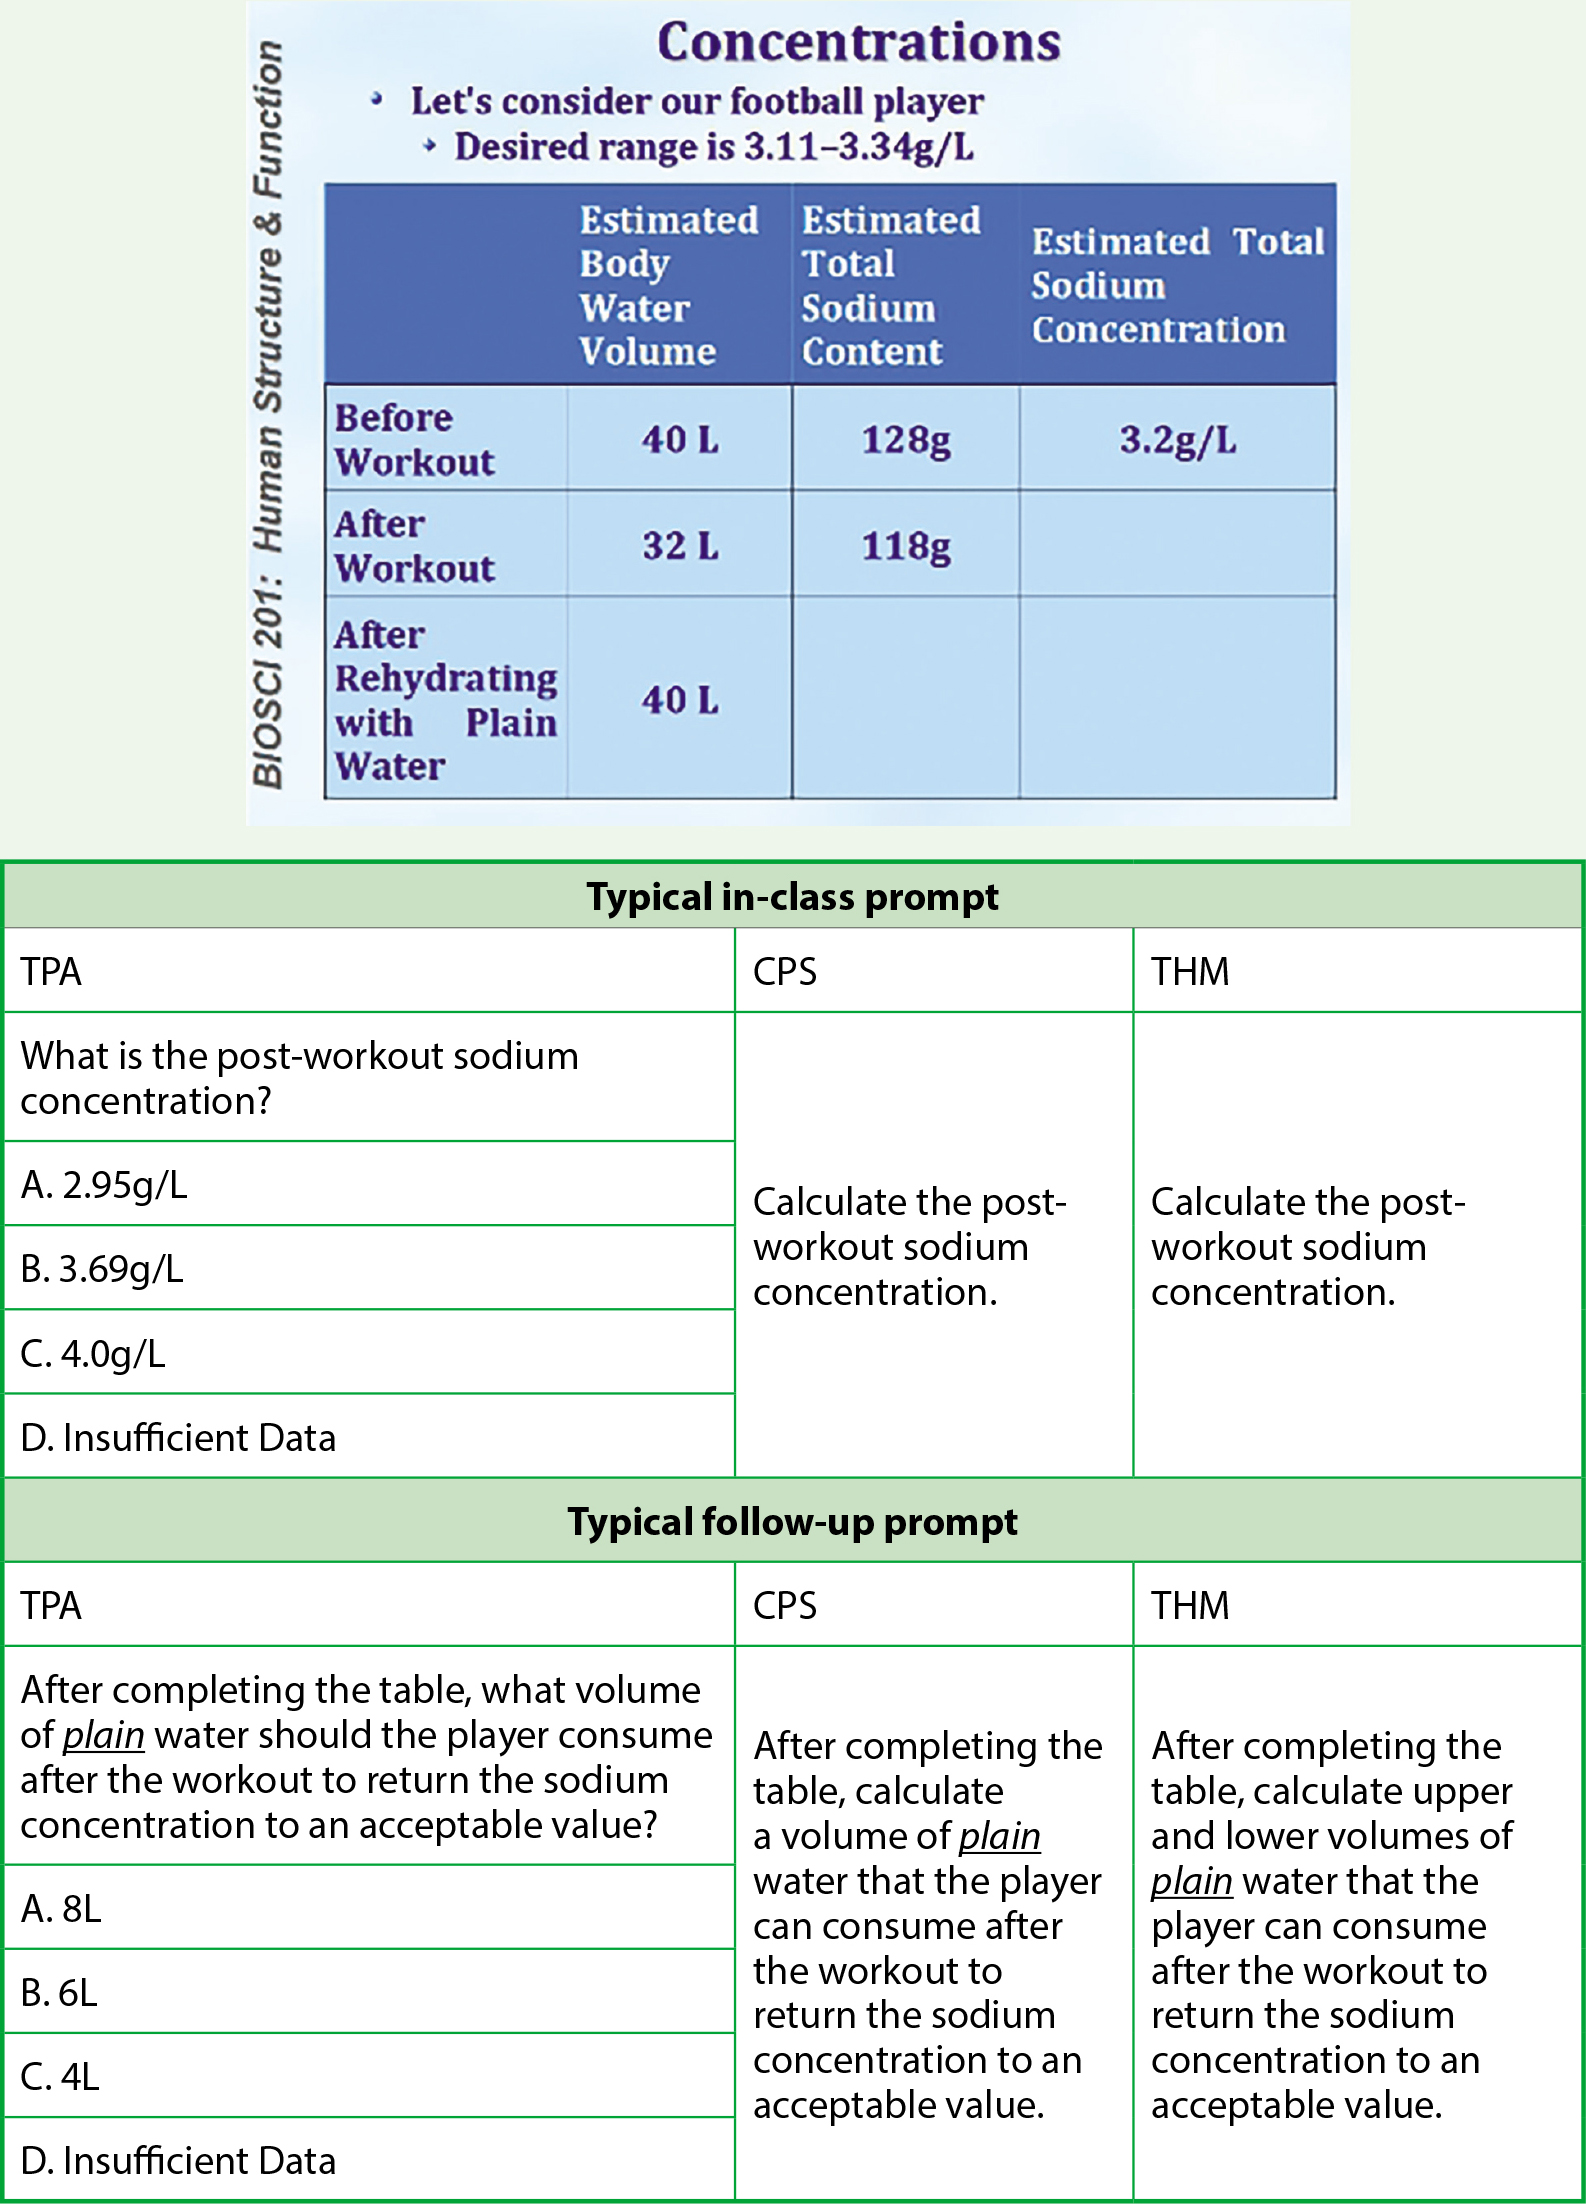
Figure 2 shows an example of prompts used with in-class problems and the modifications used in the three SRS technologies. The main content remains the same: the relationship between the volume of a solvent and the mass of the solute in determining the concentration of a solution in the context of the target range of concentrations acceptable for normal human physiologic functioning. The multiple-choice questions (TPA) allow the instructor to query the content questions only. The open-ended formats (CPS and THM) first require students to make an appropriate calculation and then to make a judgment on options to return the concentrations to within an acceptable range. Later, we were able to apply the same questions to a “sports” drink (such as Gatorade or Powerade) and to the World Health Organization’s emergency field rehydration solution (WHO Juice), all of which have other solutes beside the sodium chloride in salt.
In the end, we experienced not only a difference in the ways that students were able to engage the material in class, but also in the way that the instructor was able to shape the classroom experience (e.g., Monk, Campbell, & Smala, 2013).
Although all three SRS systems were used extensively over the course of the semester (often six or more question sets per lecture), the differences in their impact on students’ final adjusted lecture grades varied significantly when used as intended in the course: to promote a modified Socratic method, to help students connect content to underlying themes and concepts that define the discipline, and to support guided inquiry in analytic and computational approaches to contemporary problems in human biology. This study points to the importance of aligning the intended use of the SRS technologies and the learning outcomes to be assessed in the course when considering the relative effectiveness of technologic options.