
The War Over Water Continues
By Amy Gilbert and Abigail Turner-Nesmith
Debates over water allocation help students understand Earth systems.
Wars between nations have been waged over the availability of water for thousands of years. Locally, a tri-state (Alabama, Georgia, Florida) war over allocation of water from two major river basins has been the focus of countless attorneys, members of the U.S. Army Corps of Engineers, environmentalists, and politicians since the 1980s. Our students live in Smyrna, Georgia, an upstream metro area at the heart of this war. The U.S. Supreme Court decision in June 2018 to extend deadlines based on requests for additional fact finding and new lawsuits filed by the Cobb County-Marietta Water Authority and others resulted in our local water war becoming a highly relevant socio-scientific Earth systems learning cycle for our sixth-grade students.
Quality curriculum can be found to support a learning cycle centered on water wars. Our intent was to compile many of these tried-and-true approaches to purposefully include modeling of our specific, local phenomena. We thought it was important for our students to realize how our granite geology results in limited groundwater and a greater dependence on surface water. We also believed our students needed an opportunity to explore the river basins and human engineering that currently provide water for our booming metro area. Our students were engaged in the water availability issues of today, explored causes and effects at an Earth systems level, and then elaborated on how their new thinking and realizations would impact their personal actions moving forward.
Engage
Upon entering class, the following questions were projected on a screen with the expectation that students record their thoughts in their interactive notebooks.
- How much of Earth do you think is covered in water?
- Do you think water is a limited (scarce) resource? Explain your thinking.
After time for individual thinking and writing, students engaged in partner discussion about their responses. Whole-group discussion then followed, where students shared their ideas and rationales. As anticipated, most students considered water a readily available resource, citing examples of how they get and use water on a daily basis. “Water is everywhere. We buy it in bottles, gallons, turn the faucet, take showers, laundry, all the things with water.” Part of the discussion also highlighted students’ awareness that water covers 70% of Earth. If this had not been brought up by our students, it was in the plans to facilitate a modeling exercise to bring student awareness of the numerical values (e.g., toss around an inflated Earth ball, tally the number of times the left thumb lands on water versus land). However, because our students were aware of this relationship, we transitioned into the second portion of the Engage phase: highlighting specific water sources for our region.
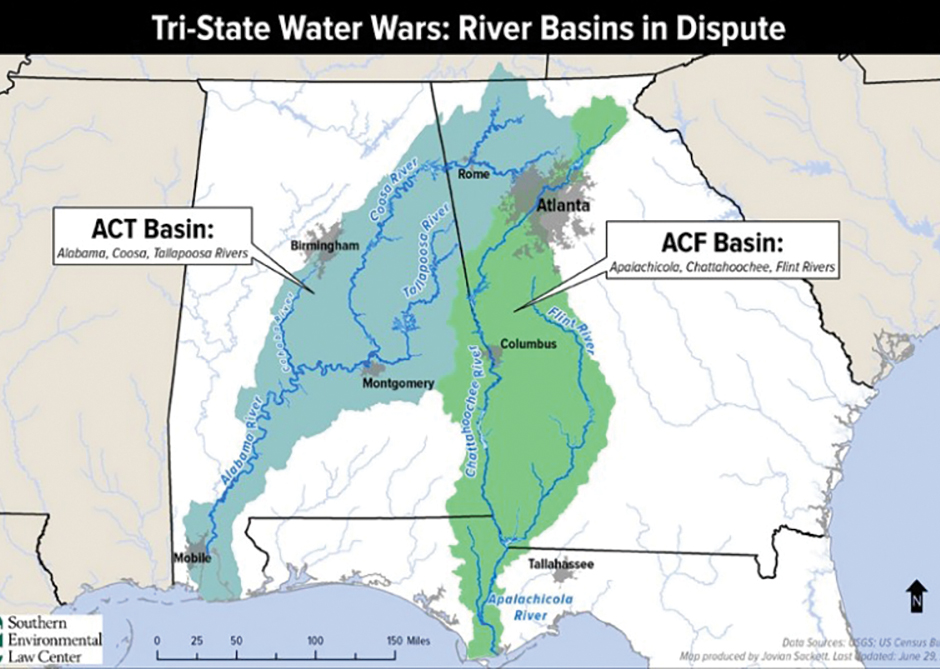
In this portion of the lesson, students were presented with a series of five global maps pinpointing areas of water disputes over the centuries and asked, “What do you think the dots might represent?” (data were retrieved from www.worldwater.org; see Resources). The data were shown from a global to local scale, ending with pinpoints of our region followed by a river basin map of our region. Students were then given a minute of quiet time to process the information presented on each of the models. We found several options for river basin maps through Creative Commons (see Resources). These maps ranged from outlining the creeks and rivers in each of the three states to more complex models that labeled the locations of dams and surrounding cities. One interactive map found through the U.S. Army Corps of Engineers also allowed us to click on a dam to get a graph of lake levels with a forecast (see Resources).
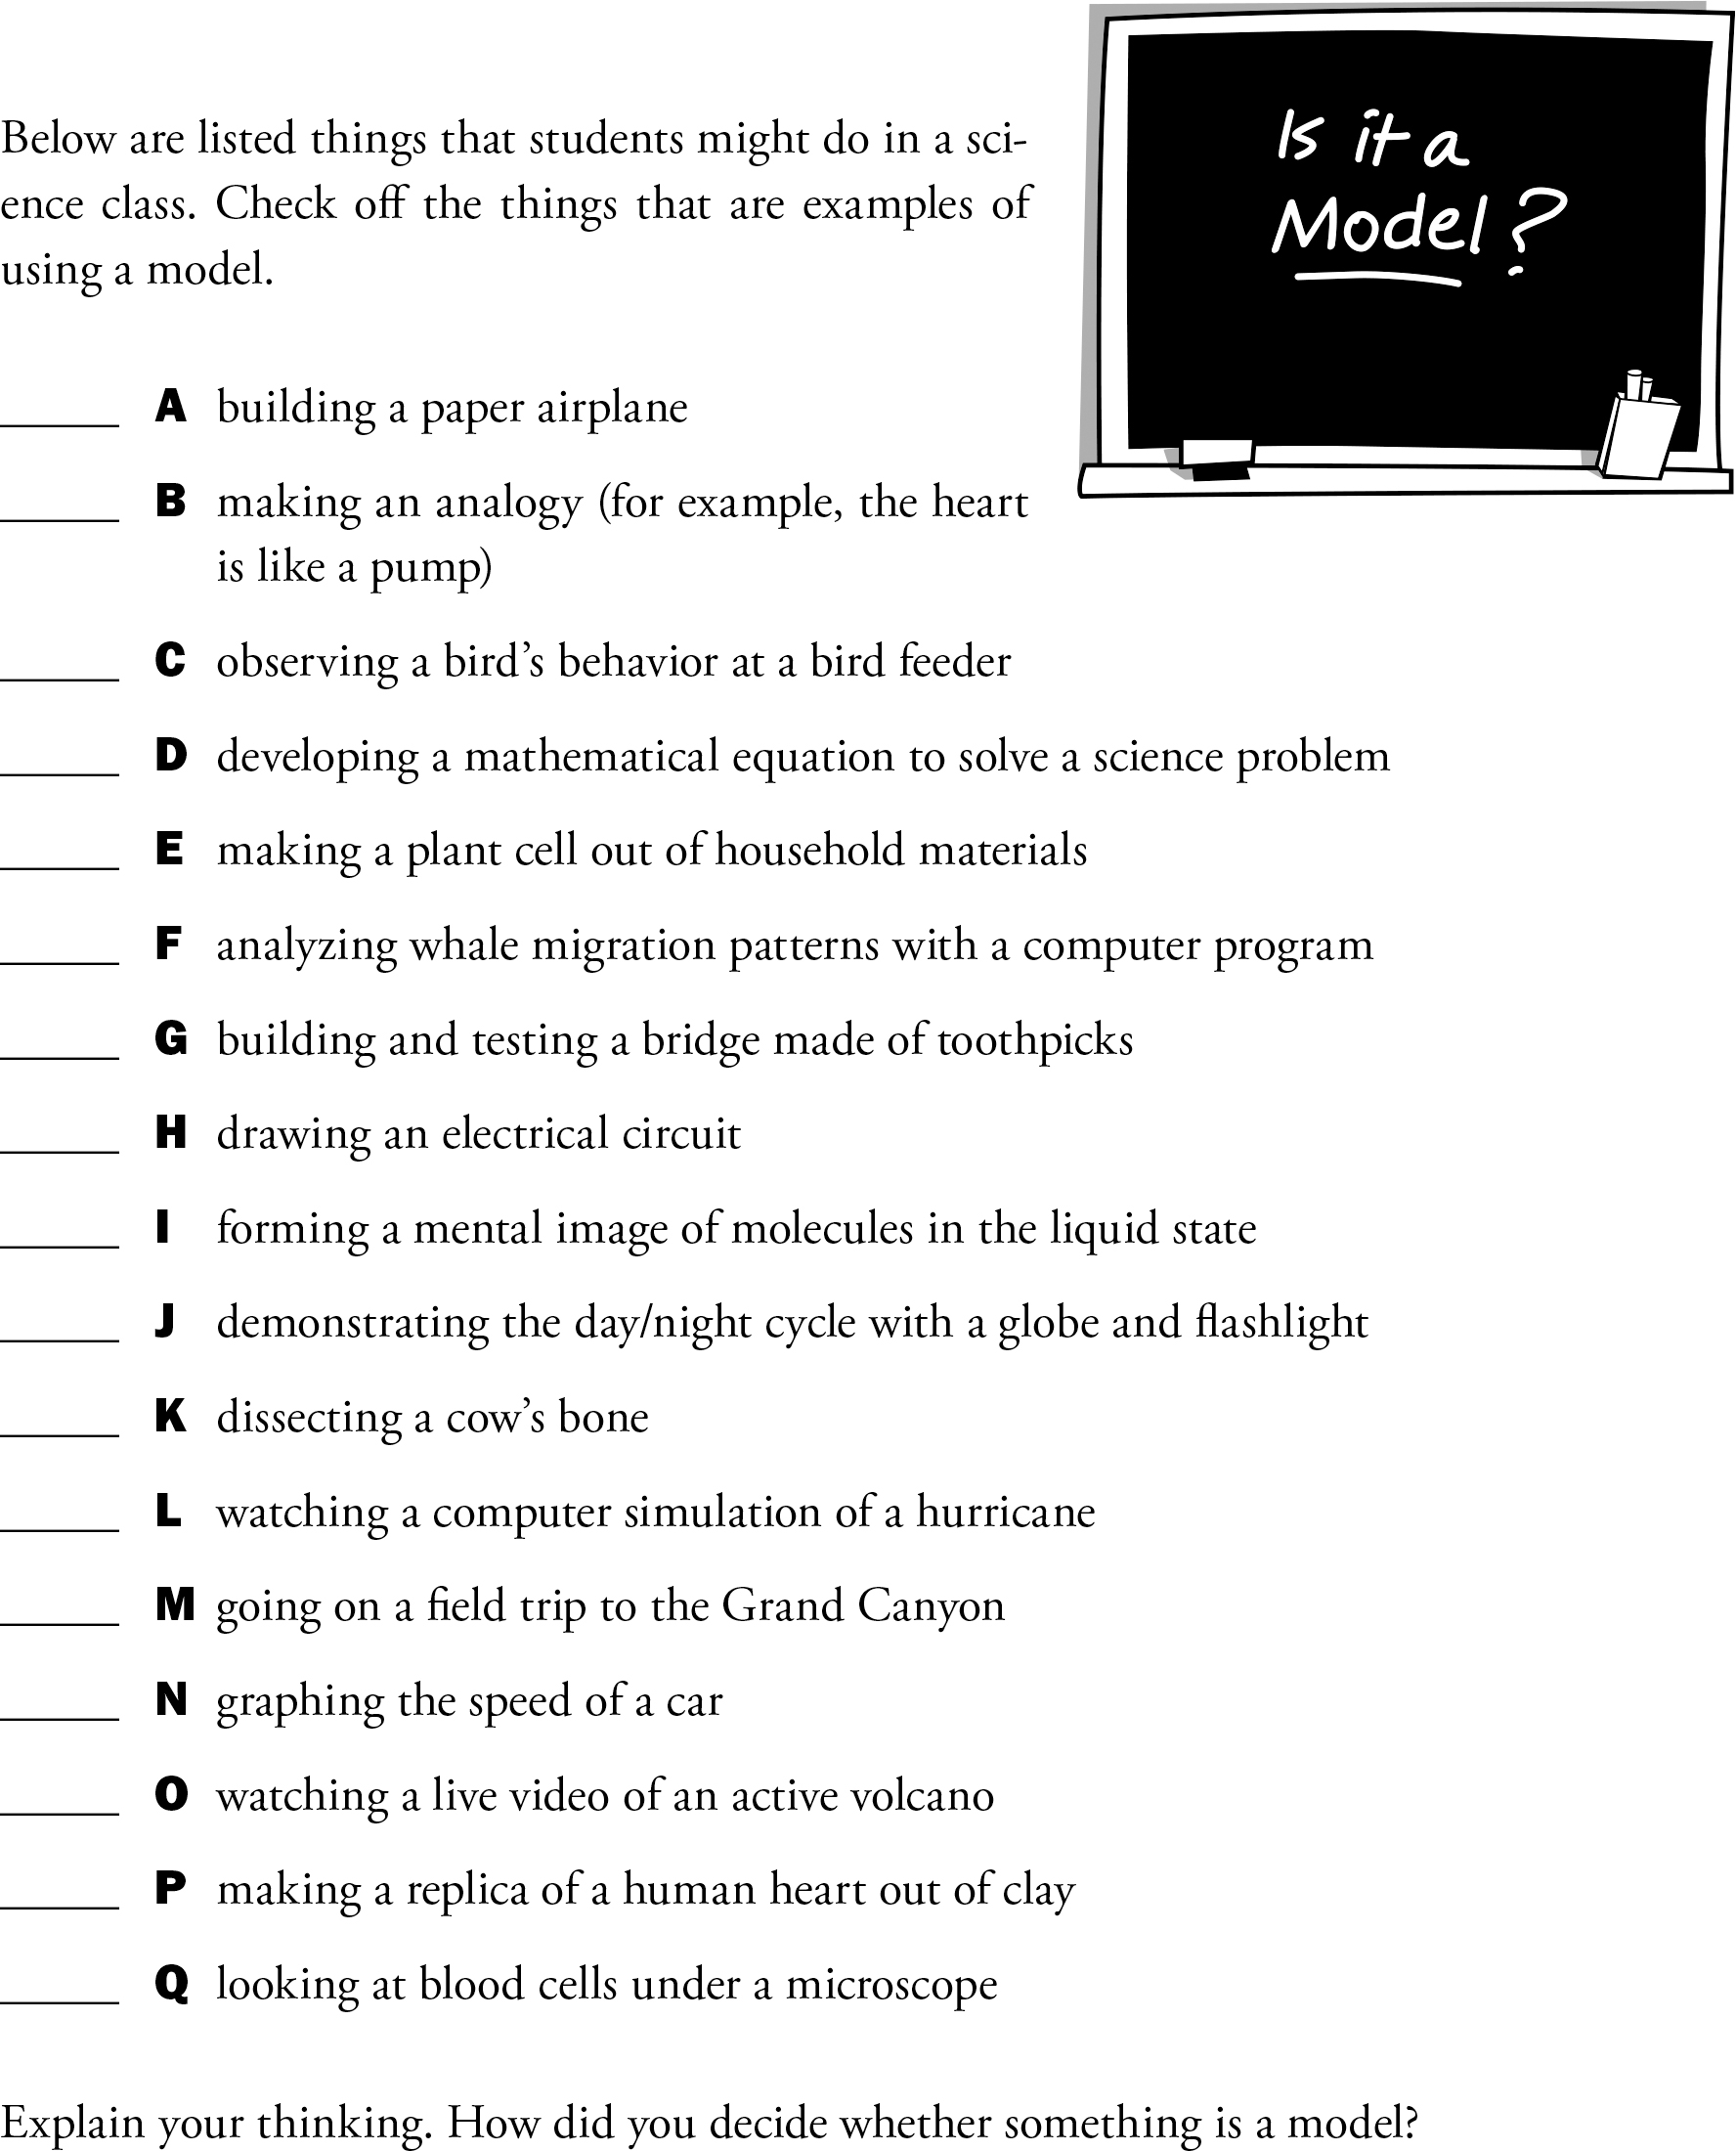
With each map, students were asked: “Is this a scientific model? If yes, thumbs up. If no, thumbs down.” Student responses ranged in accuracy, with some students thinking the less complex maps were not models, while the more detailed, interactive maps did serve as models. When specifically asked if the graphs of lake levels and elevation forecasts were models, most students indicated that this was not a model, explaining “It’s just a graph, like a way to show the numbers. Something you’d make in math class.” Having an idea of how our students were thinking, we then provided explicit instruction on scientific models using the assessment probe “Is it a Model?” (Keeley and Tugel 2009; see Figure 1). In this probe, students are provided a list of things they may do in a science class and check off the things that would be considered examples of modeling (e.g., building a paper airplane, making an analogy). To execute the probe, students were given the probe choices on strips of cardstock paper in an envelope. Working with one partner we asked our students to sort the examples into two piles, one pile for models and a separate pile for those that were not models. As we walked around to look at the evidence of our students’ thinking, we would ask questions such as: Why did you decide dissecting a cow’s bone is not a model? Why wouldn’t going on a field trip be a model? What do all of these models have in common? From follow-up, whole-group discussion, our students generated the following questions to help them make a decision about whether something could be a model: Can it be used to predict outcomes? Does it represent something that is really much smaller or larger in size? Does it help explain or show how something works? Is it showing parts of something? Is it based on scientific ideas? Can it be used to test ideas?
From our students’ ideas we then made an anchor chart to keep on display to help students answer “Is it a Model?” in future situations.
Explore/Explain (part 1)
After generating these ideas, students were then asked again: Is the river basin map a scientific model? Students quickly showed thumbs up, with many of them raising their hands to offer an explanation. Students provided reasons such as, “It shows us something that’s actually really big down to just a piece of paper.” “It is showing us where the rivers flow and maybe they could use this to get an idea about how a flood might affect stuff.” In order to highlight the predictive nature of models, students were then asked: How do you think this river basin will look in 10 years, 100 years, 1,000 years? How could we display our predictions? Our students now recognized that a graph could be used to anticipate future water levels, explaining “It would actually be kind of hard to show that in the other maps because it’s not really showing water levels. They’re really showing where things are and stuff around it.” After sharing some of their thoughts, students were then prompted to return to thinking about the more detailed river basin map. Students were given a few moments to quietly think about and respond in their interactive notebooks to the following prompts: If you follow one set of river paths from the northeast corner of the state, you’ll see it moves through Buford Dam to Morgan Falls Dam, and so on. Describe where you are live among this river system. Follow the various paths of these rivers and creeks. Stop at each dam. If the water from Buford Dam was not released, what do you think would happen downstream in Columbus? Where is the water’s final destination? What factors determine how much water is in this area? How might this affect the living and nonliving things in this area? As you follow the waters’ path, who does this water belong to? Explain your thinking.
Again, after time for individual thinking and writing, students engaged in partner discussion, followed by whole-group discussion. Students’ perspectives concerning the question “Who does this water belong to?” were quite interesting. In one class, a student stated, “Possession is 9/10 of the law. If I got it first, then it’s mine.” One student countered, “But that’s not fair, because if you didn’t dam it up, then more of it would be going down toward our city, so you’d be stopping some of it from coming to us.” Another student presented the idea, “Its nature. Nature doesn’t belong to anyone. No one owns nature.” These kinds of contributions stirred a lot of emotion with students. Generally speaking, most students thought the water should be shared, with the quantity determined by factors such as human population of the surrounding area.
Explore/Explain (part 2)
In transitioning to the Exploration phase of water availability, students previewed the details of our water wars through an introductory video designed to pique student interest and highlight the relevance of the issue. Struggling and on-grade-level students were shown a video that succinctly gave an overview of the factors associated with the water wars (see “Georgia’s Water Wars” video in Resources). This video had minimal distracting details and included narration of bulleted information with supporting photographs, making it ideal for the bulk of our struggling and on-level learners. These students watched the introduction twice. First, just for the sake of watching, and then again so that we could pause and discuss some of the main points presented. Our students in advanced/gifted classes were shown a concise, but more detailed video that included interviews and arguments from various points of view (see “Water Wars Part One” in Resources).The video was paused periodically to allow an opportunity for students to engage in discussion and think out loud about what was presented from the various perspectives.
After watching the video, students were divided into collaborative groups of three to five students, based on similar reading inventory scores. Two primary resources were used for students to explore the background and details of the tri-state water wars. The cohesiveness of both sets of informational texts was strong. This was evidenced through the consistency of the information provided. Both also included maps with clear labels relevant to the content. However, both resources were modified significantly from the original versions in order to provide an appropriate challenge in comprehending the text. For example, for students with lower reading inventory scores, the length of sentences were shortened to exclude extraneous details and unrelated images were eliminated (e.g., organization’s purpose, links to other projects, ways to donate, and color photographs that did not enhance understanding of the content). For these students, we also provided a structure for annotating, peer reading, and comprehension conversations (see Figure 3, p. 58).
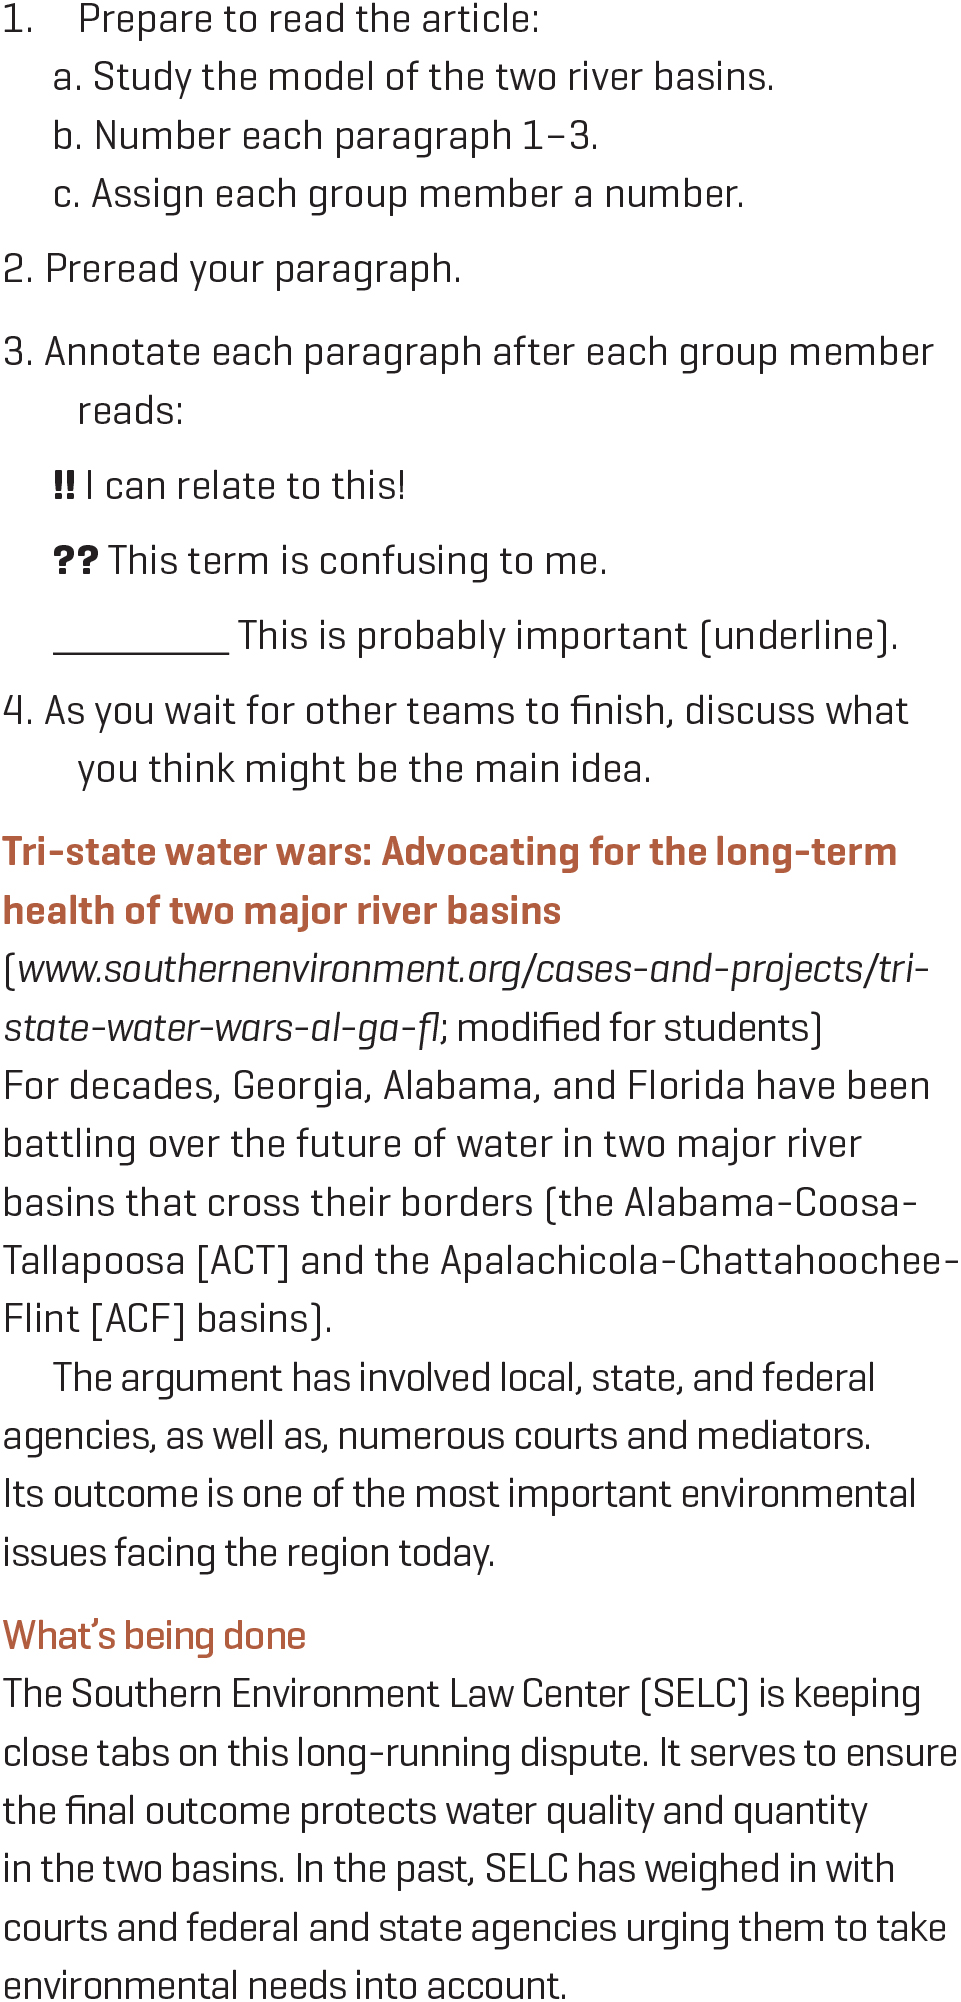
Our struggling and on-level students were also provided a template for organizing the main idea and details, but their articles originated from the Southern Environmental Law Center (SELC) website (see Resources). Similarly, the SELC articles gave an overview of the background, provided fact sheets, and shared a more succinct timeline of press releases. For these students, we also modeled the expectations using a modified version of the introductory page (see “Tri-State Water Wars” in Resources). To prepare for reading, our students numbered each of the paragraphs 1, 2, and 3; numbered heads within their group; preread their paragraph; and then read aloud within their groups. As each group member finished reading their paragraph, the collaborative group discussed what they should annotate and prepare for whole-group discussion. Once the groups finished reading and annotating, whole-group discussion was led in order to hear each groups’ thoughts, identify the main idea, and record supporting details. After asking students if they needed clarity on expectations, we then asked students to continue in this same way with the other sections from the website.
To ensure all student success with this exploration, we also differentiated for our students with higher reading inventory scores. As the excerpt in Figure 4 highlights, we provided these students with sections of the article from the Atlanta Regional Commission that overviewed the causes and effects of the water wars in our region, litigation history, and impacted stakeholders. The text they were provided was more complex with technical language. See the Online Supplemental Materials for the exact excerpts students used to obtain information. Each section from the set of articles was identified as a station and topic, resulting in six stations.
No matter the reading level, students were provided 15 to 20 minutes with each section of the article and charged to obtain and communicate the main idea and supporting details. This particular exploration required two instructional days. Within our professional learning community (PLC) we agreed that the interdisciplinary nature of the exploration warranted the time spent. As students used the provided graphic organizer to record and organize the information obtained (see Online Supplemental Materials), we found that this explicit alignment with ELA CCSS was invaluable. To ensure success, while students were in these stations we monitored their accuracy, provided feedback during discussion, and provided clarity in understanding content if needed. One important takeaway from our monitoring was students’ struggle to isolate one main idea from each of the sections. They required more guidance in the first few sections they worked through, but with support and practice they achieved success and gained momentum as they moved into the later sections/stations.
In a follow-up discussion with all of our students, students expressed (a) surprise at the reality of a water war between our states and regions, (b) enthusiasm in discussion about the issue as evidenced through class conversations that self-propelled, and (c) questions about the details associated with environmental policies that they had not considered. For example, one station provided an excerpt from the resource that addressed the impact of water levels on the oyster population in the delta prompted our students to begin thinking outside of their own needs, to the needs of other living things. Being introduced to this reality naturally prompted students to ask questions.
Next, students were charged with thinking about a question, or questions, about water availability that could be answered through investigation and/or research. Students brainstormed and listed questions in their interactive notebooks and then shared their ideas with the class. While sharing, students were asked to carefully consider each of the questions that were listed to ensure no duplication of a question. We referred to our anchor chart “Questions to Ask When Doing Science” (see sidebar below) and worked through each question, putting a check mark beside those that could be answered by science, or within the realms of our classroom. We then struck through those questions that could not be answered by science and/or based on the restrictions of our classroom. If students were unsure about whether their idea was a good scientific question, we would always refer back to the anchor chart. In many instances, students would have quality scientific questions, but we would eventually agree that answering the question extended beyond what we could do in our classroom. In the end, students were led to create one driving question that captured all of their ideas. We structured this conversation by asking our students to think back to how figuring out the main idea of the water wars articles required that they “think big.” When students would ask questions such as, “How is the agriculture in Columbus impacted by the water supply?” we would simply ask, “Do you think that’s a big enough question to cover the entire war?” Reminding students to keep the question broad and to allow for as many answers as possible proved frustrating for them. Therefore, most classes were guided toward a question such as, “How does the way Earth works lead us to water wars?”
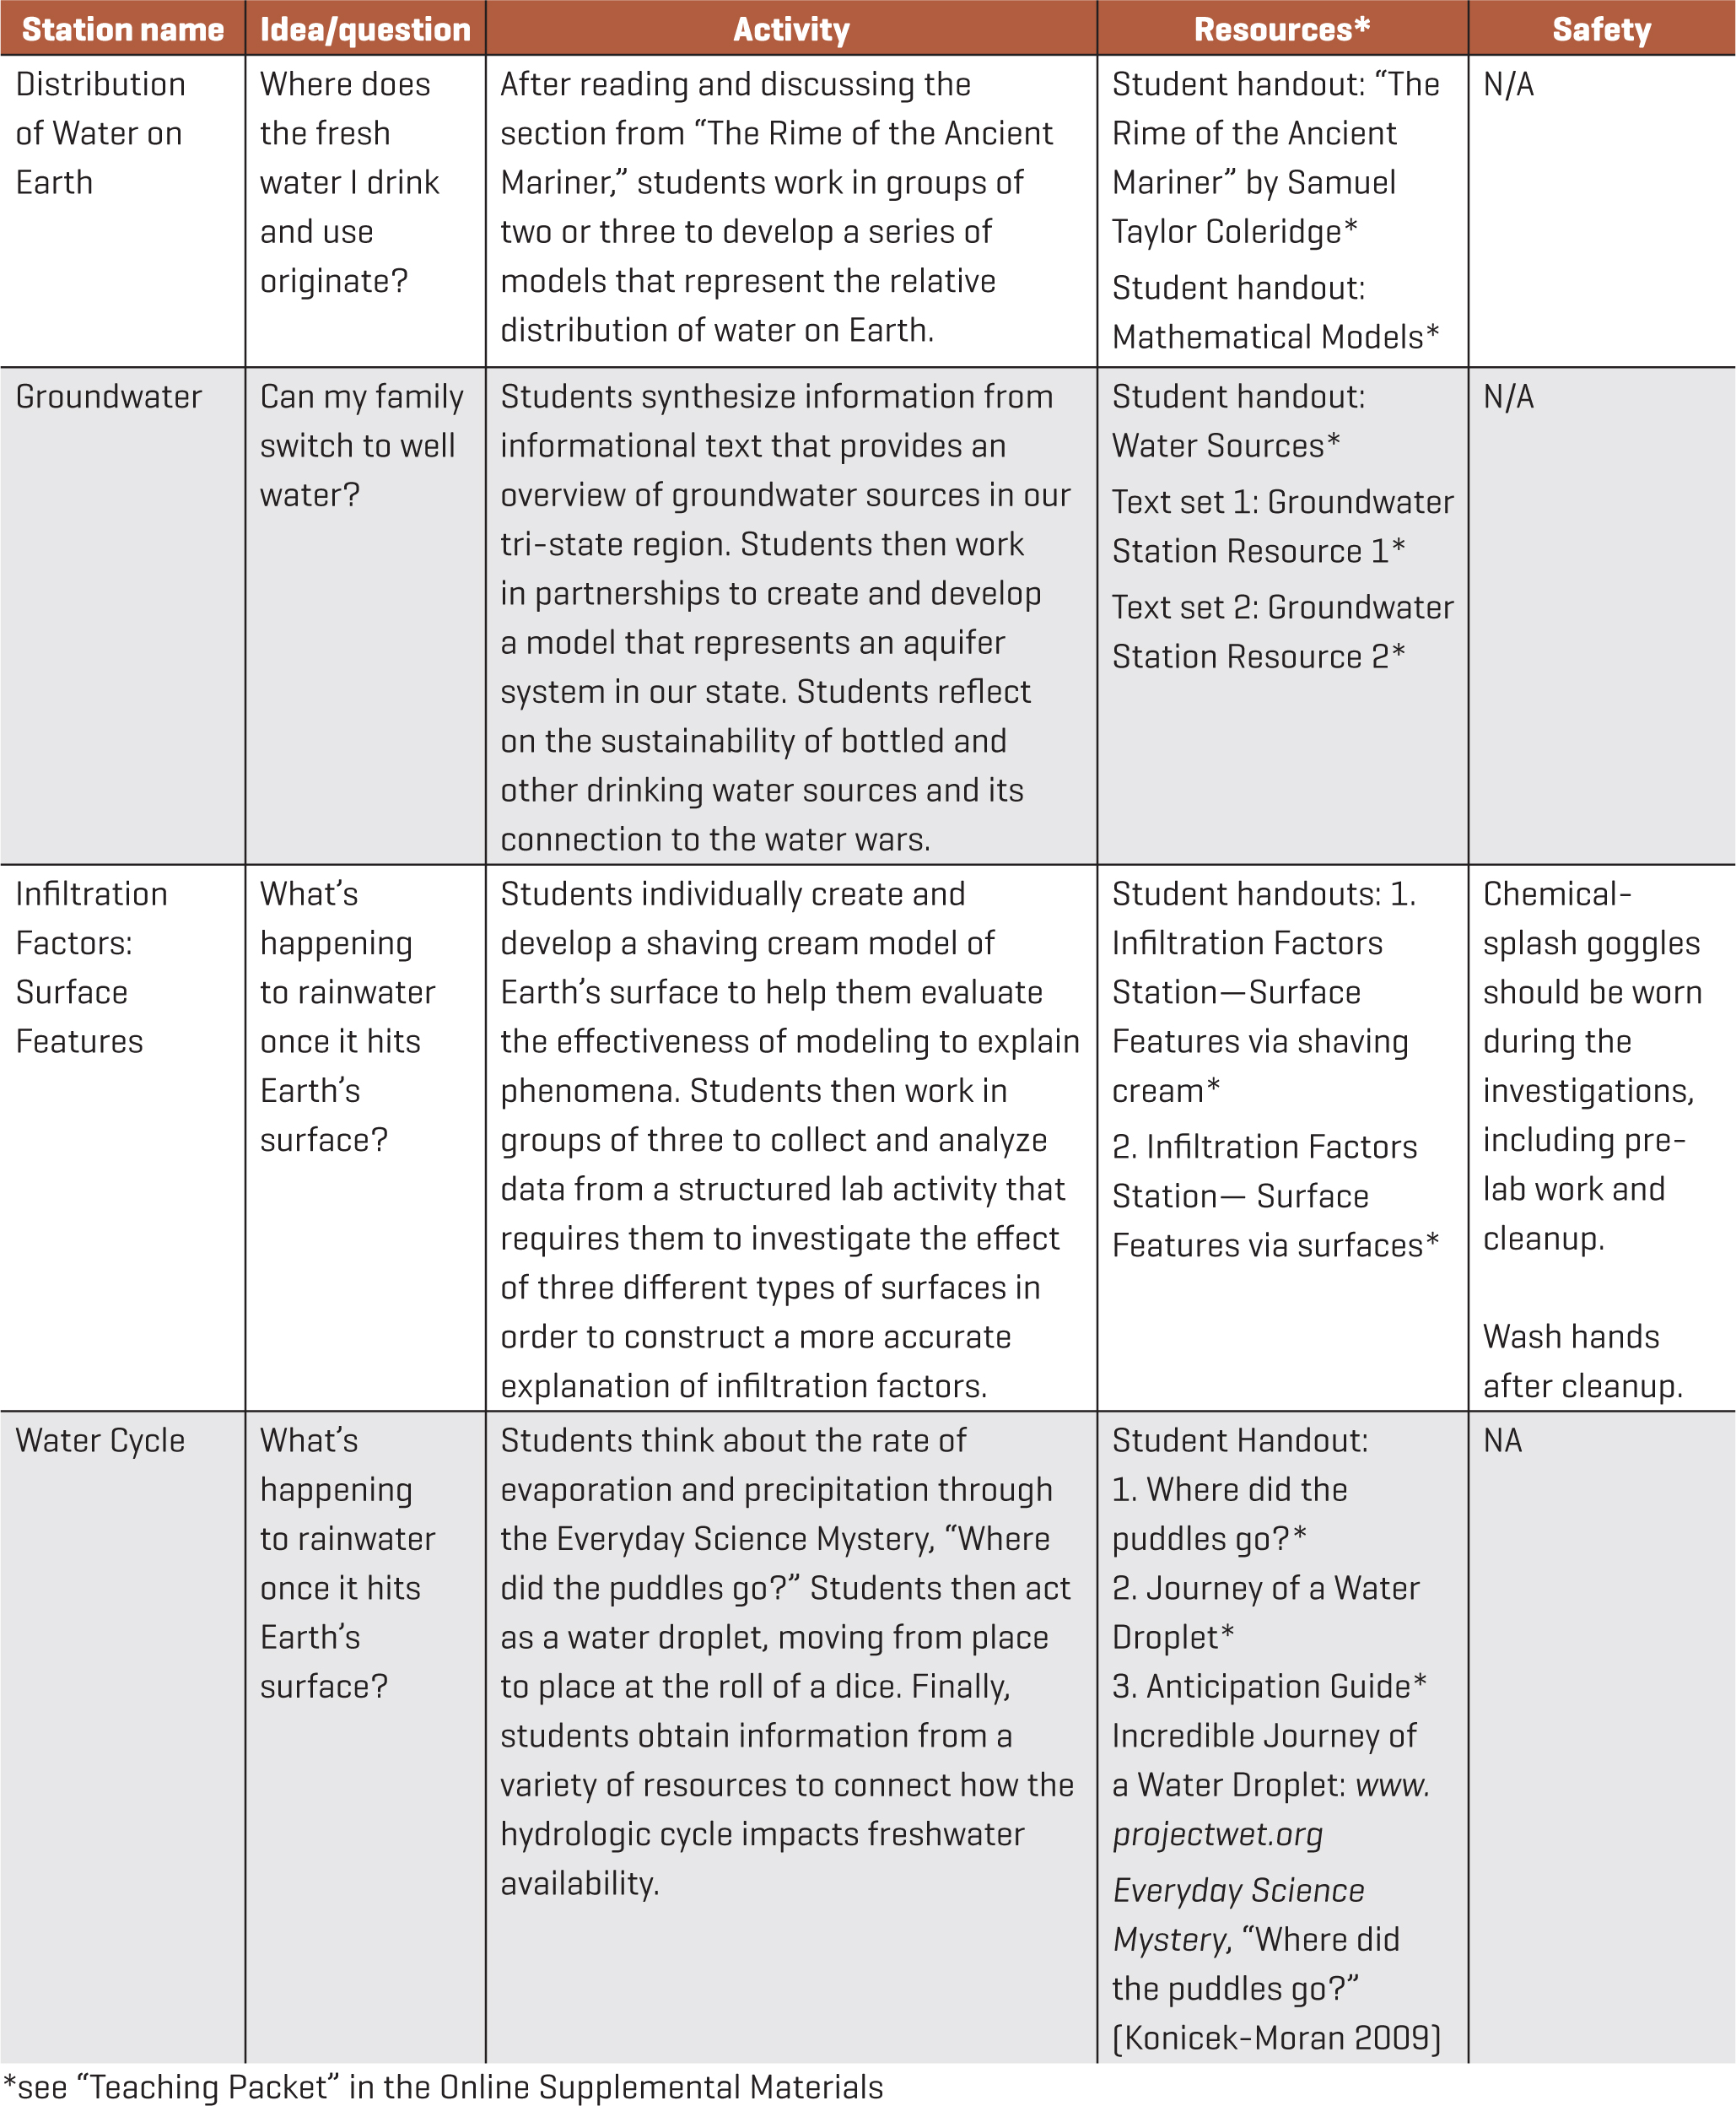
We think it is important to note that such a broad driving question can be quite overwhelming for both students and teachers. When we began planning for this socio-scientific learning cycle, we knew that this was the kind of question we wanted to guide our students toward developing. Though none of our students generated this question specifically, after their brainstorming sessions they still felt ownership going into the investigations. In addition, when we thought about planning explorations that supported students in investigating this concept, the options were limitless. We decided to narrow our options to four stations that address four different aspects of water distribution specifically related to the role of water in Earth’s surface processes, the cycling of Earth’s materials, and the transfer of energy that drives these processes (see Figure 2, p. 56). This was predetermined based on the recommendations of our state and local pacing guide. However, the transcendent nature of the issue allowed for it to be brought back into conversation across multiple units of instruction for the remainder of the year.
Explore/Explain (part 3)
In Figure 2, we share the instructional decisions we made based on possible answers to a driving question: How does the way Earth works lead us to water wars? Each possible answer was set up to be discovered through an exploration of a mini-phenomena, followed by obtaining specific information that would support students in making connections to the overarching issue of our water war. Students were expected to complete one station daily, ending each day by adding to a growing list of ways Earth’s system leads to water wars. At these stations, students first explored an idea or phenomena through a narrative (poem, short story, or scenario), then developed models (mathematical, visual representations, or 3D) from carrying out investigations that were scaffolded based on desired outcomes. Students then read informational text that supported a common language and way of explaining what was observed. From experiences and information gained in the explore-obtain combo, students then made connections with constructed summaries that were typically in the form of graphic organizers, revised visual representations, or constructed responses (see Figure 2 and Online Supplemental Materials for more specific details).
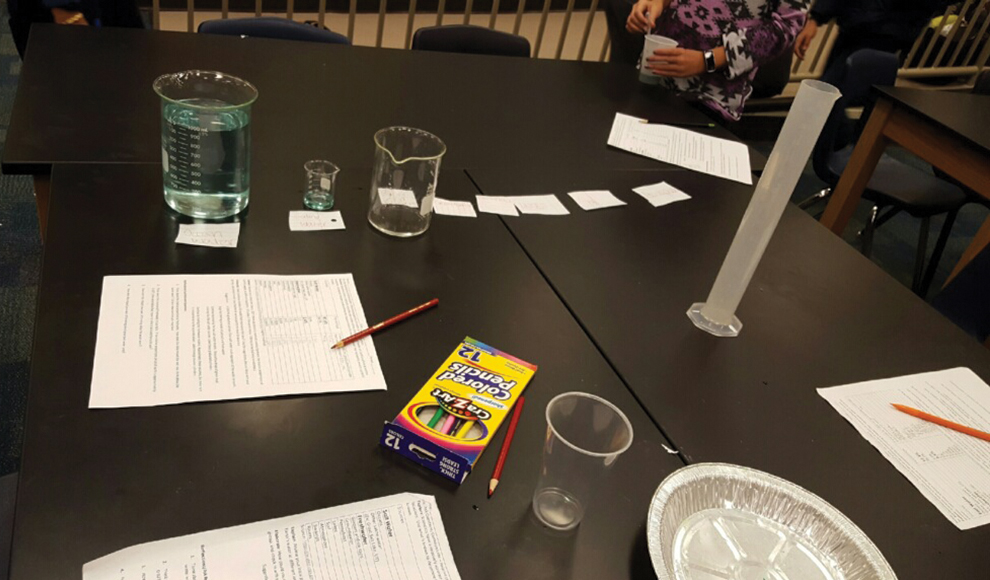
Our students’ experiences with these stations were motivating for both them and us. Daily exclamations of, “Ah! I get it!” propelled everyone through the learning cycle. From our reflections in PLCs we discussed two primary factors we think contributed to our students’ successes. First, the variety of activities themselves—ranging from storytelling, poetry, virtual simulations, and three-dimensional modeling to mathematical representations. There seemed to be at least one thing that appealed to everyone. Second, active monitoring of conversations and practices served to continuously and informally assess student thinking progressions as we walked around. For example, as you can observe in Figure 6, students had set up for modeling the distribution of water on Earth, but were hesitant to pour and follow through with the modeling because they did not want to make a mistake. After we encouraged and affirmed their practices, students were more willing to take the learning risk associated with the practice. As we actively monitored, we also listened for how students connected the exploration to an explanation. We noticed that at first our students struggled with following through when thinking through these connections. As one student explained when redirected to a reflection, “I just want to do the science stuff and worry about the writing later.” Learning to practice science as a hands-on, thoughtful, written practice was an unexpected, but positive outcome for our students. We also found that verbal feedback was sometimes not enough for students to improve their practices. Sometimes students needed specific written feedback, as shown in Figure 5. Once we provided clear data in their mathematical models, students often requested to re-do the assignment to improve the quality and their score.

Evaluate
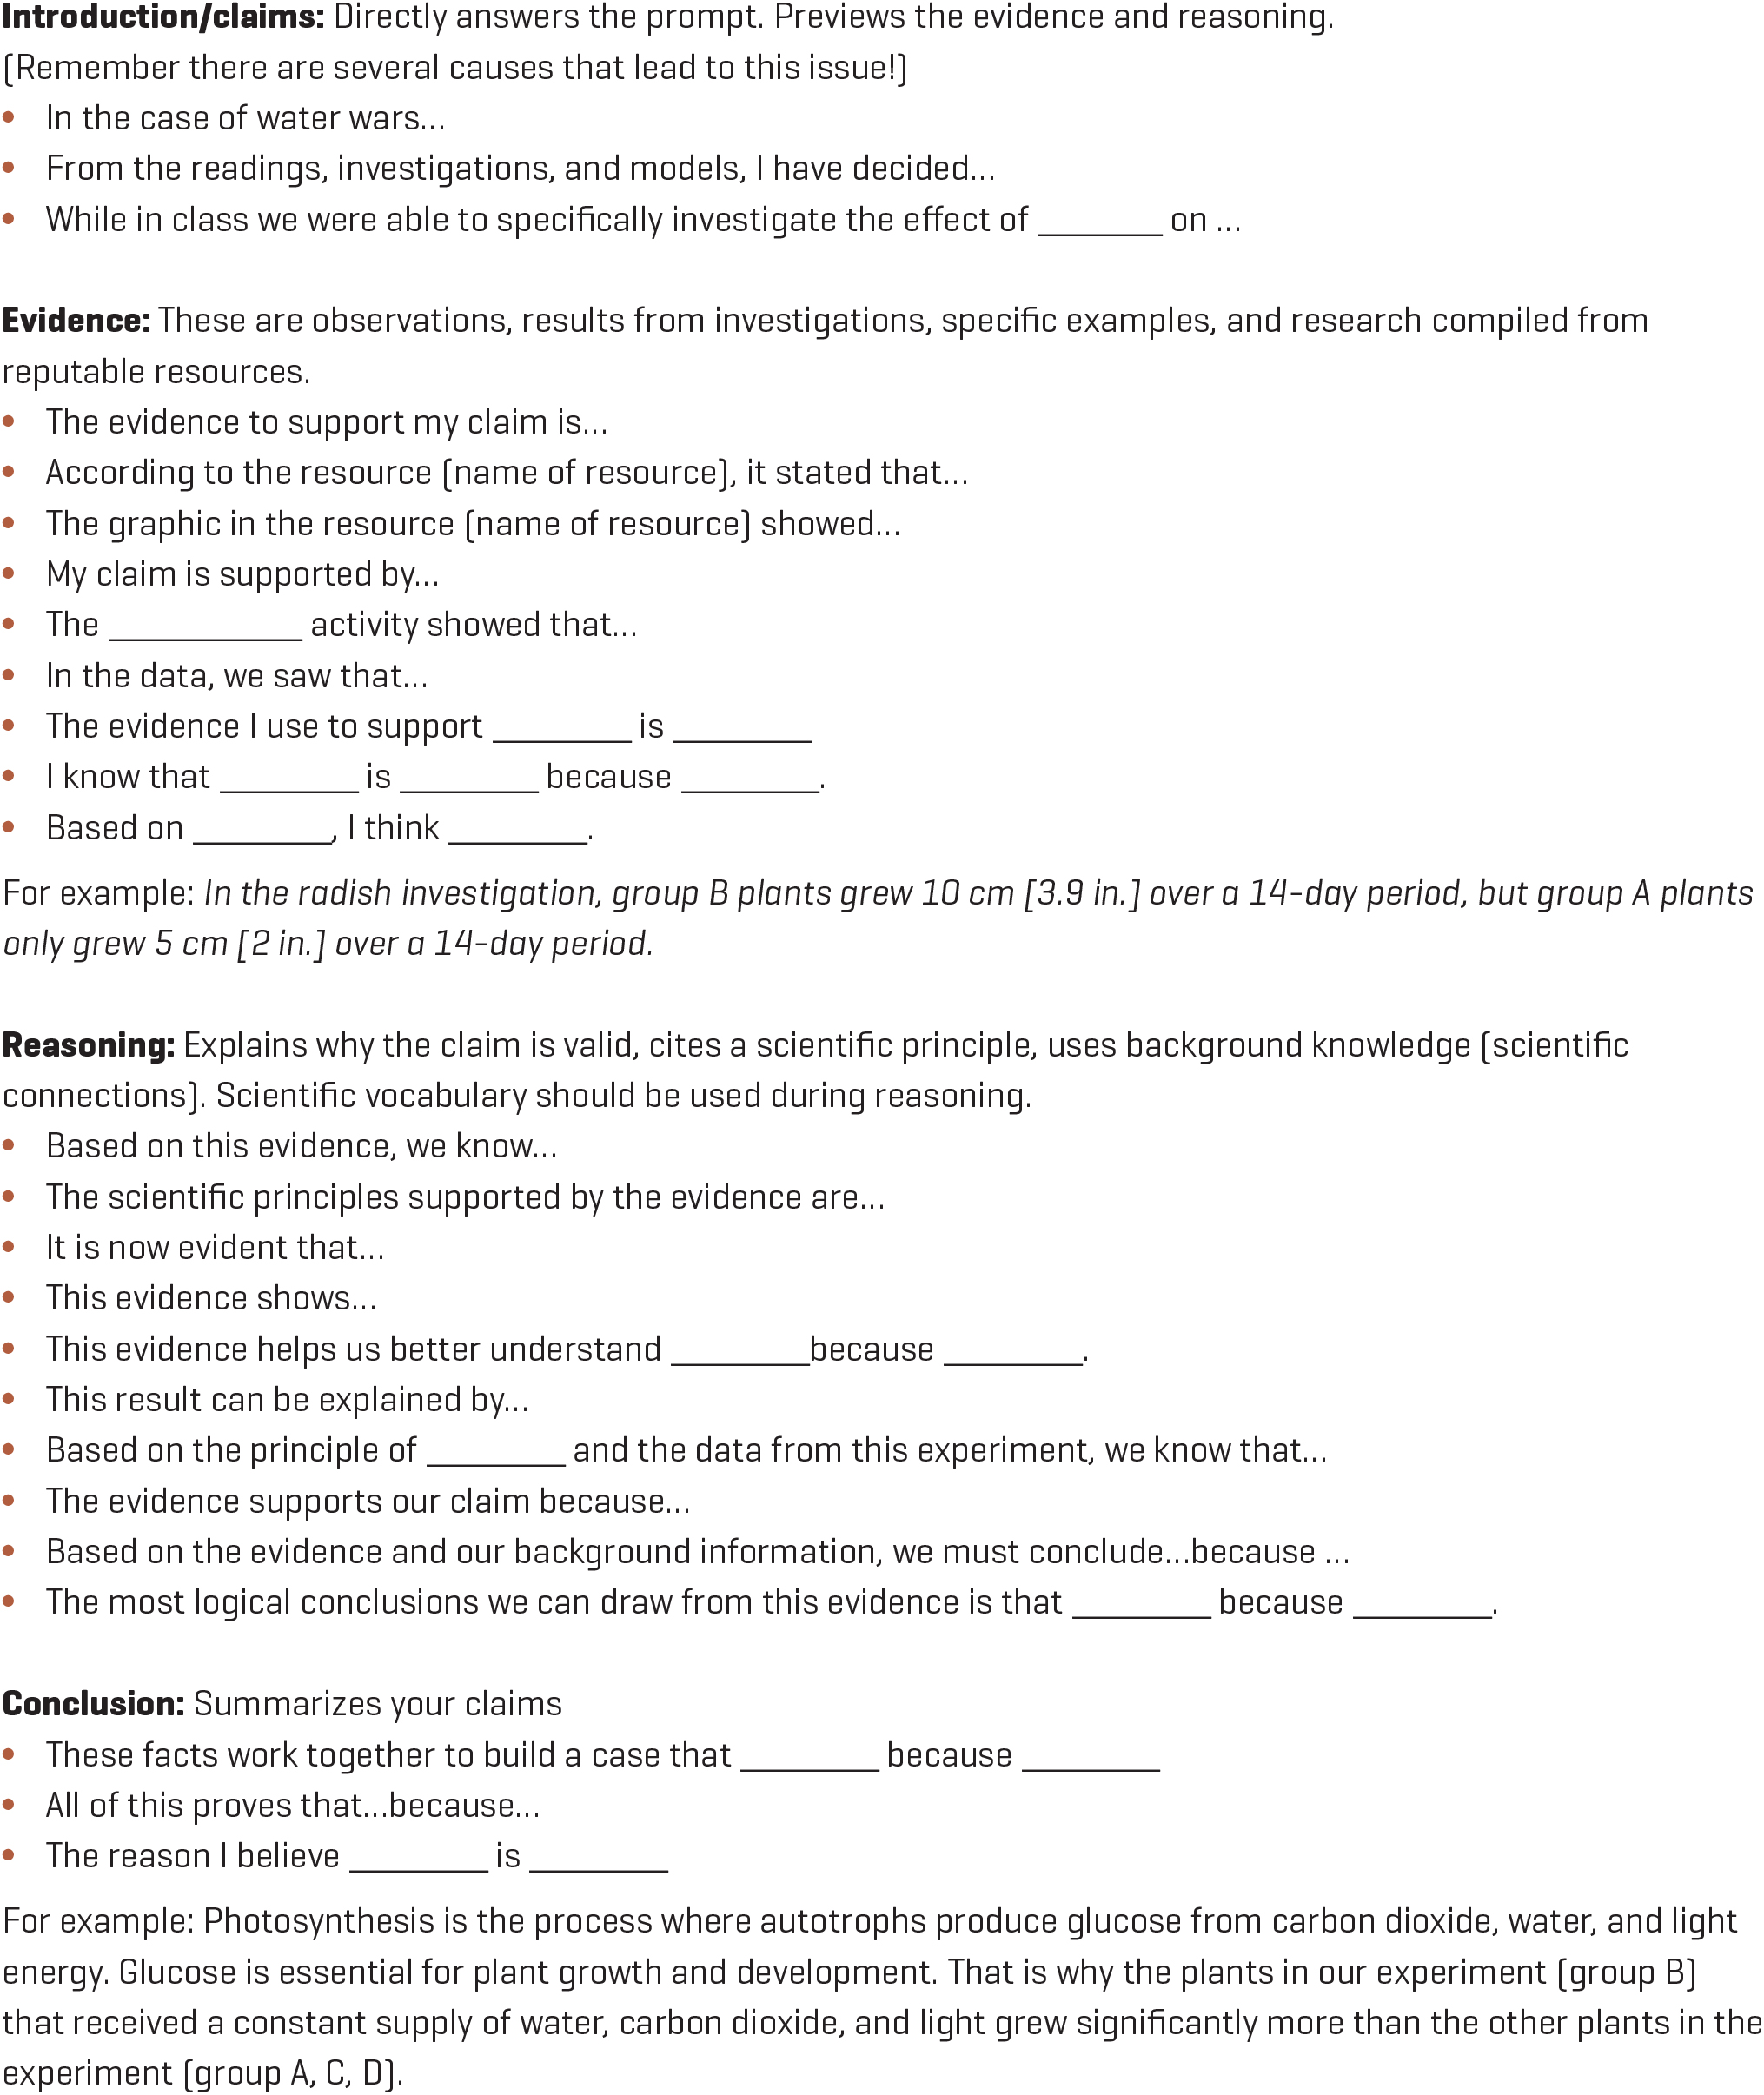
Our students kept ongoing records from each explore/explain station in their notebooks. This eventually served as an organizer for a final written constructed explanation to the question: How does the way Earth works lead us to water wars? To construct explanations, students were expected to follow a writing framework similar to that of claim-evidence-reasoning, but with the understanding that the complexity of the issue warranted an introduction and conclusion that made explicit all of the factors they had explored, as well as acknowledge those potential factors that they had not explored. Sentence starters (see Figure 7, p. 62) and a writing rubric were provided for all students and used as our primary means of establishing the expectations. We differentiated this support system for classes with co-teachers (where students typically function below grade level) and those without. For those classes without a co-teacher, we made the sentence starters accessible via a common location in the classroom, but then made it a part of the provided table resources for typically lower-performing students (co-taught classes). As our students tackled this explanation, we again had to ensure we were meeting the needs of all our learners by providing immediate feedback and explicit guidance about the organization and accuracy of their explanation. We walked around, closely watching what our students were writing, hovering over their shoulders in a way that at first distracted them. Students eventually acclimated and would start looking around for us if we were not close by when they had a question. Sometimes, the question would be, “Does this sound right?” Our standard response was something like, “Let’s read it aloud together, and then see what we think.” Based on our students’ needs, some were guided more closely than others. For example, one student said, “I understand like in my head how it all connects, but I can’t really figure out how to say all that in words. It’s just so much stuff.” This was expressed more frequently than we expected, and as a result we then created and provided a graphic to help these students organize their ideas (see “CER Graphic for Struggling Writers” in the Online Supplemental Materials).
Extend
As a final summary of the learning cycle, our students were guided to apply what they had learned through a socio-scientific lens. To do so, we wanted our students to make explicit their role as good water citizens. We initiated this conversation by sharing a video interview about Autumn Peltier, a teenager from Canada, nominated for the International Children’s Global Peace Prize for her advocacy of clean drinking water. We thought our students could identify with Autumn, as she was close to their age, but also acknowledge the value in her advocacy work in light of their new understandings about the true value of water. Autumn’s ongoing efforts to bring water awareness to both politicians and people in various local and global communities provided us with an opportunity to show our students a lens for having an active role in the community. Our students first asked many questions about Autumn’s specific situation, as they had a difficult time connecting with what it meant to be indigenous. They first associated her indigenous culture with a lack of available water, rather than recognizing her advocacy was based on a larger scale of political and corporate decision making. Once this was clarified, some students expressed that they did not understand how speaking to other kids and adults would really make a difference in anything. We reminded students about the recent marches that have occurred in our region, such as the Georgia Women’s Alliance March and the Atlanta March for Social Justice. We asked: Is one march enough to make a difference or do you have to do other things as well? What kinds of other things do you have to do? What kinds of things is Autumn doing? Is the attention she is gaining getting the attention of people who can change policies? Once it was evident most of the disconnect had been addressed, we again redirected students’ focus on our communities and their role(s) in the water wars. Discussion was facilitated with questions such as: Why is it important to be a good water steward? Has anyone ever joined a creek cleanup? How does volunteering in stuff like that make a difference? The conversations made it abundantly clear that our students recognized the complexity of the issue and the importance of their own water stewardship moving forward.
Conclusion
Mirroring the complexity of the water wars themselves, you can imagine there were opportunities for this learning cycle to move in many different directions. While this is the route we chose with our students, there is no doubt that other tried-and-true curriculum connected to other disciplinary core ideas of Earth systems could have been used instead. If you consider using an issue such as this in your own practice, recognizing the potential for this issue to tie into other learning cycles you implement throughout the year will also improve its overall effectiveness. For example, later in the year when our students were learning about the role of plate tectonics and weather and climate on Earth’s surface features, we prompted students to think about how these things would impact water availability both over a short- and long-term period.