
Scope on the Skies
Warming waters
By Bob Riddle
Astronomy throughout the year
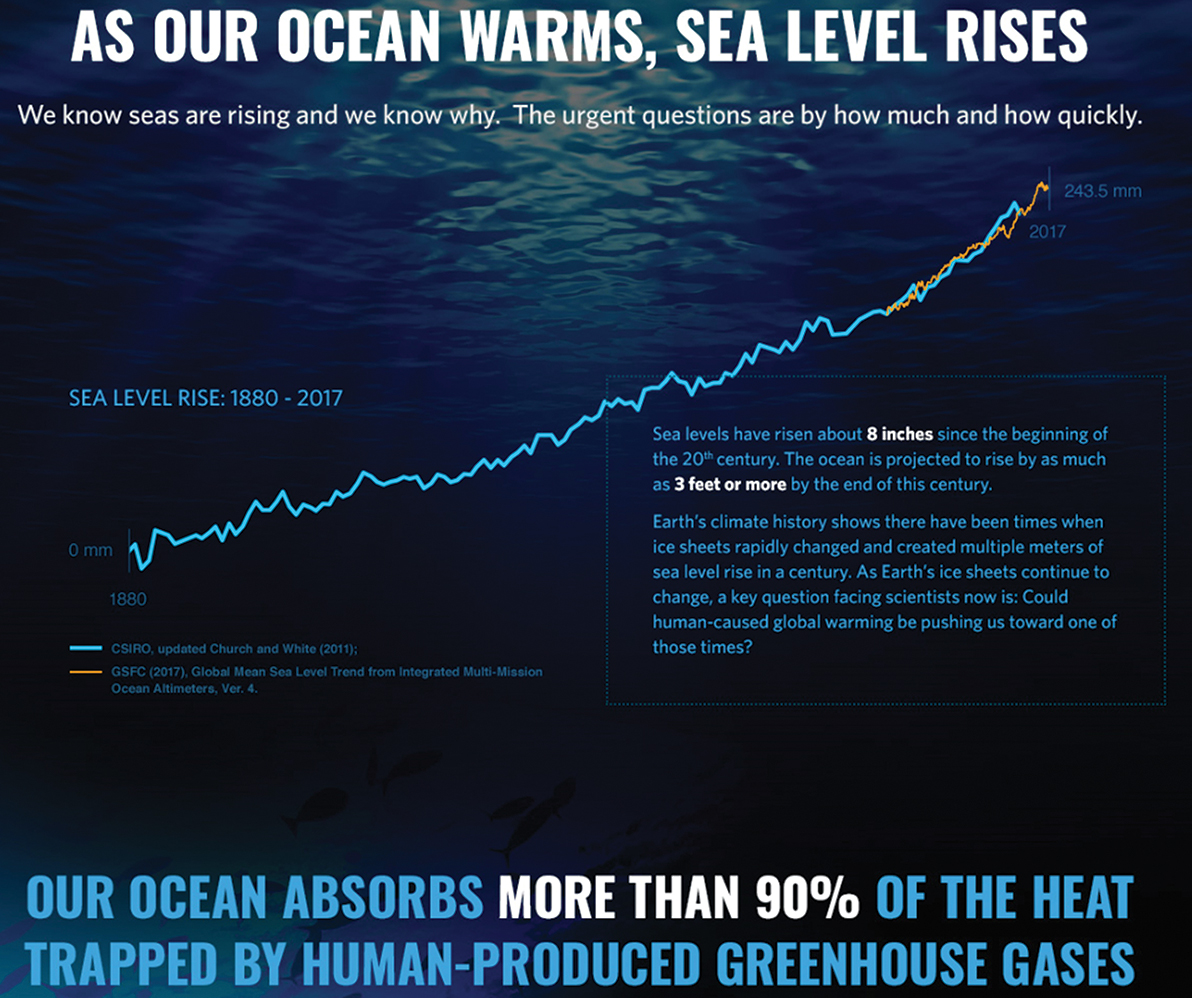
Scientists have monitored the effects of climate change on our oceans and seas directly, remotely, and via Earth-observing satellites for years. As the temperature of our atmosphere increases, the oceans absorb some of the air and become warmer as a result. It is estimated that the ocean waters have absorbed more than 90% of the increase in atmospheric temperature since 1880 (Figure 1). We also know that as the ocean waters warm, the sea level rises because warmer ocean temperatures cause the water to expand and increase in volume.
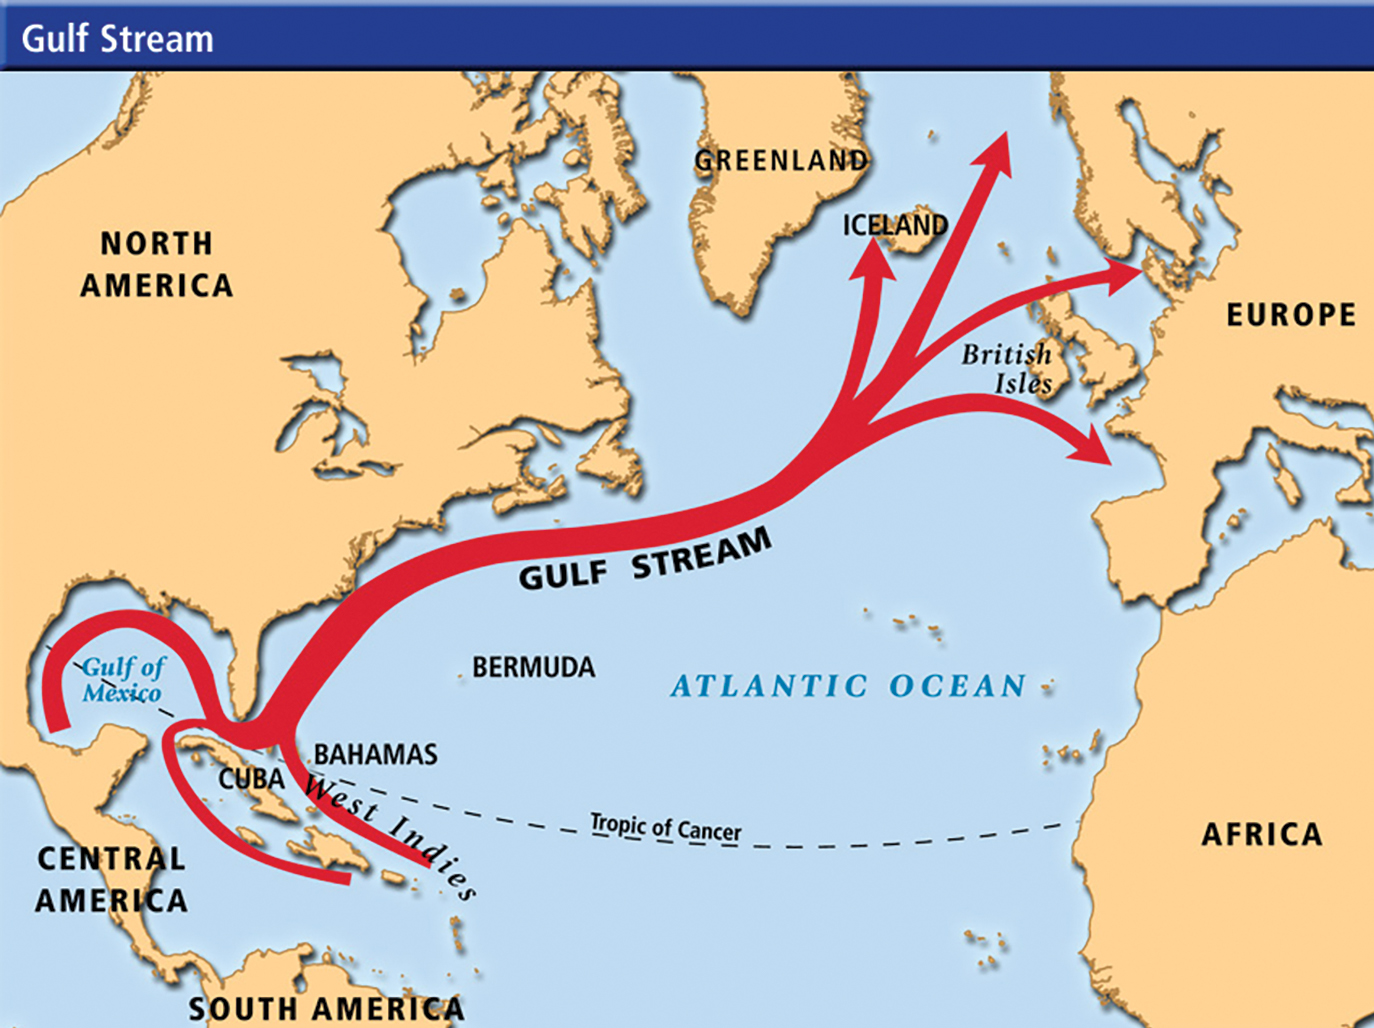
As the ocean waters warm, the density of the water decreases. Salinity also plays a role in the water’s density because dissolved salt increases the density of the water. This difference in density creates so-called density currents, the flow or movements of water of different densities within the oceans. Most of us are familiar with the Gulf Stream (Figure 2), a warm ocean current that originates in the Gulf of Mexico and flows northward parallel to the east coast of North America. The Gulf Stream ranges in size and depth but is about 100 km (60 mi.) wide with a depth of about 1,200 m (4,000 ft.). There are other types of ocean currents, including deep ocean currents, resulting from temperature and density differences, and rip currents, which occur under certain conditions along beaches. In addition, a rip current forms as winds push the water at the surface toward the beach and raise the level of the water at the shoreline. The excess water then flows back into the ocean creating the rip current.
As temperatures over land increase in snow-packed areas, glaciers are melting faster than they can accumulate snow, thereby increasing the volume of sea water and contributing to the rise of sea level. Not contributing to the rise in sea level are the freely floating icebergs. Their respective mass, liquid, or solid is already in the water and displaced an equal volume of water and, combined with glacial melting, create the growing crisis of rising sea levels. Currently, the rise in sea level is over 3 mm (0.1 in.) per year as shown on an interactive graph of sea level change (see Resources).
Measuring ocean temperature and salinity
Measurements of the ocean temperatures have been conducted for several decades using a variety of technologies, such as the eXpendable BathyThermograph (XBT), which are weighted probes attached at regular intervals to a common wire that is lowered into the water, measuring water temperature at different levels below the surface.
More recently, a network of floats called “Argo” are being used to measure water temperature and salinity. Argo is an autonomous device placed in ice-free oceans and is designed to sink to a depth of more than 1,829 m (6,000 ft.). At each depth, Argo measures temperature, salinity, and direction of currents, and then radios the data to orbiting satellites, which in turn relay the data to scientists around the world involved with sea level monitoring.
Monitoring sea level changes is also accomplished from orbit. One of the longest lasting missions is the OSTM-Jason 2 satellite, (Ocean Surface Topography Mission), which has been in operation since June 2008. As with many such missions, this one is a joint effort between NASA, the National Oceanic and atmospheric Administration, the Centre National d’Etudes Spatiales (CNES), and the European Organization for the Exploitation of Meteorological Satellites. On board the satellite is a suite of instruments, including GPS to determine the satellite’s position; a radar altimeter to measure sea level, heights of waves, and wind speed; and an instrument for measuring water vapor in the atmosphere. In addition, the Jason-3 satellite was launched in 2016 to monitor sea-level changes. The primary instrument on the satellite is a radar altimeter to accurately measure sea-level changes as small as 3.8 cm (1.5 in.).
NASA has plans for a future joint mission involving other organizations including CNES, the Canadian Space Agency, and the United Kingdom Space Agency. The Surface Water and Ocean Topography (SWOT) is scheduled for launch during 2020 or 2021. The SWOT mission will be to conduct a survey of surface water, oceans, lakes, rivers, and wetlands and how these bodies of water change over time, and to measure the ocean surface topography with a high level of accuracy. This mission will play a significant role in helping us to understand and better manage freshwater on a global and local level, and the effects of climate change on the Earth’s water.
Climate change
Thanks in part to satellite technology, we are seeing more clearly the effects of climate change on the waters of our planet. In addition to threats posed by rising sea levels, we are starting to experience water issues in part related to climate change, but also due to water usage and management. There are many online resources and apps to provide information about climate change.
Because our students are inheriting the Earth and its condition from current generations, they should be informed about climate change and be prepared to remediate conditions. What sorts of changes will future generations possibly face? NASA has several websites devoted to climate change where students may investigate climate change and sea-level changes using historical and current data. To begin, have students watch Earth Minute Videos that deal specifically with climate change and rising sea levels (see Resources). Below are some suggestions for activities that could serve as resources for teaching climate change, all of which are published on the NASA/JPL Education website.
- What’s Causing Sea-Level Rise? Land Ice Vs. Sea Ice
- Thermal Expansion Model
- Graphing Sea-Level Trends
- Earth Science Data Visualizations—How to Read a Heat Map
- Lessons in Sea-Level Rise
- Earth Minute Videos
The MY NASA Data website features useful resources for developing a unit on climate change and some of the consequences associated with rising sea level. The lesson objectives from the lesson “Coastal Consequences of Sea Level Rise” (see Resources) provide a good starting point for students to investigate: how a warming climate contributes to sea level rise. how satellites collect sea level data. how interactive data can help us understand the potential consequences of climate change on sea level in different parts of the world.