
What’s Important: An Exploratory Analysis of Student Evaluations About Physics Professors on RateMyProfessors.com
By Mihwa Park
This study explores students’ evaluations of their introductory physics professors posted on RateMyProfessors.com.
Most colleges use formal evaluation forms for students to evaluate their professors at the end of the semester. Although students have this opportunity, results are not generally made available to students and the public, whereas (RMP), the largest online professor review website, allows students to anonymously rate their professors with great freedom with their ratings and commentaries open to the public so that others may obtain information about their future courses easily without any extra steps such as logging in or requesting information.
When students attempt to rate their professors on RMP, they are asked to provide a rating in numeric form and to provide written commentary about their professors. Regarding numerical ratings, RMP asks two questions, “Rate Your Professor” and “Level of Difficulty,” and students rate their professors with scales from 1 to 5. RMP also asks three simple “Yes” or “No” questions such as “Would you take this prof again,” “Was this class taken for credit,” and “Textbook use.” As such, the numerical ratings do not provide much information about courses or professors. Consequently, students rely more on the open-ended comments over the numerical ratings and consider the comments to be more informative (Kindred & Mohammed, 2005).
Athough the RMP found fame as a new platform for evaluating professors, there may be disagreement about whether student evaluations on RMP provide credible messages. Indeed, studies have shown mixed findings on the validity of student evaluations on RMP. Some studies have found that ratings on RMP were not different from those on formal evaluations of teaching (Coladarci & Kornfield, 2007; Timmerman, 2008; Villalta-Cerdas, McKeny, Gatlin, & Sandi-Urena, 2015). Otto, Sanford, and Ross (2008) concluded that ratings on RMP were not a biased measure of student learning, but rather may reflect honest assessments of professors, whereas some studies showed that ratings on RMP were invalid for assessing teaching effectiveness (Clayson, 2014; Davison & Price, 2009). It is possible that RMP provides biased evaluations; however, the question of validity of student evaluations on teaching has been raised for formal evaluations as well (Kember & Wong, 2000).
RMP should not be a substitute for formal evaluations; however, many students consider students’ ratings as a credible source of information about their future courses (Brown, Baillie, & Fraser, 2009; Kowai-Bell, Guadagno, Little, Preiss, & Hensley, 2011; Li & Wang, 2013) and trusted them when making course selections (Davison & Price, 2009). Furthermore, RMP’s popularity has been growing (Swiggard & Seidel, 2012). In 2017, RMP reported that 1.7 million professors were listed and, on average, more than 4 million students used the website per month ().
In the last decade, several studies have been conducted to assess how students evaluated their professors on RMP or similar websites based on students’ numerical ratings (e.g., Brown et al., 2009; Clayson, 2014; Coladarci & Kornfield, 2007; Otto et al., 2008; Timmerman, 2008). Yet little research has been conducted that analyzes students’ written comments on websites (e.g., Gregory, 2012; Kindred & Mohamed, 2005). This is due to a lack of tools for analyzing a large amount of qualitative data. Recently, the computerized text-mining technique has emerged for use in analyzing qualitative data, enabling researchers to extract terms and phrases automatically and to find relationships between those linguistic resources to reveal patterns and to identify important features in them. One strength of using text-mining techniques is that they can be used for unstructured written documents with no special composition requirements, whereas classical data analysis techniques use structured data such as ordered numerical or categorical data. Thus, text-mining techniques have been used in organizing data, finding and predicting patterns in data, and conceptualizing knowledge from massive unstructured qualitative data sources (Weiss, Indurkhya, & Zhang, 2010). Another strength is that they reduce the time required to analyze large amounts of written documents (Sherin, 2013).
The purpose of this study is to investigate what students were reporting on RMP and what aspects of professors they credited as good or bad; the results of the study may provide physics professors with another source for advancing their instruction. This study differs in three ways from previous studies that used students’ evaluations on the same website. First, student ratings differ across disciplinary areas (Felton, Mitchell, & Stinson, 2004), so findings from multiple disciplines might not provide specific information about students’ perceptions of their professors. The current study focused on a specific discipline: introductory level college physics. Second, students’ written comments were analyzed along with numerical evaluations. Third, the study sought to identify important attributes contributing to students rating their professors with good or bad comments. Specific research questions for this study are “What aspects in physics professors emerge from student comments on ?” and “To what extent are those aspects related to student overall ratings about their professors?”
Methods
Data
The current study focused on lecture-based introductory level physics courses in research-oriented public universities in the United States to lessen the effect of unrelated factors (e.g., course or school types, classroom setting, etc.). The criteria for selecting universities were that they should (a) be members of the Association of American Universities, (b) be public universities, (c) rank among universities with the highest research activity level according to the Carnegie Classification of Institutions of Higher Education, (d) offer lecture-based introductory level physics courses, and (e) open the course syllabi to the public. As a result, 16 public universities were included in this study (five universities in the Middle Atlantic, six universities in the Midwest, two universities in the Southwest, and three universities in the West region).
Once lecture-based introductory level Physics I or II courses were found at the selected universities, the author searched the courses on RMP to identify professors with at least 10 evaluations from 2006 to 2015. As a result, a total of 1,554 student comments along with numerical ratings were initially collected. After reading all initially collected students’ comments, the author identified 33 comments that were made about teaching assistants, not the professors. Because this study aimed to explore student ratings about their professors, not teaching assistants, those 33 comments were excluded from the analysis. As a result, 1,521 student comments along with numerical ratings for 64 professors were included in this study.
When a student attempts to evaluate a professor, RMP asks the student to rate the professor with scales from 1 to 5 (1 is the lowest score). On the basis of the rating scale, the website shows the overall quality of the professor next to the individual comment: good: 3.5–5, average: 2.5–3.4, and poor: 1–2.4. On RMP, students can also make a comment about a professor with up to 350 characters. In this study, the three overall quality scores were used to group student comments; comments were rated as overall (a) good quality (n = 895), (b) average quality (n = 223), and (c) poor quality (n = 403).
Analysis method
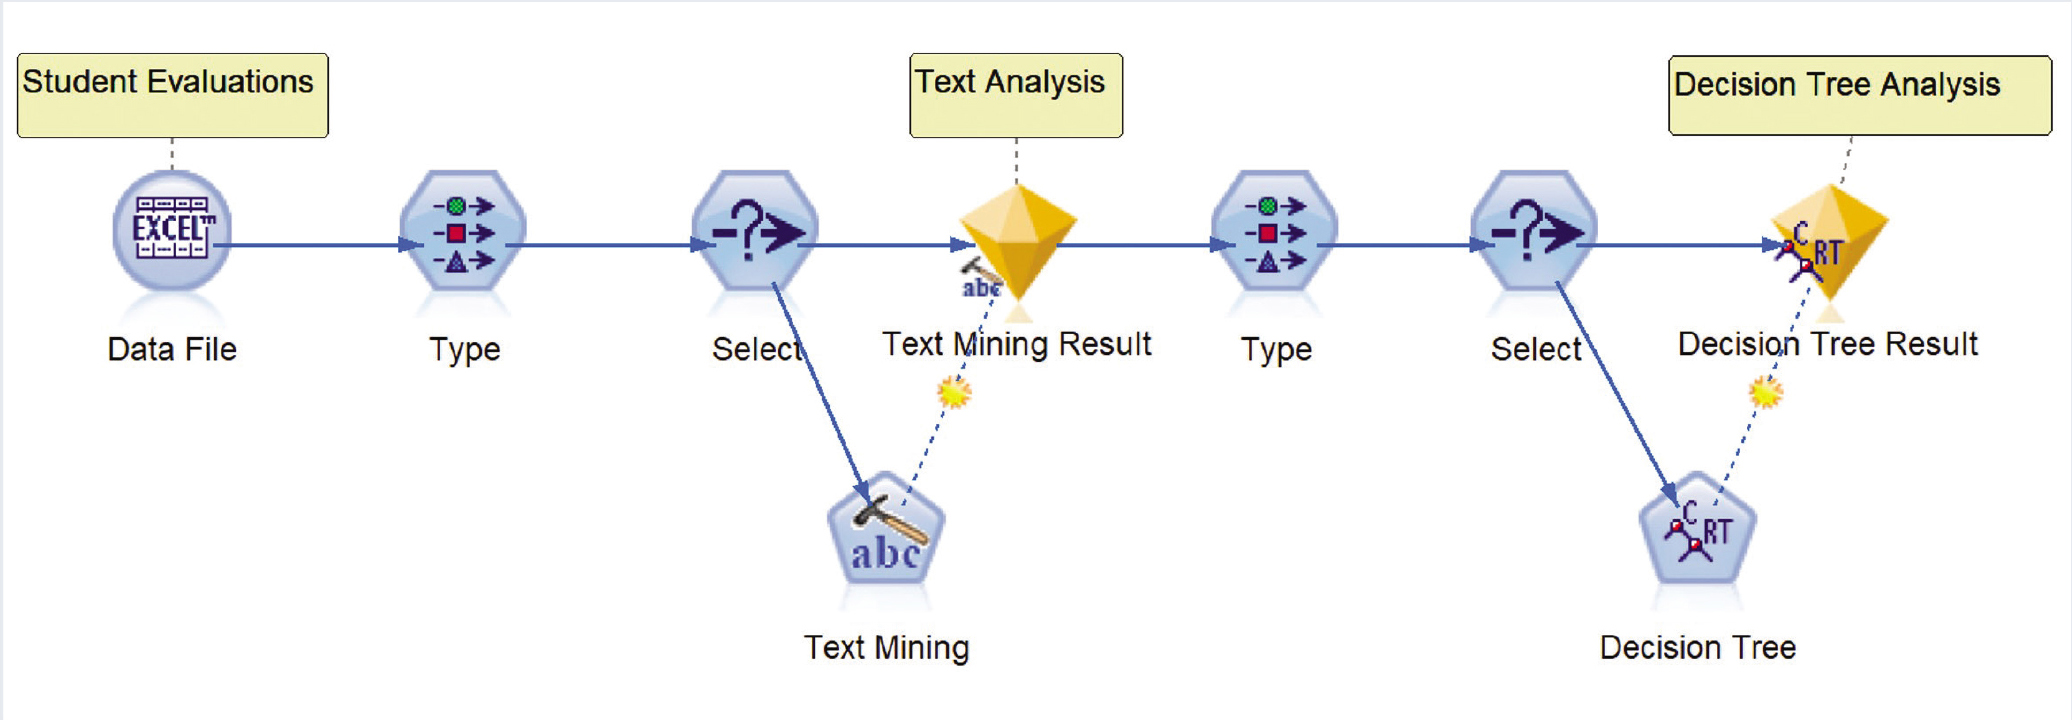
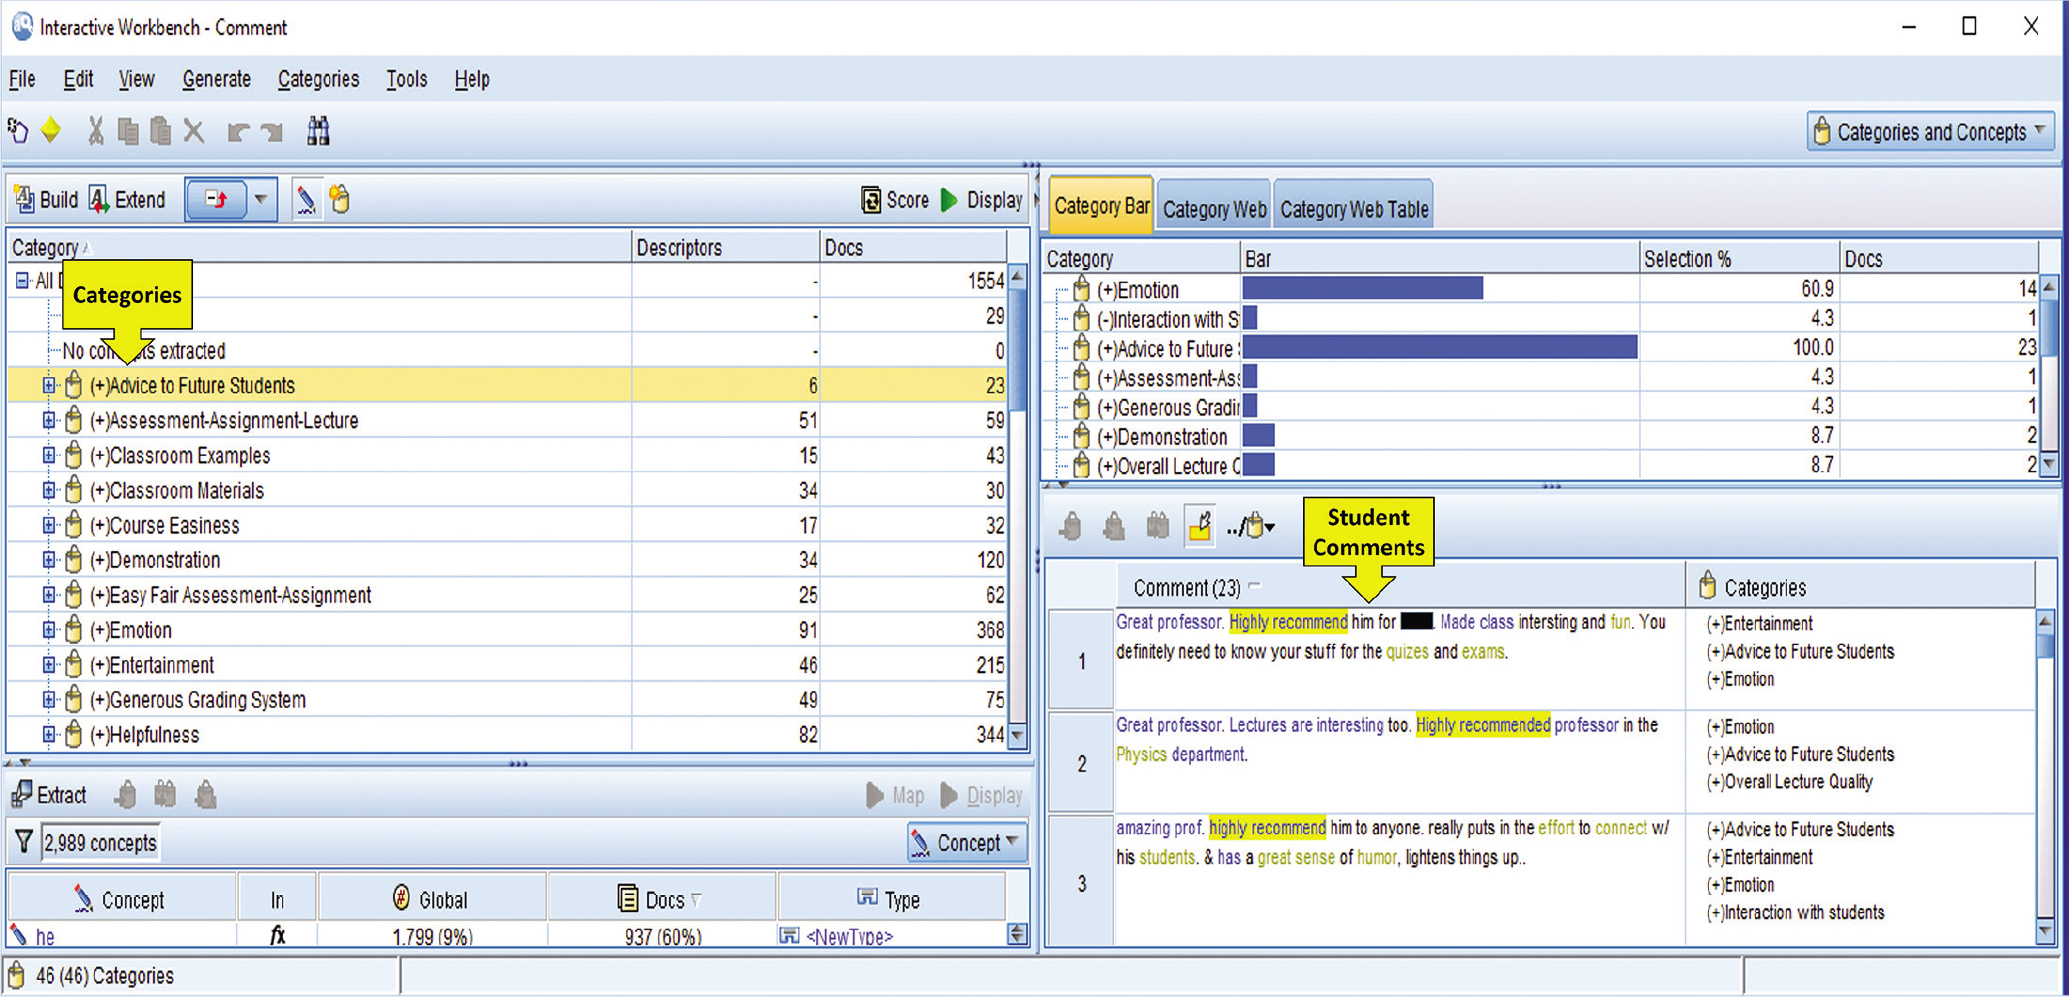
Collected data were subjected to analysis using IBM SPSS modeler (Version 18.0) with the Text Analytics software program. IBM SPSS modeler has a visual interface that allows users to build a data analysis stream. Figure 1 shows an overview of a data analysis stream for this study. Collected data were input into the stream using the “Data file” node, and words and phrases in student written comments were extracted using the text mining node. Extracted terms or phrases were grouped into categories representing common themes (see the Results section). After executing the stream, extracted results can be explored and modified by users in the interactive workbench (Figure 2). As shown in Figure 2, each student comment was classified into one or more categories on the basis of terms and phrases used in that comment.
After finalizing categories, category frequencies were investigated to compare emergent themes across the three groups. A decision tree model, the Classification and Regression Trees (C&RT; Breiman, Friedman, Olshen, & Stone, 1984), was used to see which categories were significantly attributed to the different groups. The C&RT model recursively splits the data set into two subsets by adding a new attribute so that data within each subset are more homogenous than in the previous one. If a new attribute does not contribute to differentiating the two subsets or if the homogeneity criterion for each subset is reached, the process stops, which enables researchers to identify attributes that really matter in differentiating two subsets. When constructing a decision tree, it uses target values (i.e., response variables) and several attributes (i.e., predictor variables). In this study, categories were used as attributes, and groups of comments were used as target values.
Results
Category development
In total, 21 categories were developed as themes emerged from student comments. They were further divided into subcategories with a positive (+), negative (–), or neutral (N) prefix to articulate each category’s meaning (Table 1). Note that the prefixes reflect students’ positive, negative, or neutral opinions about their courses or professors related to each category. For instance, example terms or phrases used to describe a professor’s nationality or English proficiency were “best foreign accent,” “accent is too strong to understand,” or “he is from Russia.” In this case, “best foreign accent” was classified into the (+) national- language category; “accent is too strong to understand” was classified into the (–) national-language category; and “he is from Russia” was classified into the (N) national-language category. Note that the comment containing “he is from Russia” did not include any other terms or phrases related to his nationality or English proficiency. Students’ comments also involved information about their course, tests, and assignment difficulty. In this case, positive and negative categories were developed to align with a description of each category. For example, the category course easiness means students’ opinions about overall course easiness, so if students mentioned the courses were easy, the comments were categorized with positive course easiness. If they mentioned that their courses were difficult or not easy, the comments were classified into the negative course easiness category.
| Category description, frequency, and examples. | |||||||||||||||||||||||||||||||||||||||||||||||||||||||||||||||||||||||||||||||||||||||||||||||||||||||||||||||||||||||||||||||||||||||||||||||||||||||||||||||||||||||||||||||||||||||||
|---|---|---|---|---|---|---|---|---|---|---|---|---|---|---|---|---|---|---|---|---|---|---|---|---|---|---|---|---|---|---|---|---|---|---|---|---|---|---|---|---|---|---|---|---|---|---|---|---|---|---|---|---|---|---|---|---|---|---|---|---|---|---|---|---|---|---|---|---|---|---|---|---|---|---|---|---|---|---|---|---|---|---|---|---|---|---|---|---|---|---|---|---|---|---|---|---|---|---|---|---|---|---|---|---|---|---|---|---|---|---|---|---|---|---|---|---|---|---|---|---|---|---|---|---|---|---|---|---|---|---|---|---|---|---|---|---|---|---|---|---|---|---|---|---|---|---|---|---|---|---|---|---|---|---|---|---|---|---|---|---|---|---|---|---|---|---|---|---|---|---|---|---|---|---|---|---|---|---|---|---|---|---|---|---|---|
|
Category frequency in three comment groups
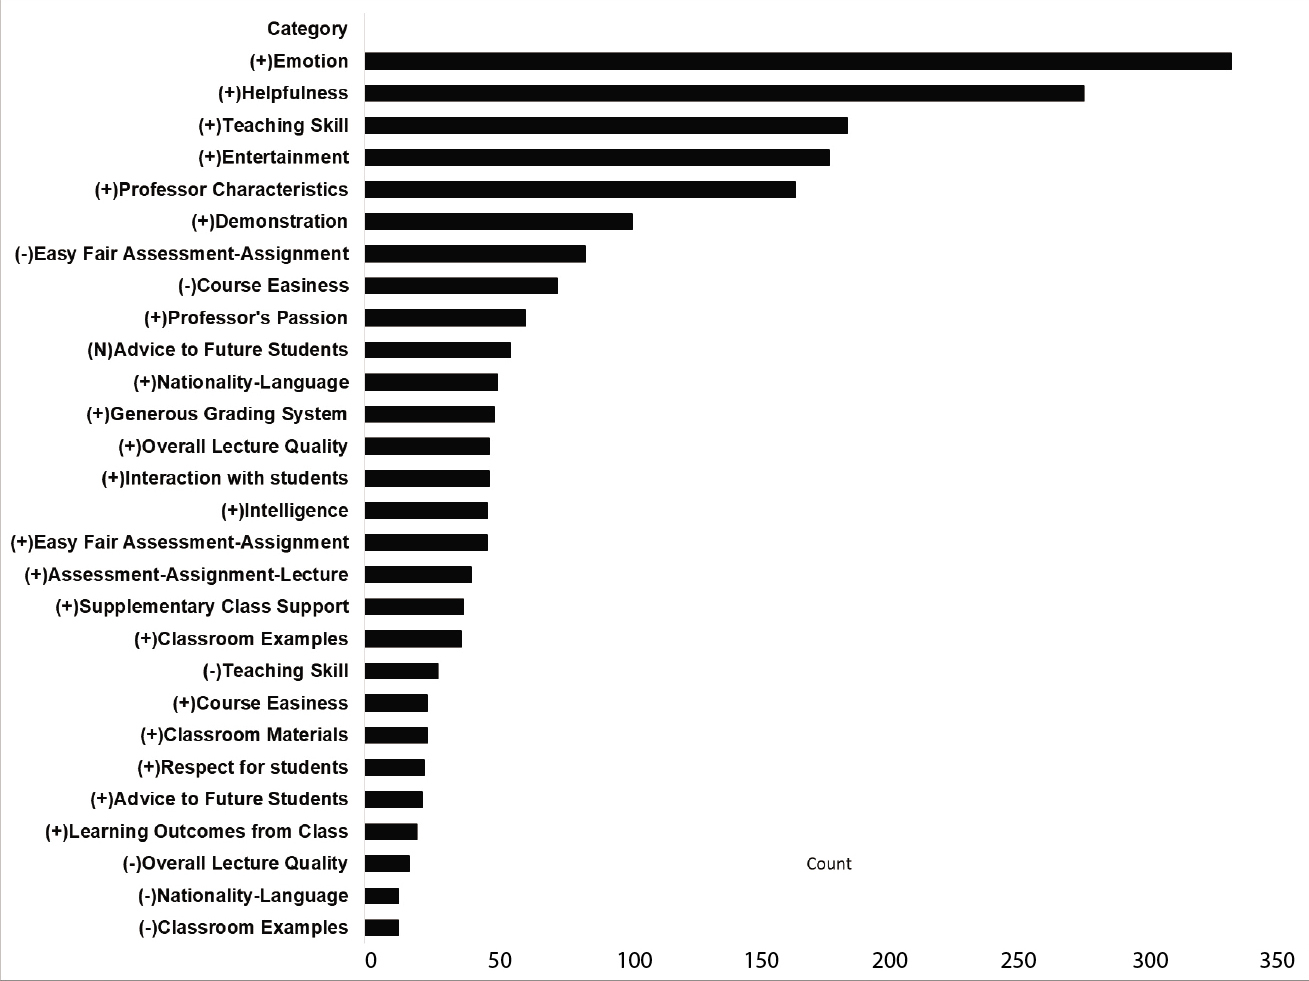
In the case of the overall good quality group (Figure 3), the top 10 categories were (+) emotion, (+) helpfulness, (+) teaching skill, (+) entertainment, (+) professor characteristics, (+) demonstration, (–) easy-fair assessment-assignment, (–) course easiness, (+) professor’s passion, and (N) advice to future students, respectively. This finding showed that many students described their physics professors as helpful and presenting physics content in understandable and enjoyable ways. They also often indicated professors’ good personality, passion for teaching physics, and application of useful demonstrations in class. Many comments in the group mentioned that their assignments and tests were difficult, and their courses were overall difficult: (–) easy-fair assessment-assignment and (–) course easiness.
Regarding the overall average quality group (Figure 4), many comments indicated that professors did not present or explain content well [(–) teaching skill], their assignments and tests were difficult, and their courses were difficult. Although the top three categories illustrated students’ negative opinions, comments contained more positive opinions on their professors’ helpfulness and characteristics than negative ones.
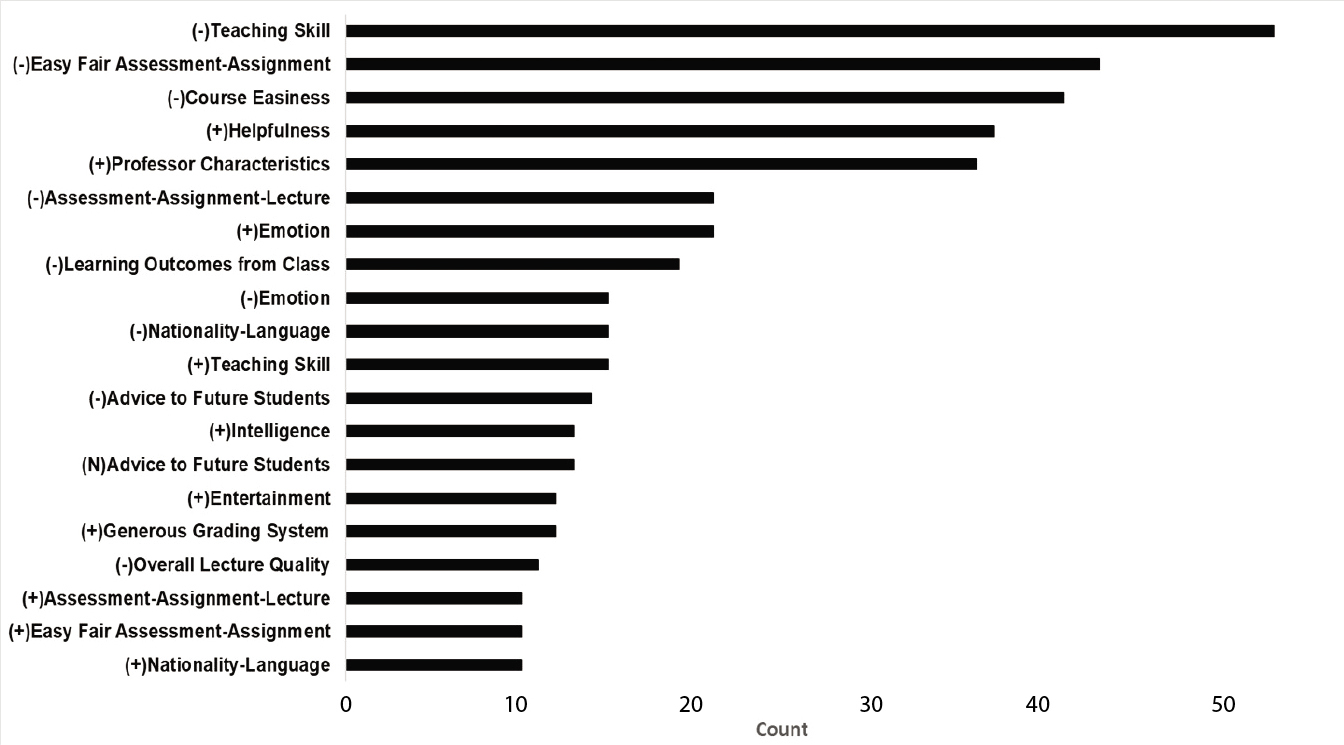
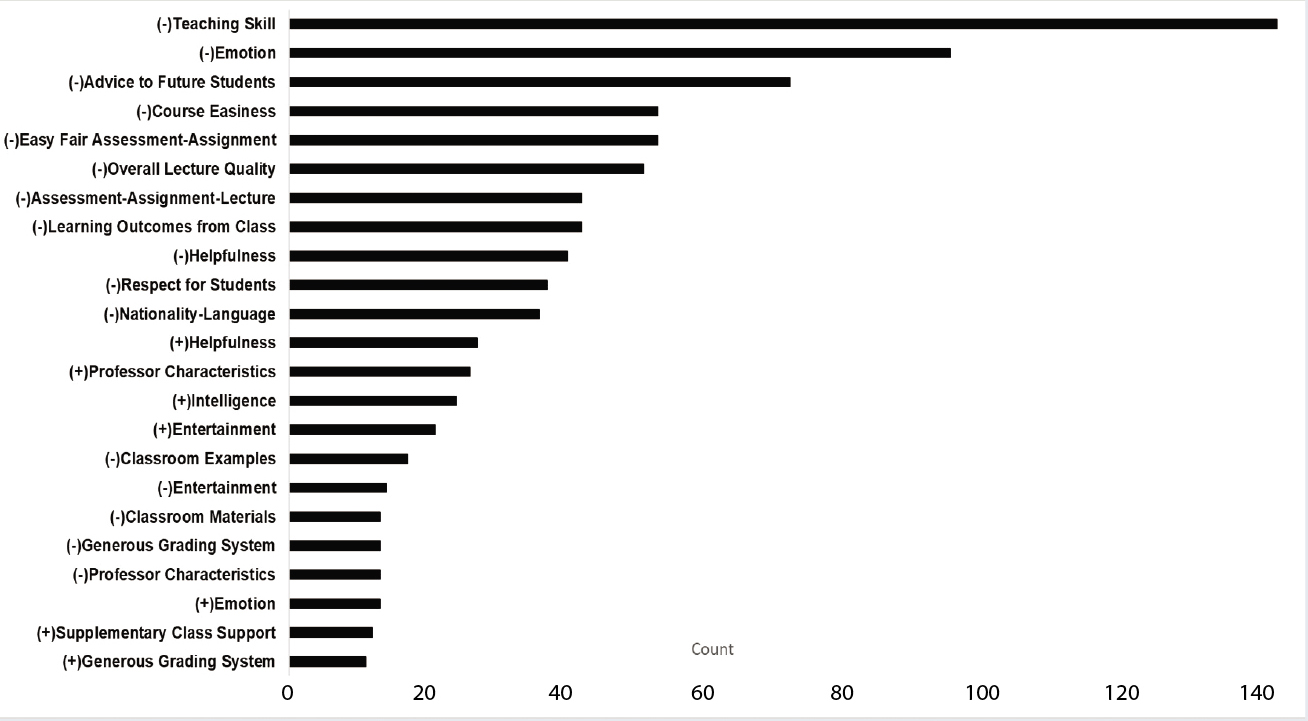
For the overall poor quality group (Figure 5), the category professors’ poor teaching skill was the most frequently found. Students expressed their negative expressions toward their professors [(–) emotion], and suggested that future students not take the course [(–) advice to future students]. Many comments mentioned that their courses, assessments, and assignments were difficult, lectures were not well presented [(–) overall lecture quality], and they felt they didn’t learn much from the class [(–) learning outcomes from class]. Students also frequently pointed out that their exams did not cover what they had learned, and assignments were not helpful for their exams [(–) assessment-assignment-lecture]. Overall, comments included more negative opinions toward professors’ helpfulness [(–) helpfulness] and attitude toward students [(–) respect for students] than positive ones.
Important attributes for overall quality ratings
To conduct a decision tree analysis (C&RT model), a target value should be binary, so two groups of student comments, that is, poor and good, were examined to determine what categories appeared as important attributes to differentiate between the two. Note that three categories, that is, advice to future students, emotion, and overall lecture quality, were excluded because they didn’t include specific aspects of their professors.
As a result, six categories appeared as important attributes to differentiate the two groups. The category (–)teaching skill was identified as the most important attribute followed by (–) learning outcomes from class, (–) respect for students, (–) assessment-assignment-lecture, and (+) helpfulness, respectively.
Figure 6 illustrates the decision tree for classifying observations based on a set of decision rules. Note that the decision tree only includes attributes that really matter in making a decision on splitting a previous data set into two subsets and ignores attributes that do not contribute to the accuracy of the tree. The following are examples of how to interpret the diagram. Node 1 with the value “0” included comments in which the category (–) teaching skill was absent, and Node 2 with the value “1” included comments in which the category was presented. In Node 2, the (–) teaching skill category was found more in the overall poor quality group of comments than its counterpart, whereas in Node 1, the category was found less in the overall good quality group of comments than in the overall poor quality group of comments. Likewise, students’ comments which were absent from (–) teaching skill (Node 1) can be further divided by (–) learning outcomes from class into two subsets (Nodes 3 and 4).
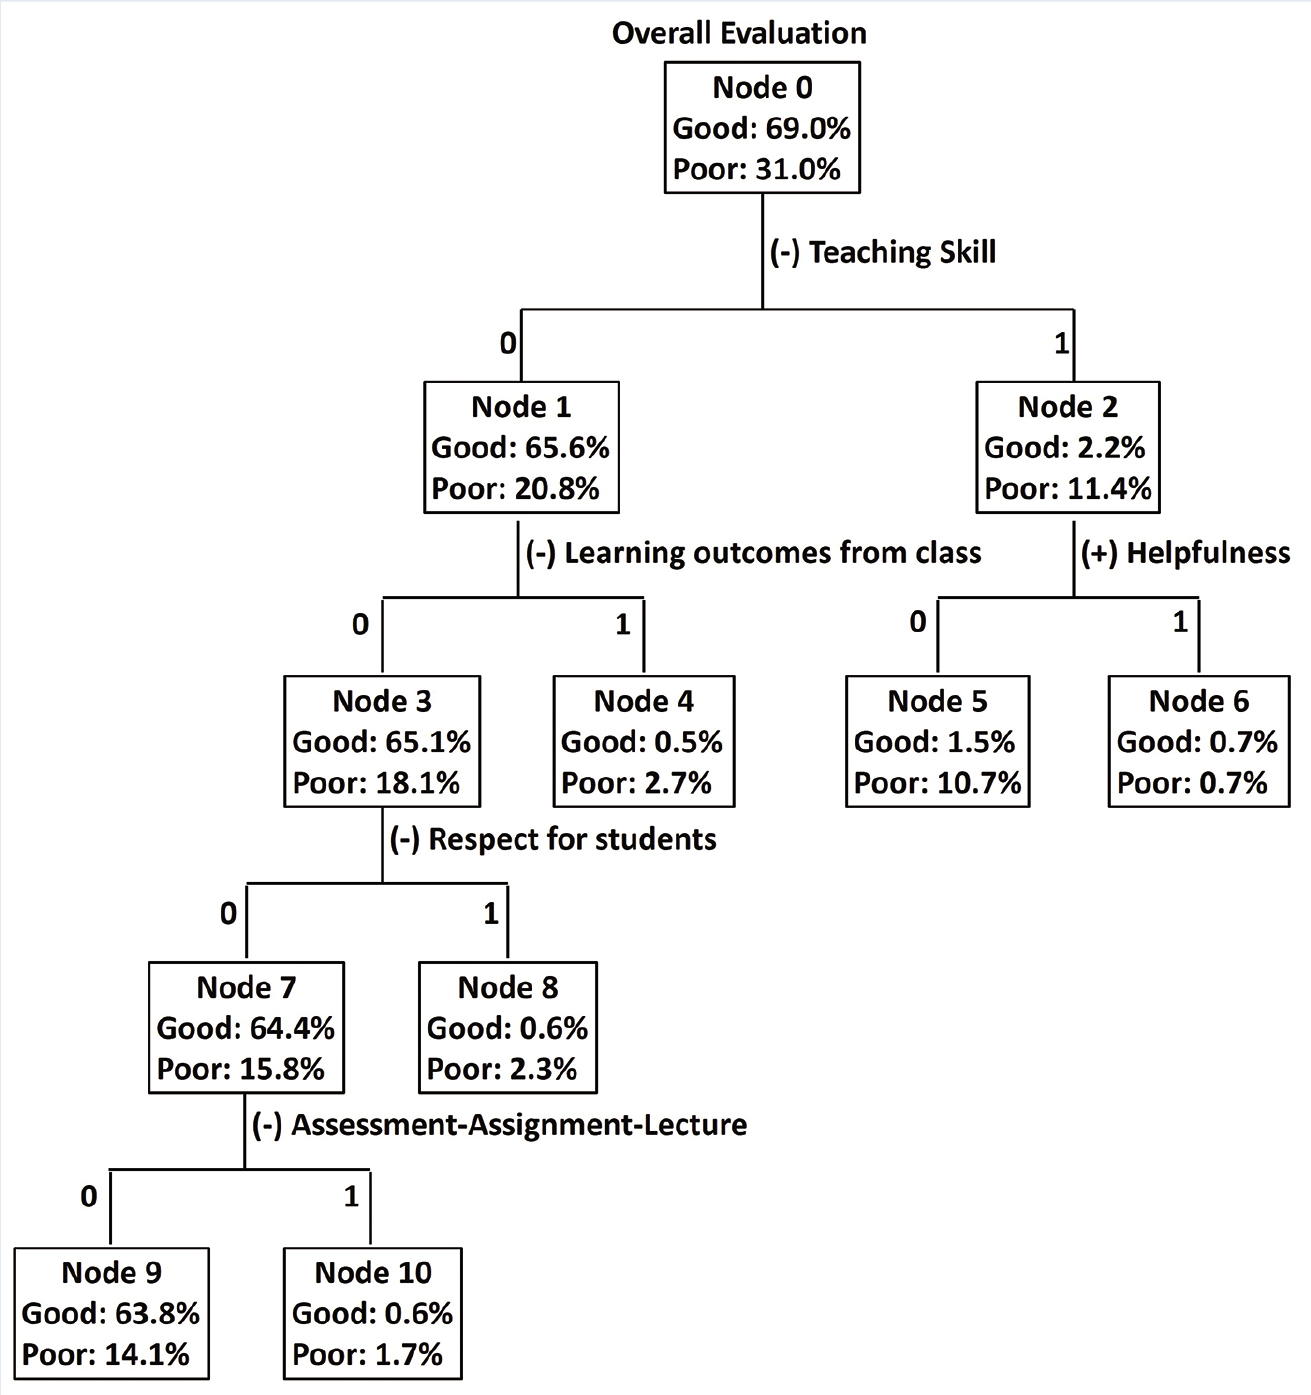
In essence, the result showed student perceptions about good physics professors who did not show poor teaching skills; did not disrespect students; and did not lack connection between lectures, assessments, and assignments.
Discussion
In the data, the number of positive evaluations was about twice the number of negative ones. This finding indicates that not only resentful students evaluated their professors on RMP, but also students who wanted to share their positive experiences. This finding was in accordance with a previous study that showed the majority of students were not abusive even though the surveys allowed students to evaluate anonymously (Tucker, 2014).
The content of student comments was investigated through a text-mining technique, leading to the development of 21 categories. The results indicate that students preferred professors who were helpful even outside of the classroom, nice and passionate in teaching physics, presented content clearly and understandably, showed good demonstrations, and created entertaining classes. Noticeably, many comments pointed out that courses and exams were difficult, implying that offering an easy course would not guarantee high evaluation results. Although Felton et al. (2004) found that students tend to positively evaluate professors who offer easy courses, the current study showed that students preferred to learn and enjoy their class and to interact with their professors, even though their courses were difficult and demanding. Similarly, Villalta-Cerdas et al. (2015) found that RMP users did not value course easiness most.
It was also revealed that students tended to evaluate their professors harshly when professors were not helpful but disrespected students and when they demanded a higher level of performance from students than the level of the lecture performed. With respect to the overall average quality group of comments, it becomes clear that professors’ helpfulness and nice personality were in play as attributes to more positive evaluations.
The decision tree analysis confirmed the findings that professors’ pedagogical aspects (e.g., how clearly and understandably they present content and how coherently they design courses across assessment, assignment, and lecture) were important attributes for students in rating their professors. In addition, students considered their professors’ nonpedagogical aspects (e.g., helpfulness and respectfulness) in their course evaluations, which is in accordance with Gregory’s (2012) study. Previous studies found that the relationship between professors and students was positively related to student outcomes such as attitudes toward courses, learning motivation, and final grades (Wilson & Ryan, 2013; Wilson, Ryan, & Pugh, 2010). The current study showed that students’ ratings about their professors were also related to the relationship between professors and students. As such, positive relationships with students should not be ignored in student learning and course evaluations, which indicates the importance of professors’ efforts in creating rapport with students. Note that RMP does not ask about the learning process or learning outcomes, and categories developed in this study are limited in predicting student learning outcomes. Although relating students’ comments to their actual learning outcomes is beyond the scope of this study, exploring what students are saying about their professors online can give professors insights into students’ perceptions of good or bad courses.
Although previous studies found that professors’ physical appearance was associated with their ratings on RMP (e.g., Felton et al., 2004; Riniolo, Johnson, Sherman, & Misso, 2006), the current study revealed that professors’ appearance was not an important attribute for students in rating their professors. Rather, students valued the way that they were taught, the connection between how they were taught and how they were assessed, and their relationship with professors regardless of the course difficulty.
Conclusion
This study revealed that students were sensitive to physics professors’ pedagogical practices (how their professors enact lectures) as well as to their nonpedagogical aspects (how they connect to students). The findings suggest that physics professors should reorganize and present scientific content to be more understandable to their students, connect their lectures to their assessments, and provide more availability for students to access them, which can contribute to building a positive relationship with students.
Note that there are limitations in this study. One limitation is that only research-oriented public universities were selected, so investigation of students’ evaluations in small colleges or private university settings is still needed. Also the study did not compare students’ evaluations to the internal formal course evaluations, so the result of the study might not be generalizable to the population of undergraduate physics students.