
Research to Practice, Practice to Research
Planning for Quality
A Research-Based Approach to Developing Strong STEM Programming
Connected Science Learning July-September 2019 (Volume 1, Issue 11)
By Lydia Peabody, Rebecca K. Browne, Bailey Triggs, Patricia J. Allen, and Gil G. Noam
Communities across the United States are working together to increase the quality and quantity of science, technology, engineering, and mathematics (STEM) learning opportunities for all youth, with special emphasis on encouraging young people from communities that are traditionally underrepresented and underserved in STEM. Our research team at The PEAR Institute: Partnerships in Education and Resilience recently completed a nationwide evaluation involving many of these communities, encompassing 11 state afterschool networks, 160 programs, 148 educators, and nearly 1,600 youth (grades 4 to 12). We found that youth who consistently participated in informal STEM activities generally reported significant positive change in science-related attitudes, but the greatest gains were reported by youth participating in programs that demonstrated the highest levels of quality in such areas as inquiry, reflection, and relevance (Allen et al. 2017). As educational researchers, these findings deepened our interest in developing new tools and trainings that can support educators in building higher impact programming.
This article shares the experience of practitioners from a southern U.S. STEM learning community who field tested a program planning tool designed to support educators in implementing high-quality STEM activities. The tool is anchored in the Dimensions of Success (DoS) Framework and focuses on key pedagogical principles including Features of the Learning Environment, Activity Engagement, STEM Knowledge and Practices, and Youth Development in STEM (Shah et al. 2014). The article will describe how educators incorporated this tool into their planning and continuous improvement efforts, how activities changed when educators used the tool for planning, and promising qualitative and quantitative evidence of the tool’s positive impact on quality. We will conclude with a summary of lessons learned from the feedback we received from practitioners, and will discuss areas of future improvement and research.
How can we define quality STEM programming?
One challenge that educators, schools, and programs often face is forming a shared definition and understanding of quality. In 2009 The PEAR Institute received funding from the National Science Foundation (NSF) to help educators define and measure the quality of informal STEM programming, in collaboration with Educational Testing Services (ETS) and Project Liftoff. The resulting DoS Framework consists of four evidence-based domains encompassing 12 dimensions for quality STEM programming (see Figure 1). The DoS was informed and influenced by prior research-based frameworks for informal STEM learning, including the Framework for Evaluating Impacts of Informal Science Education Projects, which is a framework from the National Research Council, and the Next Generation Science Standards (Friedman 2008; Bell et al. 2009; NGSS Lead States 2013). The DoS Framework has gained wide acceptance across the United States, with more than 1,460 individuals who were trained in 40 states now using DoS tools. This growth has included adaptations for in-school use, as districts and communities have worked to create consistent language and vision to better coordinate across educational environments.
Figure 1
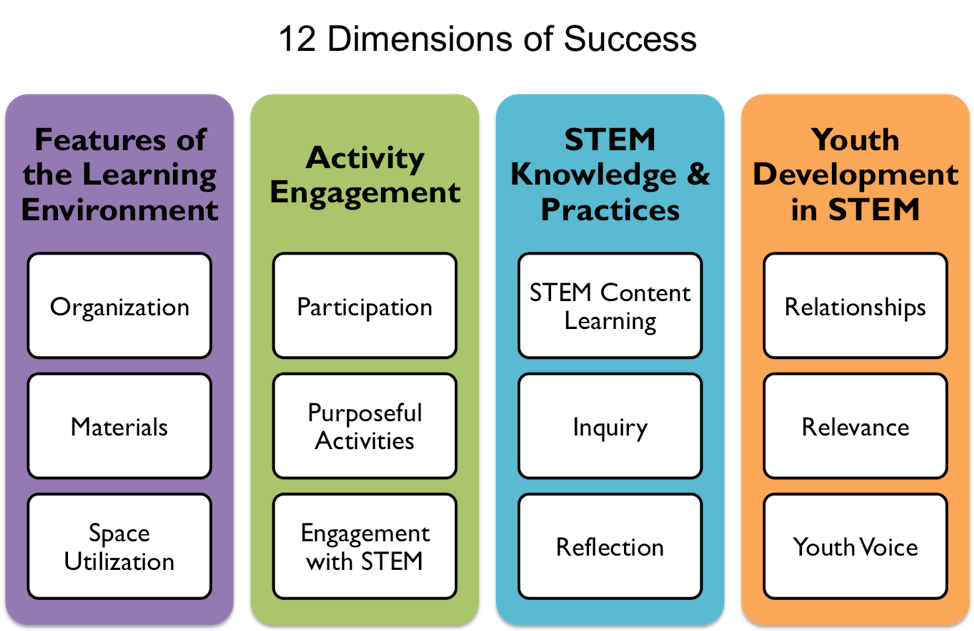
The DoS Observation Tool was developed to allow a trained observer to assess the quality of a STEM activity session by using a set of rubrics for each of the 12 DoS dimensions (Shah et al. 2018). The 12 DoS dimensions fall in four broad domains: Features of the Learning Environment, Activity Engagement, STEM Knowledge and Practices, and Youth Development in STEM. Features of the Learning Environment focuses on factors that that make a session suitable for STEM programming (e.g., do kids have room to explore and move freely, are the materials exciting and appropriate for the topic, is time used wisely and is everything prepared ahead of time?). Activity Engagement looks at how the activity gets students involved in STEM (e.g., whether all students are getting opportunities to participate, whether they are engaging with STEM concepts). STEM Knowledge and Practices looks at how the informal STEM activities are helping students understand STEM concepts, make connections, and participate in the inquiry practices that STEM professionals use (e.g., collecting data, using scientific models, building explanations). Finally, Youth Development in STEM assesses the student–facilitator and student–student interactions, how they encourage or discourage participation in STEM activities, and whether the activities make STEM relevant and meaningful to students’ everyday lives. Together, these 12 dimensions capture key components of a STEM activity in an informal afterschool or summer program.
The tool provides two levels of information for each of the 12 dimensions: (1) qualitative data, including quotations and objective descriptions of the activity results, and (2) quantitative data based on a 4-point rubric (where 1 = evidence absent and 4 = compelling evidence). These data help programs understand their strengths and weaknesses to inform their improvement efforts. Table 1 below gives examples for a few sample dimensions of higher and lower quality, to provide the reader with a sense of how quality is discussed using this framework. To support the reliability and validity of the rubrics, observers participate in an extensive training and certification process before using the DoS Observation Tool.
Table 1
Examples of higher quality and lower quality STEM activities for selected DoS Dimensions, as described in the DoS Program Planning Tool
How can we plan for quality to enhance STEM learning?
In formal education, preservice teacher education often includes intensive training on curriculum development and lesson planning. This is not the case in informal education, where activity leaders come from a wide range of educational and professional backgrounds and there are few required qualifications (Allen et al. 2017). When STEM education was named a national priority in 2009, many afterschool programs shifted their focus to include more engaging STEM learning opportunities in their programming (U.S. Department of Education 2010). The availability of tools, trainings, and professional development opportunities in the informal STEM space lagged behind the demand (Noam and Shah 2013). Experts in curriculum design and lesson planning for STEM activities are rare in afterschool programs (Freeman, Dorph, and Chi 2009). Adapting existing formal educational materials for informal purposes can also be difficult: school day lesson planning templates are designed for teachers who have completed formal training in lesson planning for their subject area, and may not provide enough support for an informal educator new to STEM activities.
As use of the DoS Observation Tool has increased over the years, practitioners began requesting tools to support quality improvement. Activity leaders and educators wanted to be able to plan for quality, rather than waiting until after an observation to identify opportunities for improvement. Based on this feedback, our research team at The PEAR Institute developed the DoS Program Planning Tool (PPT). The PPT has been used successfully in programs ranging from preK to high school, but the research basis for the underlying DoS framework is strongest in grades 4–8.
One of our goals in developing the tool was to create access to high-quality programs for youth from a wide range of backgrounds, by providing key elements of STEM learning to programs with limited access to financial or STEM-specific human resources. Use of the PPT prompts programs to think about whether materials are appropriate for all youth in the program and how to ensure that all participants will have equal access to activities. Additionally, it helps students understand the realities of STEM professions and combat stereotypes around STEM identity (e.g., the image of a scientist as an older white man in a lab coat).
What does a program planning tool for informal STEM learning look like?
The PPT is freely available to download from The PEAR Institute’s website. The PPT includes the following resources:
- Brief summaries explaining each DoS dimension, examples of high- and poor-quality practices (see Table 1), and video examples of higher quality practices;
- Guidance on identifying a strong STEM learning goal;
- Activity Planning Map: A series of prompts to encourage incorporating DoS dimensions into lesson planning;
- A story style example of how to transform a STEM activity using the Activity Planning Map;
- Unit Planning Map: A series of prompts to plan multisession units with strong learning goals for the overall unit and each session; and
- Resources for curriculum and professional development.
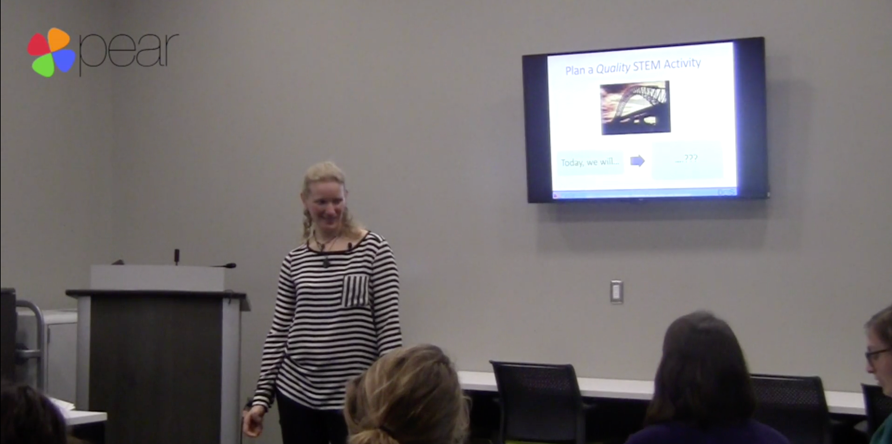
The summaries, examples, and resources included in the PPT are all designed to support the development of high-quality activities. As practitioners plan a lesson, the prompts in the Activity Planning Map remind them to incorporate all aspects of the DoS Framework, or choose to intentionally leave an element out for this particular lesson. Educators have used the PPT to encourage developing specific dimensions, as a reminder of the variety of elements they want to incorporate, and as a checklist to make sure that they are including as much as possible in each lesson. This video from the Iowa Children’s Museum will give you one example of how a program used the PPT to strengthen the quality of one particular STEM activity.
A structured field test of the DoS Program Planning tool
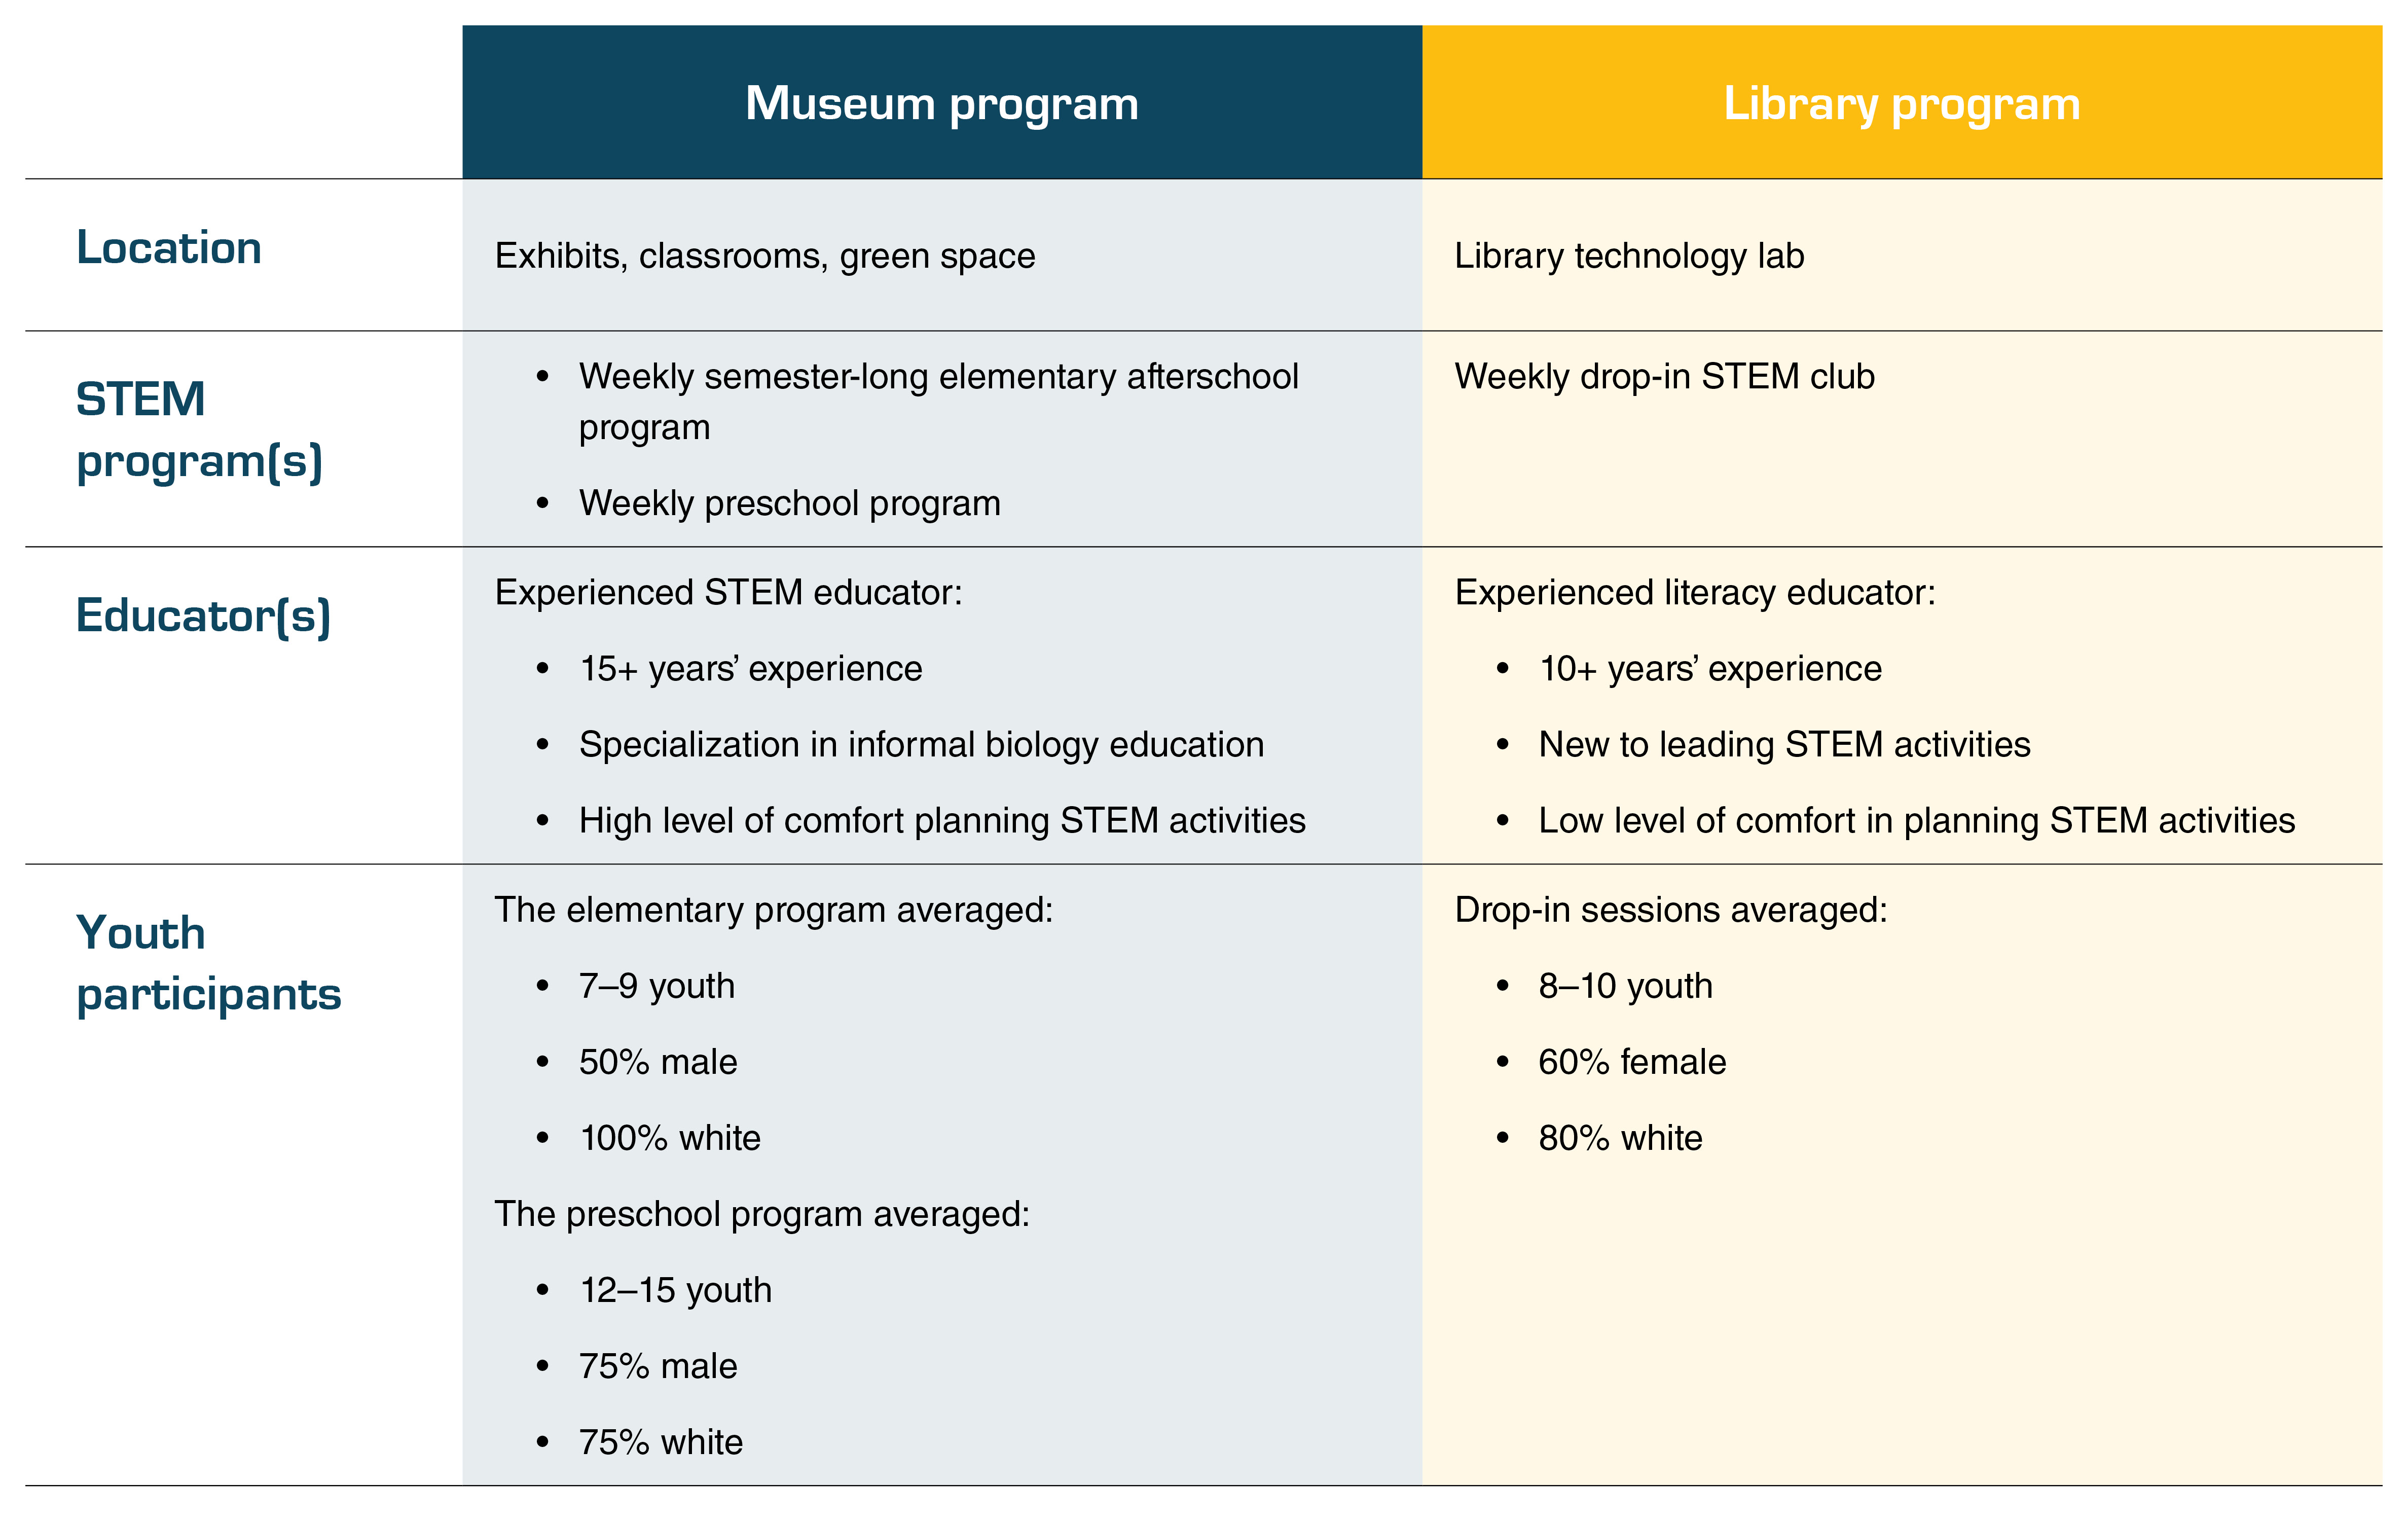
To better understand how practitioners were using the PPT, we partnered with two programs in a southern U.S. state: one STEM museum education program (referred to in this article as the “Museum Program”) and one library-based afterschool program (“Library Program”). A DoS-certified consultant completed observations and feedback sessions with these programs before and after they used the PPT.
Table 2
Details of partnering programs, including offerings included in field test, educators, and youth
What did we learn about using the DoS Program Planning Tool as part of a continuous improvement process?
The continuous improvement process involves cycles of planning, leading, observing, and providing feedback on activities (Park et al. 2013). To allow us to examine the level of change driven by this process, the DoS-certified consultant completed one or two baseline quality observations at each site. The educators also completed a survey about their usual methods of activity planning and their experience and comfort with planning STEM activities prior to being exposed to the DoS Framework.
Training
 Educators attended a 2.5-hour training covering the basics of the DoS Framework and the PPT. The training agenda included videos and discussion on:
- the idea of quality and the need for a common language,
- understanding each dimension,
- example lessons and how to incorporate each dimension,
- overview of the PPT,
- planning a lesson using the PPT with a sample activity, and
- discussion of addressing challenges participants expect while using the PPT.
Following the training, each educator planned a lesson using the PPT and completed an interview with the consultant about their planning process. They were then observed by the consultant when presenting the activity and received feedback from the consultant’s observation of the quality of their activity’s elements. This cycle was repeated with at least one more activity, providing a total of four or five observations at each program. Because of differing program models, different activities were observed each time.
What was the experience of the practitioners using the PPT?
The educators in the Museum and Library Programs were both experienced informal educators but had different levels of comfort planning STEM activities. One educator came from a STEM background, and the other came from a literacy background. In this section we look at their qualitative responses to our interview questions, as well as the quantitative evidence of quality that was observed by the research consultant before and after the use of the PPT.
Results from the Experienced STEM Educator
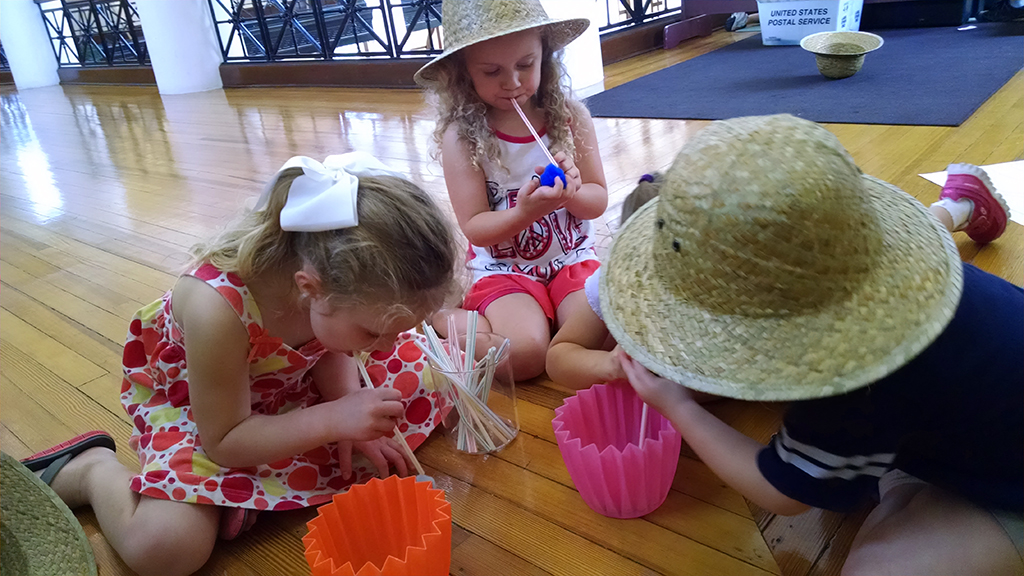
In the baseline observation of the museum activities, youth in a mixed group that ranged from preschool to fourth grade completed three station-based activities about the Sun. They spelled out “Sun” with playdough letters, painted translucent window hangings, and made a sundial out of straws and paper plates. Each of these activities was closely guided by the facilitators. Facilitators helped youth roll out dough, asked specific questions to direct the painting (“What color do you see the most of? What do you see the least of?”), and gave specific instructions.
After using the PPT, the museum facilitator was particularly interested in expanding opportunities for Youth Development in STEM, particularly through “Youth Voice”: giving youth the power to make decisions and take ownership of their learning. The post-training observation theme was insects, and activities included:
- observing differences in preserved insects from the museum collection,
- identifying parts of insect bodies using vocabulary cards,
- looking through specimens to decide which were insects,
- creating and drawing an insect in chalk, and
- building an insect out of modeling clay.
The first three activities were similar to the pretraining activities, closely guided by facilitators using checklists and specific yes-no questions. The final two activities allowed youth to use what they learned in a creative way, implementing learning from the Youth Development in STEM domain. This change presented a challenge to facilitators as youth became more interested in the drawing and building aspects of the activity. To help them work toward their learning goal, facilitators used suggestions from the STEM Knowledge and Practices domain, encouraging youth to continue to think about their choices in an insect-based context rather than exclusively making artistic decisions.
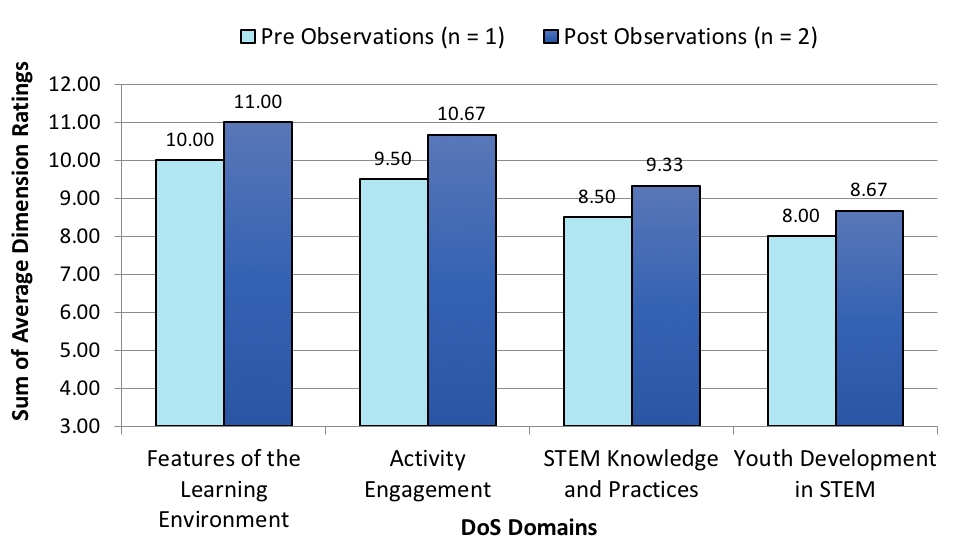
For the experienced STEM educator, the DoS Framework and PPT training was a “great refresher” which reinforced her prior training and experience with existing systems. According to the educator, the PPT “makes sense,” was “easy to follow,” and “mirrors a lot of lesson planning,” which she found “really nice.” She also felt that the PPT encouraged her to try ideas outside of her usual comfort zone, such as giving youth greater control over their learning. This matches what we saw in the quantitative data: the pretraining observations showed that she was already incorporating many of the elements of the DoS Framework into her program, but that working with the PPT as part of a quality improvement process supported further positive change, especially in the areas of Participation, Inquiry, and Youth Voice. Youth Voice is a challenging dimension to shift—our nationally representative data find it consistently among the lowest rated (Browne et al., unpublished manuscript)—but here, the shift in rating in Youth Development in STEM from baseline to post-training was driven by a 43% difference in the DoS rating for Youth Voice. This indicates that this educator’s focus was helping to move her programs toward more youth choice and ownership of learning.
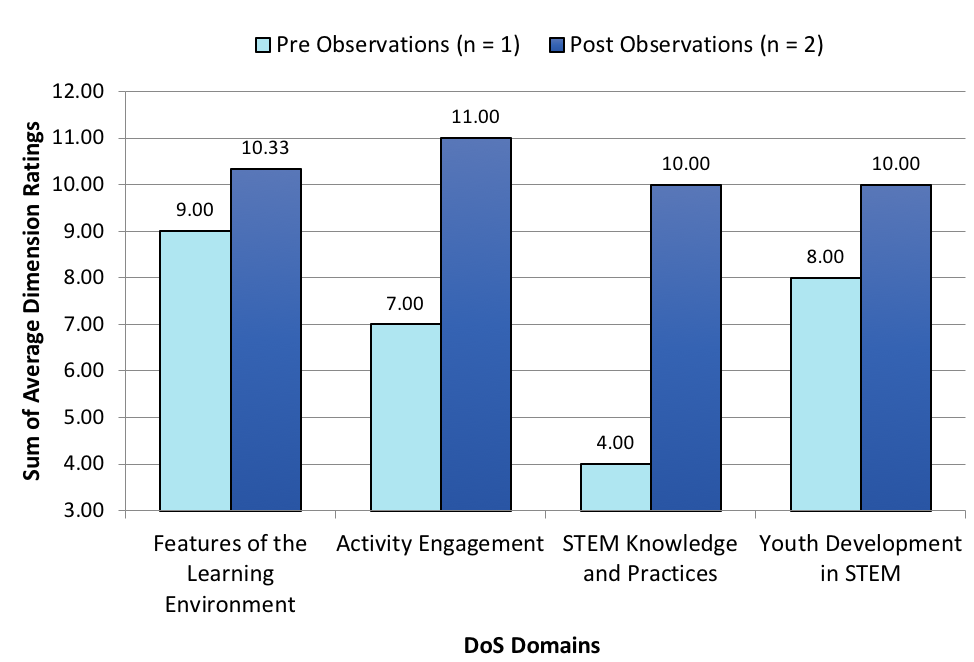
Figure 2
Program quality levels for the Museum Program before and after use of the PPT Results are calculated by taking the sum of the three average DoS dimension ratings (1-4) for each domain.
Results from the Experienced Literacy Educator
The library program is a drop-in technology program, aimed at increasing youth interest and strengthening skills in computer programming and engineering. During the first observation, youth were creating computer games using an app called Bloxels on iPads. The goal of the activity was to build a game, without design challenges or other specific learning objectives. Youth primarily focused on creating interesting-looking characters and worlds while the program facilitator provided guidance on how to find things in the app menu.
The literacy educator running this technology program found using the PPT challenging at first, describing it as “overwhelming until you start doing it.” The PPT presented a lot of new ideas to consider and added an extra layer to her planning process, but her experience in education enabled her to adjust to the DoS Framework and PPT with minimal support. As someone who took on leading a STEM program without a STEM background, she learned that she was following a common trend—focusing on providing the students with a fun activity, rather using the activity to promote learning. When she planned her activities using the PPT, she focused intentionally on the Purposeful Activities dimension (making sure activities connect to a STEM learning goal rather than just being fun), an element of the Activity Engagement domain, to address the gap she found in her activities. This focus naturally lead to changes in the STEM Knowledge and Practices domain.
During the post-training observation, youth were tasked with designing and building chariots out of Sphero robots. This time, the facilitator started with an introductory activity featuring two sample chariot robots on a track, inviting youth to explain why they thought one robot or the other would win. After watching the sample robots race, youth were presented with a design challenge and constraints: They were to design, build, and test a robotic chariot to race on the track. The chariot needed to use one Sphero and have exactly two wheels, a “driver” riding in it who cannot fall out during the race, and a detachable yoke. Having a specific design challenge both improved the learning focus for Activity Engagement and supported elements of STEM Knowledge and Practices.
During the build phase, the facilitator focused on how youth were meeting the design goals, asking them to explain their design elements and what they modified based on their tests. Using the PPT for planning influenced how the facilitator interacted with youth to encourage design thinking, leading to higher ratings in Reflection, another piece of STEM Knowledge and Practices.
In Figure 3, we can see a clear correlation between the areas showing significant change and the educator’s intentional use of the PPT. Quality improved from pre- to post- observations across all four domains, but the increase in STEM Knowledge and Practices is particularly notable, at a 150% positive increase across the STEM-specific dimensions of STEM Content Learning, Inquiry, and Reflection.
Figure 3
Program quality levels for the Library Program before and after use of the PPT Results are calculated by taking the sum of the three average DoS dimension ratings (1–4) for each domain.
What did we learn from this field test?
For both the Museum and Library Programs, we observed positive shifts in DoS program quality ratings across all dimensions when the PPT was used as part of a continuous improvement process. These preliminary findings provide promising indications about the value of this tool.
When we combine the results of this field test with feedback from other educators using the PPT, we find that the tool helps practitioners focus on their activities’ STEM learning goals. This is important because many afterschool STEM programs present hybrid content (e.g., combining arts and crafts with a STEM activity), and a tool that helps practitioners focus on content can support STEM learning objectives.
STEM educators reported that they felt comfortable with the tool at a faster rate than educators from other backgrounds, but all experienced educators reported that they were able to align the PPT with their existing lesson planning. For example, the non–STEM trained librarian reported that the ideas presented in the DoS Framework were new to her, but because the PPT aligned with her lesson planning process, she was able to incorporate the new information.
Individuals with less education experience, including STEM industry professionals and undergraduate students who were supporting curriculum development and delivery, reported that they needed significant support to understand how to fit the pieces together. Without a prior understanding of lesson planning and working with youth, the PPT provided too broad of a range of prompts, resulting in a lack of clear focus in lessons. They were able to successfully use the PPT when coached by a more experienced educator on key areas of focus.
It appears that additional differentiated training is needed to support effective usage of the PPT for a wider range of practitioners. It is important to us that the PPT is useful for educators both with experience leading STEM activities and without. Because of the high staff turnover rate in informal STEM programs, freely available and practical evidence-based tools and trainings are essential to support those without formal backgrounds in STEM education to ensure the quality of STEM learning experiences for youth.
While this initial study has had some intriguing indications, future work is needed to more rigorously test improvements in quality related to the PPT. Because the programs in this initial field test came from a small sample based in one state and were therefore not representative of the diversity of educational environments available across the country, future research must be conducted to understand the PPT’s impact on equal opportunity. As more communities create intentional connections across STEM learning environments through learning networks and communities, interest in using the PPT in school has followed, with some networks including school day teachers in training cohorts. As in-school use is recent and limited so far, future research should also include in-school educators. The better we understand the factors contributing to quality improvement, the better the field will become at creating opportunities for all youth to experience high-quality STEM activities.
Lydia Peabody (pear@mclean.harvard.edu) is STEM learning specialist of The PEAR Institute at Harvard Medical School and McLean Hospital in Boston, Massachusetts. Rebecca K. Browne (rkbrowne@mclean.harvard.edu) is STEM projects specialist of The PEAR Institute at Harvard Medical School and McLean Hospital in Boston, Massachusetts. Bailey Triggs (btriggs@mclean.harvard.edu) is senior manager of communications and knowledge management of The PEAR Institute at Harvard Medical School and McLean Hospital in Boston, Massachusetts. Patricia J. Allen (pallen@mclean.harvard.edu) is senior manager of research and evaluation of The PEAR Institute at Harvard Medical School and McLean Hospital in Boston, Massachusetts. Gil G. Noam (Gil_Noam@hms.hrvard.edu) is founder and director of The PEAR Institute at Harvard Medical School and McLean Hospital in Boston, Massachusetts.
Administration STEM Informal Education