
Feature
Connecting Learning Through Citizen Science in the Classroom, Community, and Online
Connected Science Learning April–June 2020 (Volume 2, Issue 2)
By Alexandria Brasili and Ruth Kermish-Allen
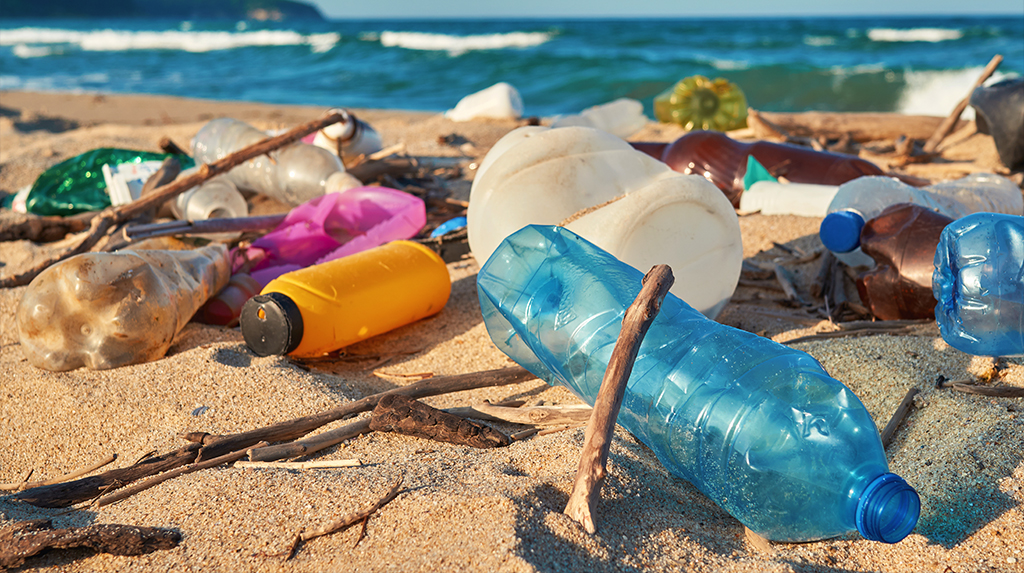
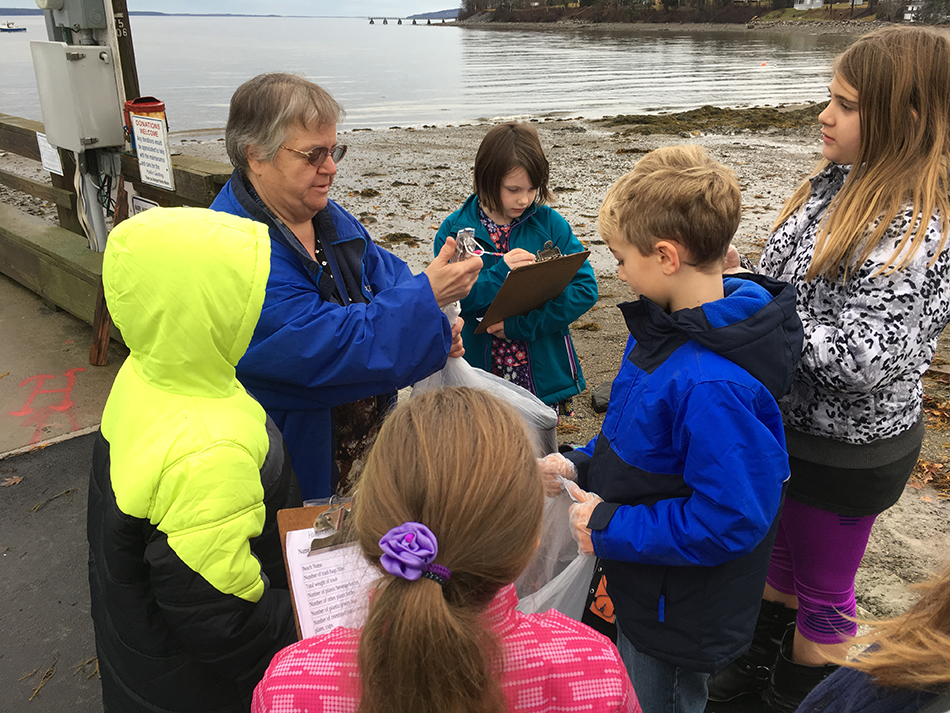
A group of third-grade students flocks to the beach behind their school, equipped with rubber gloves, trash bags, and clipboards. Teachers and parent volunteers are interspersed throughout the group, discussing how to divide up the beach areas to collect the most representative data. The students spread out to collect trash that has accumulated on the beach, but instead of just throwing it into the bags, they carefully document what they are collecting: plastic bottles, cigarette butts, fishing line, etc. One student, Ava, keeps a running tally of the trash she and her partner are collecting on her clipboard. The plastic trash categories are divided into beverage bottles, other bottles (e.g., bleach, oil), utensils, bags, and others.
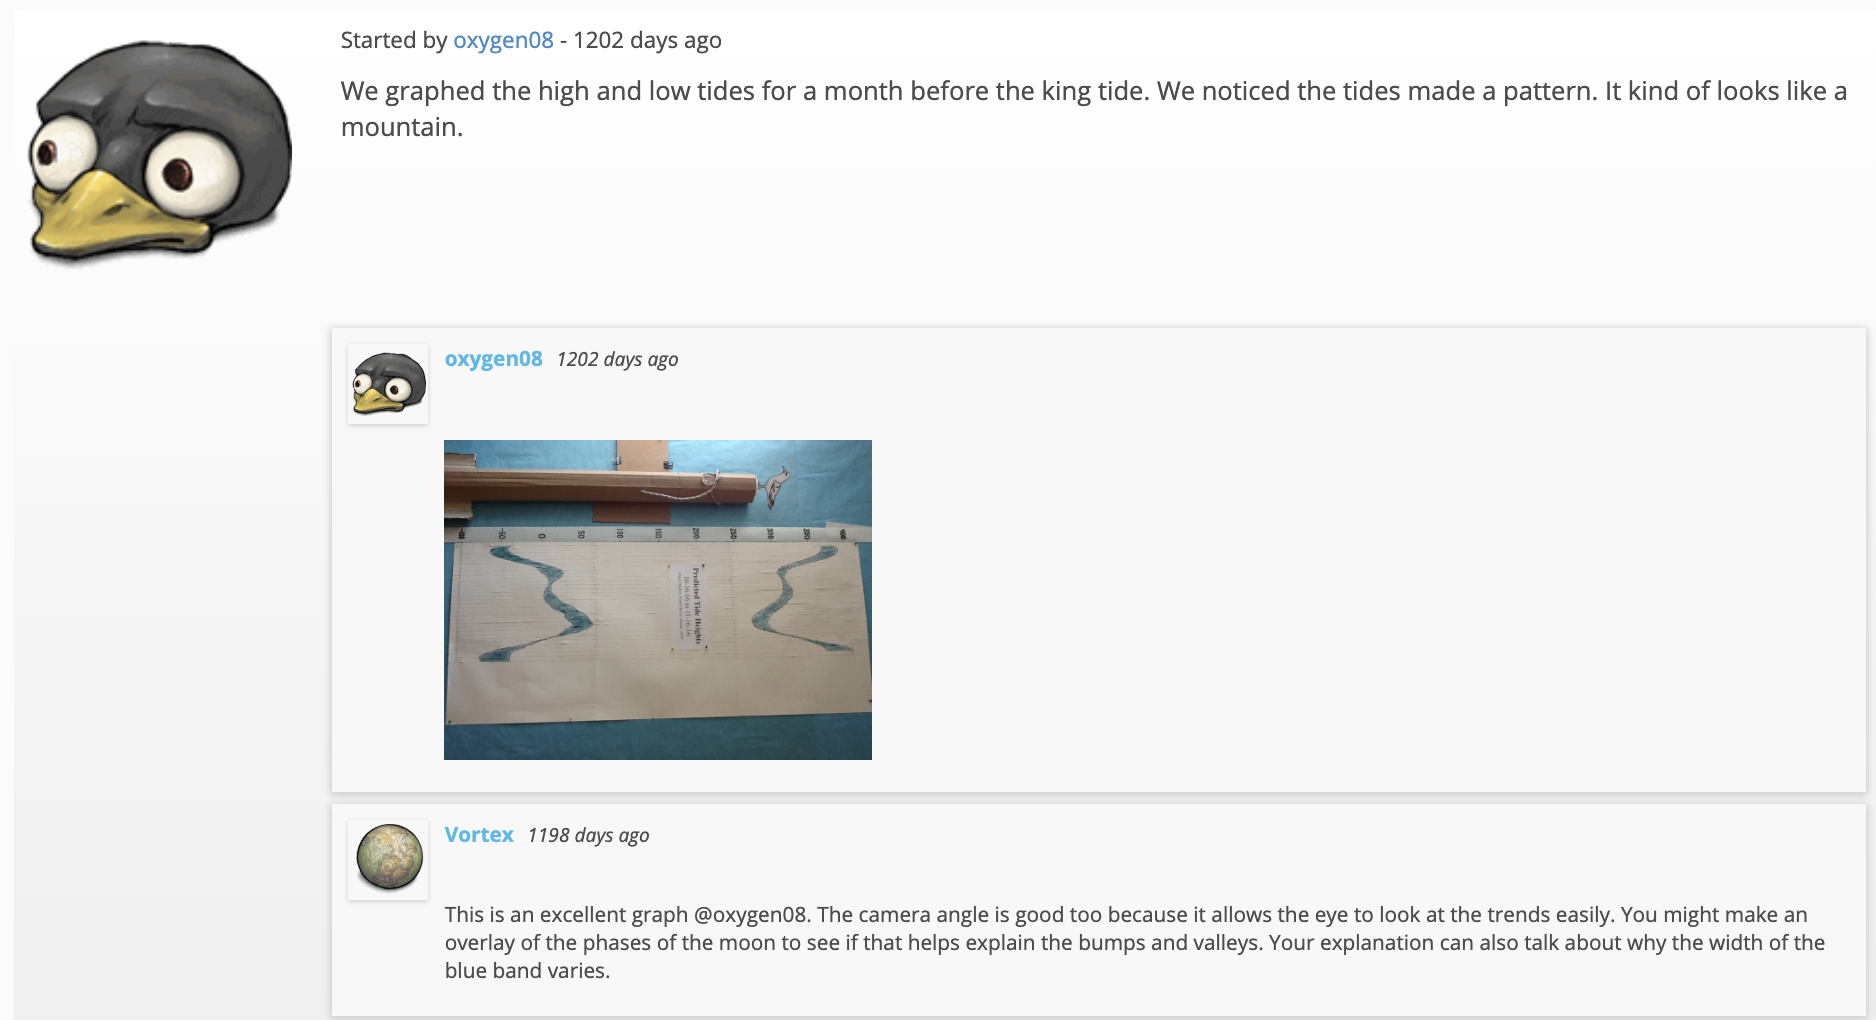
Upon returning to the classroom at the end of the day, the groups weigh their bags of trash to determine the total weight collected and the total number of pieces of trash. Their teacher helps them put their final tallies on the whiteboard and instructs them to work together to create some representation of the data to share with others in the online WeatherBlur community. Ava and her partner decide to create a pie chart of the different types of plastics they found on the beach. They post their graph online with the caption, “The percentage of types of plastics found. A little more than half of the items found were in the category of ‘other.’ The least amount of plastic items were grocery bags. This may be because places in the state of Maine now charge for plastic bags and people are more careful with their plastic bag trash.”
The next day, a community member with the screen name “indigolady” comments on the post, “A pie chart is an excellent choice for this type of data. What types of ‘other’ plastic did you find?” A few days later, teachers set up a Zoom videoconference meeting for students from several coastal schools participating in the same WeatherBlur beach trash investigation. They discuss similarities and differences in the types and amounts of trash each school has found at local beaches, referencing the data and initial analyses posted throughout the week. The collaboration allows the students from Maine to move closer to answering their investigation question of how the geographic location of a beach in the state affects the amount and types of trash that wash up on the shore over several weeks.
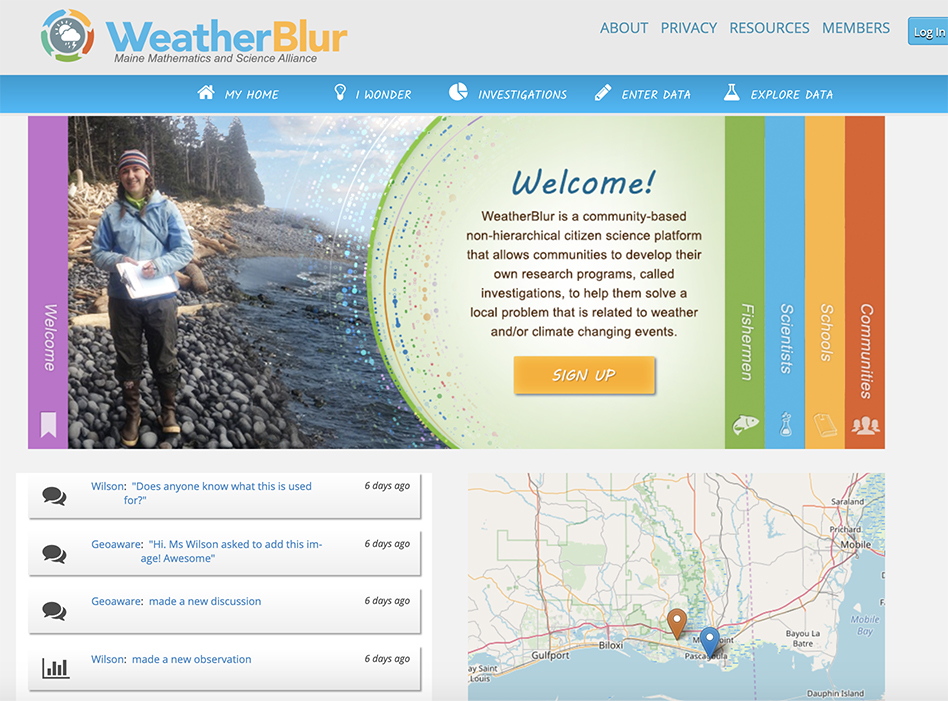
WeatherBlur website.
The above is an example of a day in the life of a WeatherBlur project, a place-based, nonhierarchical, online citizen science community that allows members to ask each other questions, collaboratively design scientific investigations, go out into their own communities to collect data, and report their findings to discuss with each other. The WeatherBlur platform brings together students, teachers, community members, and scientists as equals in the process of designing and creating investigations relevant to their lives and communities. Students collaborate with each other to refine a scientific question they are interested in learning about, work with scientists to develop data collection protocols, and share their findings with their communities. WeatherBlur empowers communities to undertake a scientific approach into local issues and develop evidence-based recommendations based on interpretation of the data these citizen scientists gather. The online platform has been used in select rural Maine communities to look at the effects of a king tide on local flooding and changes to maple syrup production due to weather variability. It has also assisted the fishing community in understanding the rise and distribution of the invasive green crab population. WeatherBlur was initially developed for Maine schools, but expanded over the past year to also involve schools in Mississippi and Alabama, linking the Gulf of Maine with the Gulf of Mexico.
WeatherBlur scientists and community members have been vetted by the organization; some have participated in summer institute training alongside teachers, whereas others are simply interested and invested in collaborating with schools. WeatherBlur questions can be initiated by anyone in the community. Business leaders, elementary school students, teachers, community volunteers, and other participants can all have great ideas and local in-depth knowledge of issues that need to be addressed. The important thing about WeatherBlur is that it brings all these people together to work as equals to gather data and draw conclusions that can benefit the wider community.
Connecting citizen science to STEM learning
Citizen science initiatives allow participants to do the work of scientists—to experience the thrills of debate, new questioning, and discovery that all happen during true scientific inquiry (Bonney et al. 2009a). Some citizen science projects partner with volunteers to categorize or collect data that are predetermined by scientists, while others that allow volunteers to participate in the entire research process (Shirk et al. 2012). Cocreated citizen science projects, such as WeatherBlur, are designed in an explicit partnership between scientists and members of the public, allowing for public participants to be actively involved in most or all steps of the scientific process (Bonney et al. 2009a). Cocreated projects serve as a powerful model in which multiple groups negotiate the interwoven components of scientific inquiry, from defining the research question all the way through to asking new questions related to the findings of the investigation. For WeatherBlur, both children and adults work together to cocreate their own scientific investigations about their local communities. This innovative program also uses new momentum in the citizen science movement to take advantage of online technology as a way to gather data and make connections across communities (Bonney et al. 2009b; Connors, Lei, and Kelly 2012; Dickinson et al. 2012; Dickinson, Zuckerberg, and Bonter 2010).
Although many STEM education initiatives promote intergenerational learning between adults and children, few integrate informal science education components or engage all groups as learning partners. There are, however, multiple benefits from this type of shared learning between children and adults. In an informal learning environment, older adults may gain mental stimulation from exchanging ideas with children (Fried et al. 2004). Children can benefit from discussions with an older adult about life experiences, especially when the stories are based in the local community (Ramey-Gassert 1997). This type of informal learning increases child and adult engagement, and the entire community benefits by gaining more social cohesion due to shared learning between generations (Chasteen, Schwarz, and Park 2002). Through prior iterations of WeatherBlur, we found that when community members or scientists engaged in the project, students increased their efforts, felt confident, and began to think of themselves as providers of information, not just receptacles (Kermish-Allen et al. 2009).
In the sections below we will share a series of case studies on WeatherBlur schools in Maine to shed light on how their experiences evolved over time, linking formal and informal education strategies, as well as the online and offline worlds we all engage in every day.
Case study 1: Searsport
Searsport Elementary School is a coastal school on the north end of Penobscot Bay. It serves just over 200 students in grades K–5. Third-grade teachers Amy Hafford and Diane Gilmore have participated in WeatherBlur with their 30 third-grade students over the past two years.
Amy and Diane’s third graders focused on the King Tide (a “king tide” is a nonscientific term people often use to describe exceptionally high tides) and Water Quality investigations for the 2016–2017 school year. They focused specifically on whether the water quality would change after the spring snowmelt run-off occurred. One of the teachers’ challenges was getting smaller groups of students out on a more regular schedule to collect data. They overcame this challenge by dividing tasks up between classes and teachers. For example, Amy would take a few students out to collect data while Diane worked with the rest of the students in the classroom. In addition, because they were both just beginning their experience with WeatherBlur, they chose to participate in investigations that were already established in the system. At the end of the year, Amy reflected, “I think in the future, coming up with our own investigation that is local … posing something that our actual group came up with would increase engagement.”
In the first year, teachers led students to the king tide investigation specifically because they were located on the coast and had access to a beach. However, they felt that the students didn’t quite “get” the relevance of king tides because there was not a community service/awareness piece at the end of the investigation. The culminating activity teachers and students did for the beach trash investigation the following year made it relevant and more meaningful for students. Overall, Searsport teachers were not quite sure how to integrate WeatherBlur into their classes. Teachers were overwhelmed because it was a new process and the timeline in that first year conflicted with their school assessment schedule.
During the 2017–2018 school year, because of their prior experience and comfort with the WeatherBlur platform, the Searsport teachers were ready to go from the start. Their students wanted to focus on collecting beach trash and try to discover where that trash was coming from. The Searsport third-grade students and teachers learned that several other schools were interested in the same type of investigation and were able to connect with them through the WeatherBlur platform, as well as through a videoconference to discuss the investigation and come up with a data collection protocol. The Searsport third-grade students involved the community by connecting with the local parks and recreation department to help dispose of the trash they collected, and had a slideshow running on the local cable channel to inform the community about the project. Diane explained, “Last year … I think it being our first time, we weren’t quite sure what we were doing. This second time, we were able to have the kids more involved … that made it more interesting because it was something the kids, they picked it and really wanted to do it.”
Case study 2: North Haven
North Haven is a small island 12 miles off the coast in Penobscot Bay. It has year-round population of about 400 people, with numbers swelling in the summer months of July and August when families return to their summer homes and with increases in daytime tourism. The only link to the mainland is a ferry that runs three times a day, and is dependent on weather and tidal conditions. The North Haven Community School is Maine’s smallest K–12 public school, with an average total enrollment of about 60 students. For the past five years, North Haven teacher Laura Venger has been participating in WeatherBlur with her fourth-grade students.
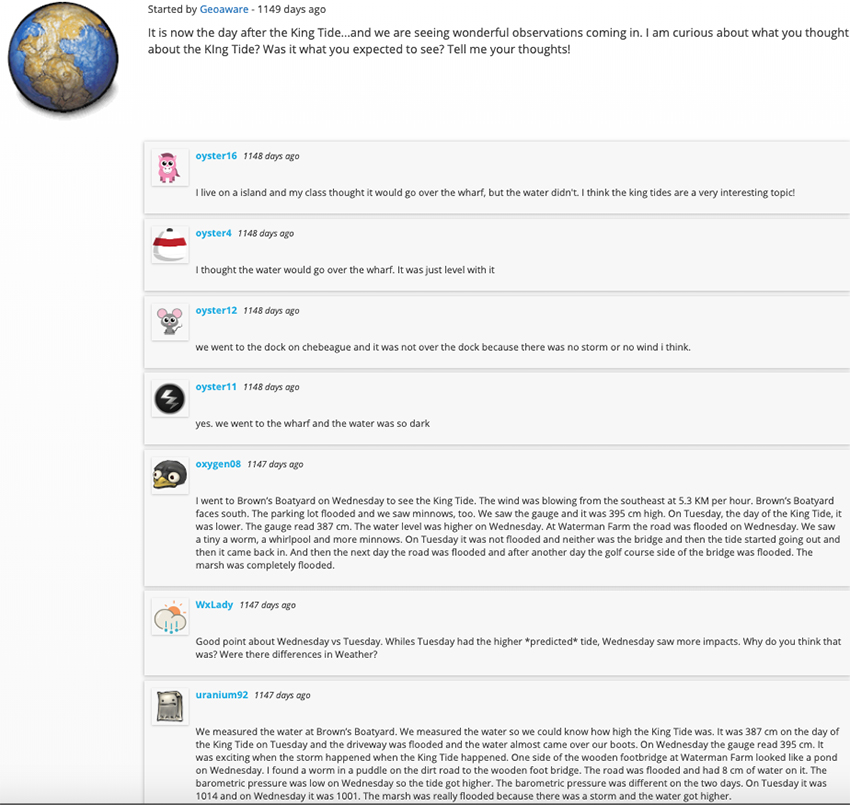
Last fall, two of Laura’s students, with the WeatherBlur screennames “Yttrium39” and “Nitrogen7,” were interested in learning more about how the high water from the upcoming November king tide would affect local beaches, roads, and buildings in their community. Their initial post on the topic was the beginning of a much larger discussion about potential impacts in other communities and how to measure those effects. In the three weeks prior to the king tide, students, teachers, and scientists worked to refine the investigation question in the online discussion boards and to create a data collection protocol that all communities would follow. Those participating in the king tide investigation decided to collect three types of data:
- photographs and videos of sites before, during, and after the King Tide on November 15, 2017;
- measurements of a high tide before the king tide, along with calculations of mean sea level; and
- the height of the king tide, along with some basic wind and other weather information.
That initial post by the students in North Haven gave rise to one of the most active investigations on WeatherBlur to date, involving 30 users including three scientists, two project staff members, four teachers, and 21 students. Over the course of the investigation, all participants contributed by commenting and/or posting photos and data via the platform’s discussion board. A total of 53 conversations generated 250 comments.
Laura reflected, “What I love about WeatherBlur is that it just expands my classroom.” This investigation allowed her students from the smallest public school in Maine to connect and work with students from up and down the coast.
Case study 3: Northport
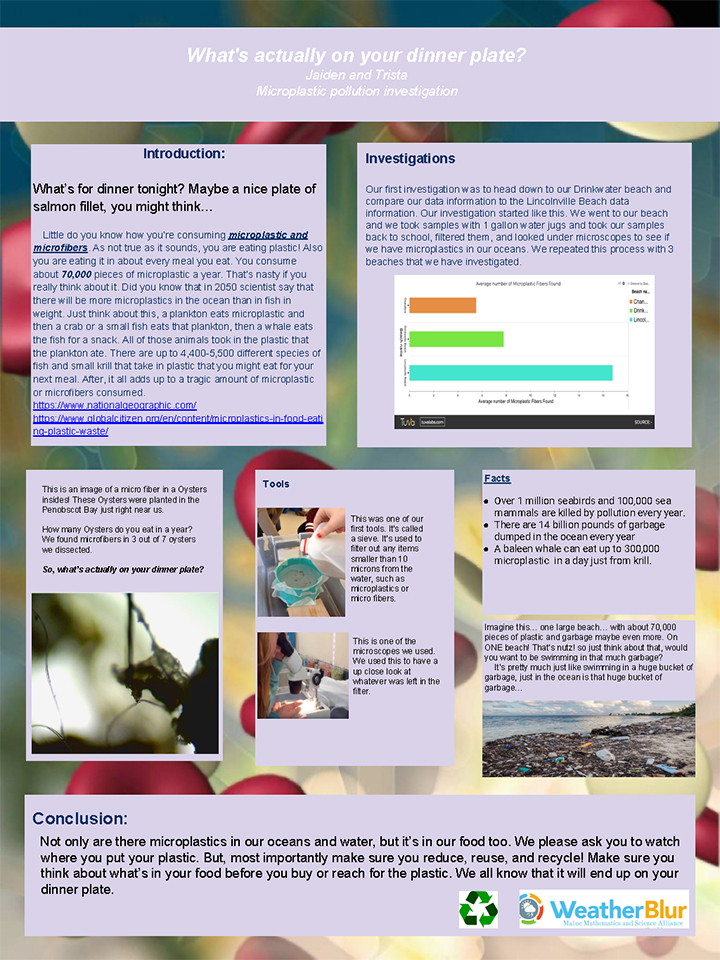
The Edna Drinkwater School in Northport, Maine, is a small K–8 school with about 120 students. This school’s fifth- through seventh-grade students focused on a microplastics investigation. During the question-generation phase of the investigation, educators at the school showed students a documentary called “Smog of the Sea,” which is about microplastic pollution, because the majority of their students had questions on the ocean and its associated pollution. Through interactions on the iWonder space, a dedicated online space on the WeatherBlur platform where users can pose and develop questions collaboratively, the final investigable question became: “How many microplastics are there per liter of water at our beach, and how does that compare to other beaches around the state?”
Once the question was created, the WeatherBlur community, including scientists and other schools, helped Drinkwater students turn it into a full-fledged investigation by creating a protocol for collecting data. Students brainstormed a procedure for sampling, and combined that with an existing procedure established by the Shaw Institute in Blue Hill, Maine. The students tried it out, and as a group, the fifth- and sixth-graders at Drinkwater refined the protocol into one they felt any school group could do.
The Drinkwater students decided to collect samples from the beach on campus and from Lincolnville Beach, a location 10 miles away where the state runs a ferry service to an island. The students thought there would be more plastics at Lincolnville Beach because of the increased boat traffic. A series of other schools joined in, including Chebeague Island School. After about six weeks of data collection, students created a variety of graphs to represent their data and address their research question. In the end, the Drinkwater citizen scientists found that there was a higher average count of microfibers at the school’s beach and a higher average count of plastic fragments at Lincolnville Beach.
Overall, students developed a sense of awareness about the complexity of microplastic pollution, how much it impacts the environment and food web, and how challenging and nearly impossible it is to get rid of. Students also were inspired to create a documentary about microplastics in the ocean, and then became actively engaged in driving change by
- banning plastic straws at school,
- limiting plastic bag use,
- writing persuasive letters to and calling local and national food franchises to ask them to limit plastic use, and
- contacting school administrators at other schools about finding alternatives to the plastic utensils used in cafeterias.
Findings
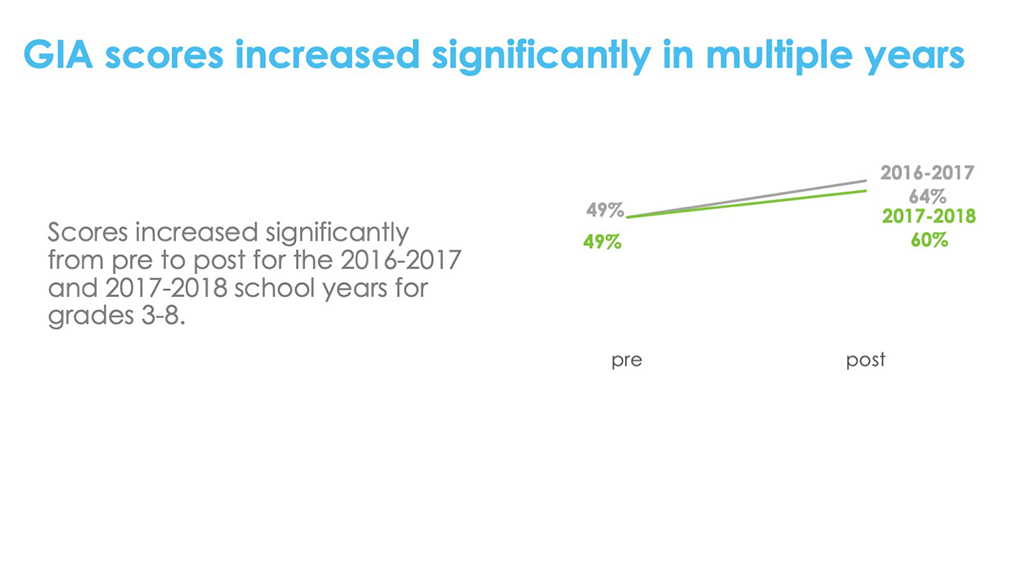
The project team took a multifaceted approach to capture outcomes related to collaboration and data literacy. We used social network analysis (SNA) of all interactions on the WeatherBlur online community to understand how students were or were not collaborating in the online space. To understand the impacts on data literacy, we used a graphical interpretation assessment (GIA) that was completed by students prior to beginning WeatherBlur investigations each year and at completion of the project (Peterman et al. 2015). The GIA was designed to understand proficiency related to data literacy in Common Core State Standards, in mathematics, for grades 3–8. The project team found significant increases in GIA scores across all grade levels for both the 2016–2017 and 2017–2018 implementation years (Figures 1 and 2).
The GIA results show a statistically significant increase in data literacy across all grade levels during the 2016–2017 project year
Increases in GIA scores were significant across two implementation years (2016¬–2017 and 2017–2018)
The SNA, along with an analysis of the discussion posts, showed interesting perspectives on how different users collaborated online. The SNA was designed specifically to understand how users collaborated within each investigation, after students had worked together to develop questions and narrow down their investigation topics. We will elaborate on the findings of the SNA for the king tide investigation as an example: First, group-level differences in the king tide investigation were explored by user group (e.g., scientists, teachers, students). Each dominated a different portion of the online dialogue and thus played a distinct role in the investigation. Over half of the background knowledge, for example, was provided by scientists (55% of the instances recorded). Scientists were also most likely to ask questions about the investigation (60%). Discussion of procedures was dominated by teachers (54%). Teachers also submitted approximately half of photos that were posted to the online discussion (52%). Teachers and students were equally likely to share data (43% and 41%, respectively). Students provided the majority of the data presentations that were coded to analysis (59%). We also found that if a user posted at least one comment, it would lead to direct interactions with five users on average.
The SNA showed that several users were very active, posting frequently in the king tide investigation. For this investigation, the top three users included one participant from each user group: Scientist A posted 55 times, Teacher B made 45 postings, and Student C made a total of 21 comments within the discussion. In many cases, students took on active roles and served as the go-between among teachers and scientists in the discussions. When looking closely at the formal brokerage roles fulfilled in the network, we found that students demonstrated a broad variety of brokerage potential, including positions among fellow students in their online discussions and key roles in bridging conversations with teachers and scientists.
Final thoughts
As one WeatherBlur teacher states, “We crafted our investigations offline with members of the local community, but we grew the investigations together with online community members from everywhere.” This quote is a perfect summation of how the WeatherBlur project is working to connect across boundaries to generate outstanding STEM learning opportunities for students in elementary and middle school. The project continues to design methods to connect students’ and educators’ offline worlds, based in community and place, with the power of digital connectivity in online worlds. There is great power in the experience of an isolated rural student sharing his/her expertise about fishing, for example, with other coastal students in communities hundreds of miles away with similar interests. Add to that the connections WeatherBlur is making between scientists and community schools—imagine the power of that same student connecting with a scientist who is, in turn, looking for a way to connect with communities in a specific fishery. We hope that the stories presented above highlight the possibilities of connected science learning in our society, as well as the possible outcomes for student learning and positive community change.
Educators are hungry for engaging and standards-based strategies to incorporate into their practice. Student-driven citizen science projects such as WeatherBlur provide a structure and supports to make implementation of the science practices in the classroom a little easier. Make no mistake, cocreated citizen science is challenging for educators to implement, but the rewards are exponential. Throughout the years, we have found some best practices that have been useful in supporting the implementation of WeatherBlur in classrooms.
Being responsive to teacher needs is of the utmost importance. When teachers stated that they simply did not have the time to analyze the data, we increased the amount of time the WeatherBlur project is active in classrooms. We also provided training and supports on data analysis methods appropriate for each grade level. A common issue across citizen science in the classroom is the desire to just collect the data but never getting to analysis. Every week teachers gathered for videoconferences set up and facilitated by WeatherBlur staff to ask questions, compare strategies, and plan together. These teacher gatherings were offered early in the morning prior to school and after school on certain days of the week, and teachers could pop in and out of those meetings as they were available to touch base with project staff and other educators. The scientist participants also popped in and out of these videoconferences to network with educators. In addition, a weekly newsletter summarizing the project status and important updates went out to educators and scientists during the intensive implementation periods.
Because WeatherBlur is an online platform, the project team takes protecting student privacy and the safety of minors seriously. There are a number of safeguards in place to protect students as they collaborate online with other schools, scientists, and community members. All parents of participating students are required to consent to their child’s participation and the collection of student data by completing a form in compliance with the Children’s Online Privacy Protection Act. In addition, online discussions are monitored by project staff to ensure appropriate language. Finally, WeatherBlur usernames and profile information are not allowed to contain any identifying information.
At the end of the project, providing an opportunity for students to present the findings of their research to each other and, in some cases, local decision-makers, proved to be a huge motivator for students and teachers. WeatherBlur hosted a student summit to bring together the 10 schools and the students who participated in the project in the 2017–2018 school year. Students shared posters of their research (see Supplementary Resources), met in-person the scientists they worked with, and worked on hands-on science activities related to the investigations they did all year.
In summary, the educators who participated in the WeatherBlur project worked hard to evolve their practice to make these exciting cocreated citizen science projects a reality. The experiences and lessons learned by the educators and project staff are another example of how the K–12 environment is most certainly appropriate for rigorous, hands-on, and important scientific research that is meaningful for the communities students live in.
Acknowledgment
This material is based upon work supported by the National Science Foundation under grant numbers 1530465 and 1451315.
Alexandria Brasili (abrasili@mmsa.org) is research associate at the Maine Mathematics and Science Alliance in Augusta, Maine. Ruth Kermish-Allen (rkermishallen@mmsa.org) is executive director of the Maine Mathematics and Science Alliance in Augusta, Maine.
Citizen Science Environmental Science Informal Education