
Research & Teaching
Determination of the Helpfulness of Physics Exam Study Methods
Journal of College Science Teaching—July/August 2023 (Volume 52, Issue 6)
By David Waters and Rahul Jilakara
This study investigates the relationship between study methods and exam performance in introductory physics courses. Data were collected over 3 years through surveys to examine students’ study habits, perceived effectiveness of techniques, and the correlation between time allocation and exam grades. Results indicate that high-achieving students employ more effective active-learning strategies like problem-solving and group discussions, and low-performing students rely on passive techniques such as rereading without comprehension. Notably, students who do not perform as well prioritize study material order rather than method effectiveness. By promoting effective study techniques and addressing disparities between high and low achievers, instructors can enhance outcomes for all students. This study underscores the importance of tailored study approaches in introductory physics, empowering students with effective strategies for improved academic achievement and exam performance.
Studying for physics exams can be difficult and stressful, especially during a student’s introductory year in physics. For students who do not plan to major in physics, the desire to do well is sometimes based less on understanding concepts and more on achieving a better grade. For this reason, students want to study as efficiently as possible by using the most optimal study methods. We have taken surveys over the past 3 years to determine how students study for exams and compared the results with their exam grades. We hoped to find that students who study using methods they rate as more helpful do better on exams. We look at what students are studying, both in terms of study methods and the percentage of their time on each study method; which study methods students perceive to be helpful; and the relationship between the percentage of students’ time spent using a given study method and their exam performance.
Background
As we prepared this study, we acknowledged that the information gathered was based on self-report and Likert-type instruments. Self-report means that a student provides their own ratings instead of using an independent determination, and these have both advantages and disadvantages (Schellings & van Hout-Wolters, 2011; van Hout-Wolters & Schellings, 2009; Veenman & Alexander, 2011). The advantages of self-reports are that we do not interrupt or influence someone during their process, which allows us to collect a lot of data relatively easily. Unfortunately, students may not be able to accurately recall everything or may be biased in their answers (Veenman, 2005).
Study skills are important for college students, and not all students know how to study in an optimal manner (Kumar, 2015). For example, research has been conducted on how best to study for exams in medical school (Augustin, 2014), looking at the testing effect, active recall, and spaced repetition, all examples of study skills. In our study, we look at study methods that come from preparing for physics examinations during introductory algebra-based physics courses. We define study methods as the materials that students use to study for exams.
Previous work on study strategies for exam preparation, which includes study skills and study methods, has found that providing information about how to study can be more useful than providing the exact questions on the exam (Van Etten et al., 1997). Van Etten et al. (1997) found that distributing efforts across many study methods and knowing the format of the exam can be helpful for students preparing for an exam. For this reason, in our physics courses, we provide the previous year’s exam to students to both show the format of the exam and give students material to prepare. Fakcharoenphol et al. (2011) find that studying using old exam practice problems can help students prepare, although the retention of learning may only be short term. Previous research also determined that when students study on their own using worked-out solutions (e.g., old exams and class slides with problems) and targeted exercises such as the review problems, they perform better than they do when using traditional study methods, such as rereading the textbook (Fakcharoenphol & Stelzer, 2014). Finally, completing web-based physics homework problems can help students achieve higher overall exam performance (Mestre et al., 2002), so using these homework problems to study may also help students improve their exam scores.
Although many study methods can improve a student’s exam scores, some study methods have been found to be less helpful. Students believed that reading the textbook to study for an exam improved their understanding, but doing so had no effect on their exam performance because it gave them a false sense of understanding (Linderholm & Wilde, 2010). This finding is interesting because many studies that look at exam preparation only have textbook readings as their study method (Pressley et al., 1997). Pressley et al. (1997) identified strategies to use textbook reading successfully, which may explain why some of our students label textbook reading as helpful.
It has been found that students must adapt their study method to the type of task that they are expected to complete (Broekkamp & van Hout-Wolters, 2007), so a study method that results in better exam grades for most students may not be as helpful in another environment. It may be difficult to make a list of helpful study methods from our physics courses and implement them in other environments, as one would expect that some study methods would be more helpful than others. For example, high-achieving students have been found to better prepare for exams by using study methods that are more helpful (Kitsantas, 2002; Sundre & Kitsantas, 2004; VanZile-Tamsen & Livingston, 1999), but low-achieving students used the order of materials to determine what they would need to study (Holschuh, 2000). Some students learn better using certain study methods, but others will not learn as well using the same methods (Pressley et al., 1997). This may explain why study methods in our courses work better for some students than for others. Assuming that our students’ self-reporting is accurate, students may use the study methods differently or begin the preparation with different levels of understanding and thus will need to use different methods.
Procedure
Population
The survey was given to undergraduate students, mostly sophomores and juniors, at the University of Health Science and Pharmacy in St. Louis, Missouri. The courses in the fall and spring semesters were algebra-based introductory physics courses. These courses were required for health science majors who were most often going to enter the pharmacy program or take a health science professional exam such as the Medical College Admission Test.
Data collection
After each exam but before the students received their grades, we asked students to fill out a survey. These surveys were administered using the course’s learning management system, Moodle. The number of students who completed the survey and the total enrollment of the courses are shown in Table 1.
We used the following survey questions:
- Q1: Approximately how many hours did you spend studying for the exam?
- Q2: What percentage of time did you use the following materials to study for the exam? (10%, 20%, etc., or n/a)
- Q3: How helpful were these material types for the exam? (scale: 1 = least helpful to 5 = most helpful)
Any student who did not use a certain study method answered n/a on Q2 and Q3 for that study method. Some students did not choose n/a for Q3 for a study method that they did not use, so we changed that Q3 value to an n/a for them. A lingering question we had throughout this study concerns whether students’ knowledge that they will be asked about their study methods (which they realize after the first exam in the fall semester) affects how they prepare for subsequent exams.
We gave students a list of the study methods available along with an explanation of each.
- Rereading textbook: The course uses the OpenStax College Physics textbook. Sections of the textbook are given to students as a smaller PDF before each class. The assumption is that students read the textbook before class, so this method would involve reading the textbook again before the exam.
- Class slides (conceptual): During each class, students are asked multiple-choice questions and use a clicker to input the answer. These questions are conceptual in nature, meaning that there usually is not any math needed to answer them. They are similar to the multiple-choice questions on the exam.
- Class slides (problems): Each week, after the topics have been introduced and discussed, students are given a day to work only on mathematical problems in class. These problems are similar to the mathematical problems that students see on the exam. Worked-out solutions are provided.
- Review questions: Review questions involve multiple-choice questions that may be either conceptual or mathematical in nature. These are all new questions that have not been seen before.
- Old exam: The previous year’s exam is provided as a study method, both to give insight about the format of the exam and to provide more practice opportunities. The answers to both the multiple-choice and mathematical problems are given, but the explanations and solutions are not provided.
- Homework problems: Homework assignments involve solving mathematical problems similar to those seen in class and on the exam.
- Reading quizzes: Before each class, students are asked a series of simple questions to see if they have read the textbook or watched the video.
Course exams
The number of exams that are analyzed are listed in Table 1. The course exams were made up of conceptual (multiple-choice) questions and mathematical problems. These were paper exams on which students would write out their work. For the multiple-choice questions, students could write out their work for partial credit. The mathematical problems also allowed for partial credit, with the bulk of the points awarded for showing how to solve the problem. All exam scores included in the data are scores after partial credit was given. Exams usually had about 10 multiple-choice questions worth 3 or 4 points each and three or four mathematical problems with individual parts that made up more than half of the grade. Because our exams come right after studying, we did not look at long-term retention of students’ learning.
Study method usage
We wanted to determine what students are studying and the percentage of their time spent on each study method. From the student-filled survey data using the data from Q2, we averaged the percentage of time students spent using each of the seven study habits for all 6 semesters. There were 1,270 respondents. As seen in Figure 1, students spent a majority of their time studying using old exams and class slides (problems and conceptual). The average percentage of time that students spent rereading the textbook was smaller than we predicted.
Although we calculated the total time spent using each study method by multiplying the total time that each student spent studying (Q1) by the percentage that each study method was used (Q2), the graph looked nearly identical to Figure 1, so we do not include this graph. For this reason, we will only discuss the percentage of time spent on each study method instead of the amount of time.
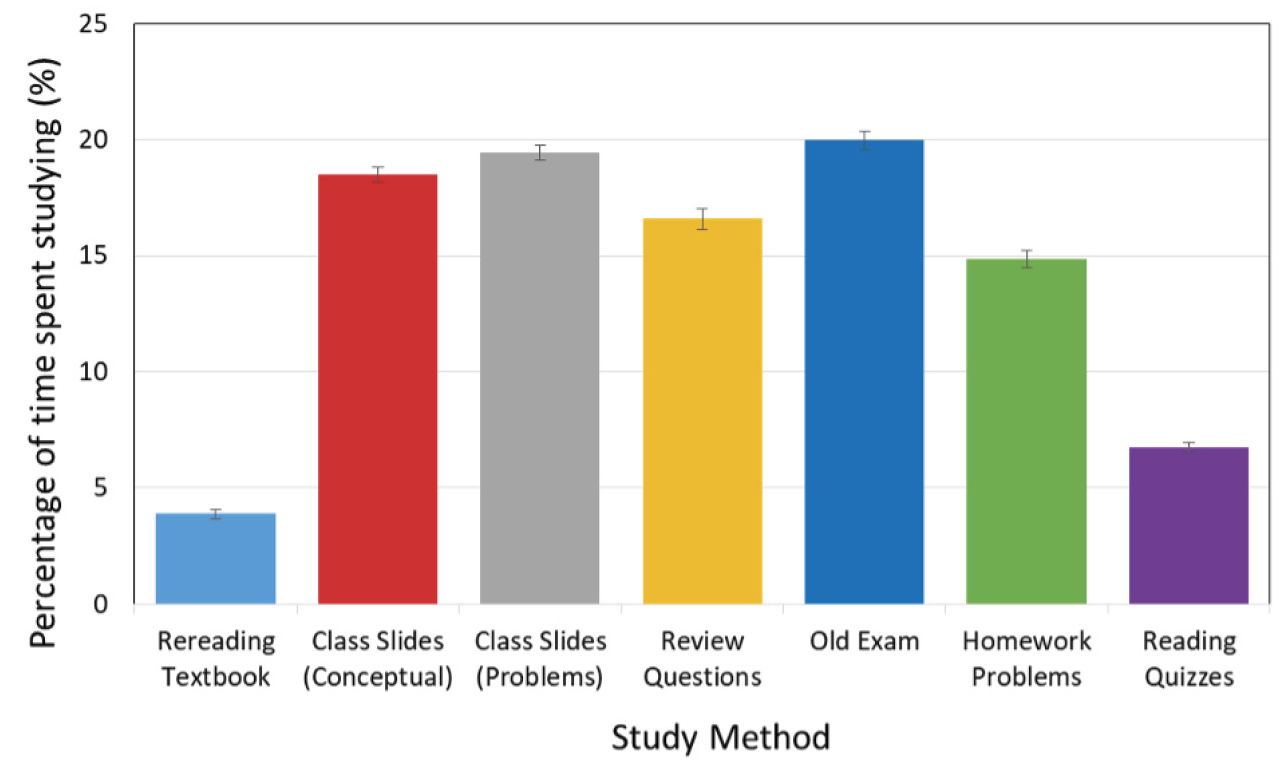
Average percentage of time spent on each study method.
Note. There were 1,270 responses to each of these study methods. Error bars are from the standard error of the mean.
Study method helpfulness
Using the data from Q3, we determined the perceived helpfulness of each study method by averaging all of the responses for all 6 semesters for each study method. During data collection, only those students who marked that they had used a certain study method in Q2 also recorded the helpfulness of that study method in Q3. This means that if a study method had a low helpfulness rating, that was because the students who used that method had rated it poorly. We can probably assume that those who did not use a study method chose to ignore this option because they decided it would not have been helpful. Thus, rarely used study methods probably would have had an even lower helpfulness rating if all respondents had been asked to rate the helpfulness of all of the methods.
We combined all of the average helpfulness ratings for all of the study methods, giving us an overall helpfulness rating (OHR). To determine the OHR, we took all of the helpfulness ratings for every study method used by every student for every exam in every semester and averaged all of the responses. The OHR was 3.59 out of a total of 5. Any study method that was rated higher than the OHR was considered helpful.
To recognize if a study method was helpful or unhelpful, we can look at Figure 2 to determine the perceived helpfulness of each study method, which uses the averages from Q3. The horizontal black line represents the OHR. We can see that class slides (conceptual and problems) and the old exams were higher than the OHR. These study methods are considered helpful to students on average. Review questions and homework problems were within the margin of error of the OHR, so they cannot be considered helpful or unhelpful. On the other hand, rereading the textbook and reading quizzes had an average helpfulness that was lower than the OHR and are considered less helpful to students.
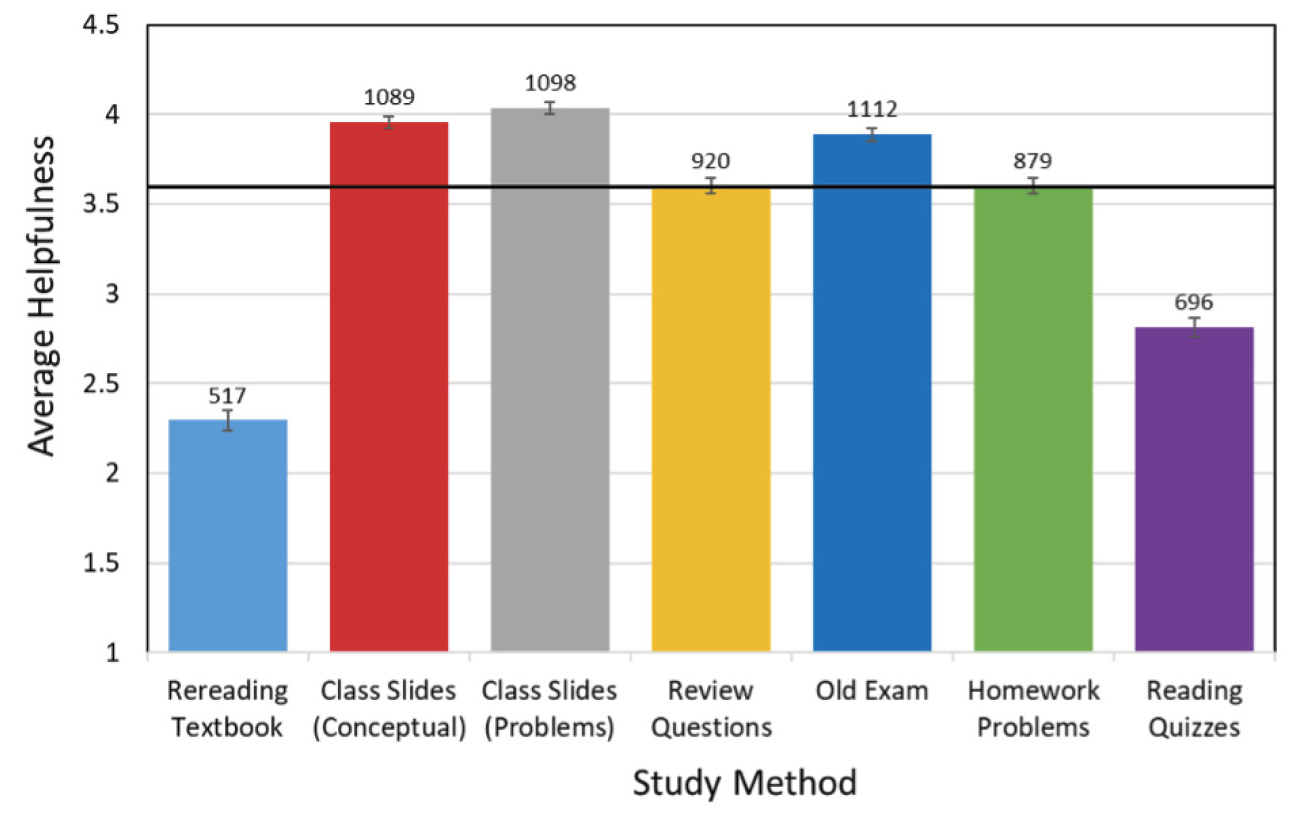
Average helpfulness rating for each study method.
Note. The rating was on a scale of 1 to 5, where 5 is most helpful. The horizontal black line represents the overall helpfulness rating (OHR) of 3.59. This demarcation allows us to designate these study methods into helpful and unhelpful groups. Error bars are from the standard error of the mean. The numbers above each bar indicate the number of responses and thus the number of students who used that method to study for the exam.
To compare how the helpfulness of a study method changed across semesters, we averaged the helpfulness ratings from Q3 within each semester for each study method (Figure 3). We can see that review questions trended upward and were labeled as helpful only for the last 2 semesters. This could be because many more questions were added to the review questions each year and the questions improved. We also see that class slides trended downward but mostly remained above the OHR. It is not clear why class slides show a downward trend. Students who used rereading textbook as a study method did not find that study method to be as helpful to their performance on an exam as did those who used the other study methods. This observation is supported by Figure 3, which indicates a downward trend of helpfulness ratings from the first semester that this survey was administered to the final semester. Comparing the average time that students spent on each study method as well as the students’ perception of the helpfulness of each study method helped us understand the potential impact of each study method.
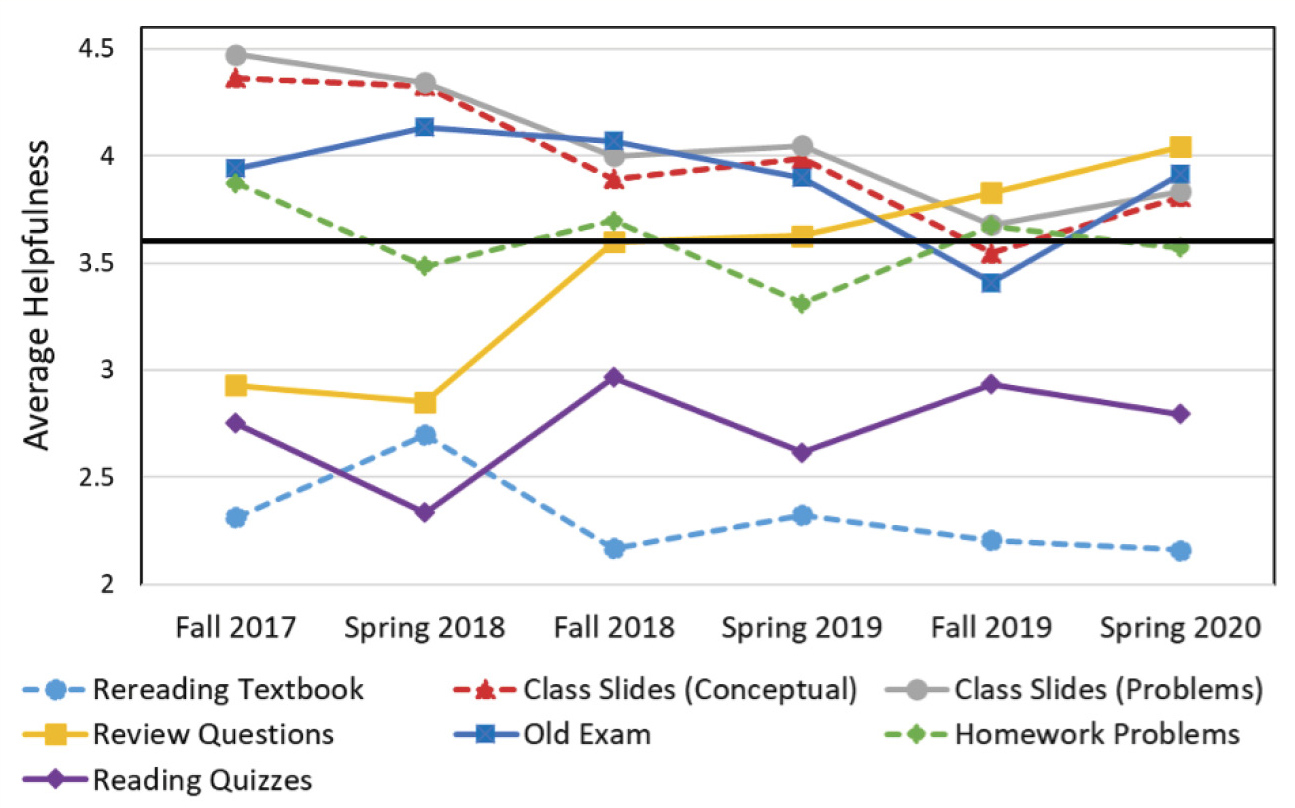
Average helpfulness rating for each study method by semester.
Note. The rating was on a scale of 1 to 5, where 5 is most helpful. The horizontal black line represents the overall helpfulness rating of 3.59 out of 5. Although the error bars are not shown to avoid making the graph any busier, the standard error of the mean for each data point was approximately 0.1.
Comparing Figure 1 with Figure 2, we find that students spend more time using study methods that most of the class believed are helpful. Perhaps unsurprisingly, the most helpful study methods are ones that involve questions and problems that are similar to those on the exams. In the next section, we compare the effect of relying more on the helpful study methods on exam grades.
Exam performance
Correlations
To determine how the use of each study method correlated with exam grades, we used the rcorr function in R using the Pearson correlation method. The inputs were the perceived helpfulness of study methods and the exam grades for each student. The helpfulness of each study method was determined in four different ways: First, we looked at how students individually rated the helpfulness of the study methods (helpfulness per student). Second, we looked at the helpfulness rating of each study method for each exam (helpfulness per exam). Third, we looked at the helpfulness rating of each study method for each semester (helpfulness per semester). Fourth, we created groups of universally helpful and unhelpful study methods (helpfulness group). Once we knew if a study method was helpful, we added up the percentage of time spent studying using helpful study methods and compared that with the exam performance, then did the same with the unhelpful study methods.
For helpfulness per student, we compared how a student rated each study method for that exam to the OHR. A study method is considered helpful to that student if they rated the study method as higher than the OHR, and vice versa.
For helpfulness per exam, we compared the average helpfulness rating for that exam to the OHR. A study method is considered helpful if its average helpfulness rating for that exam is higher than the OHR, and vice versa.
For helpfulness per semester, we compared the average helpfulness rating for all of the exams in each semester to the OHR. A study method is considered helpful if its average helpfulness rating for that semester is higher than the OHR, and vice versa. Figure 3 shows the helpfulness of each study method in each semester.
For helpfulness groups, we compared the overall average helpfulness rating for that study method to the OHR. A study method is considered helpful if its average helpfulness rating is higher than the OHR, and vice versa. The data for these classifications are given in Figure 2. The helpfulness groupings were as follows:
- Helpful study methods: class slides (conceptual); class slides (problems); homework problems
- Unhelpful study methods: rereading textbook; reading quizzes
Review questions and old exams are not included in these helpfulness groups because their average ratings were at the level of the OHR. If we find that student performance on exams goes up when more time is spent using study methods from the helpful group, then we can recommend these methods for studying.
Our goal was to determine the relationship between the percentage of time using study methods and the performance on the exam. For the performance on the exam, we started with the overall exam grades. For the percentages of time spent studying, we added up the percentage of time spent using all of the helpful study methods, then separately added up the percentage of time spent using all of the unhelpful study methods. With four ways to determine helpfulness and calculations for helpful and unhelpful for each, we had eight categories total.
The relationship between the use of study methods and exam performance is shown in Table 2. Any value with at least one asterisk (*) has a significance of p < 0.05. If a value included a significance of more than one asterisk, then two asterisks indicate that p < 0.01 and three asterisks indicate that p < 0.001. If a value in the correlation table had a p-value of greater than or equal to 0.05, then there will not be any asterisks attached; we did not consider these values to be significant.
Table 2 shows significant correlations in all of the helpfulness groupings. We see that most of the correlation values are medium or small, meaning that although the results are significant, the effect is not large. We can see that the highest effect comes from the helpfulness per student, which means that individual students were more successful at figuring out which study method helped them the most on the exam. The next highest effect was for the percentage of time spent studying using the most helpful or unhelpful study methods for each exam. Once we get to the semester groupings or the overall helpful and unhelpful groups, we find a small effect size. This small correlation value means that although the results are significant, there is little to no predictive power in these results. Even though we cannot rule out the fact that studying helpful materials improved exam performance, these results on their own do not indicate that to be the case.
High and low performers
Another way we used to determine how different study methods affect exam performance was by separating the responses of the high performers and the low performers. To do so, we determined the upper and lower quartiles for the exam grades. Using the summary function in R, we determined the cutoffs to be 92% and 80%, respectively. Any student with an exam score higher than 92% was considered a high performer, and any student with an exam score lower than 80% was considered a low performer. Out of the 1,270 students, 296 were high performers and 302 were low performers. Figure 4 shows the percentage of time spent on each study method by the high and low performers. Figure 5 shows the how each group rated the helpfulness of each study method. These figures, which only have the high- and low-performer responses, can be compared with Figures 1 and 2, which have responses from all of the students.
Figure 4 shows that high performers spent the largest percentage of their time on the study methods that were placed into the helpful group (class slides [conceptual and problems] and old exams). Low performers spent more time than high performers on the study methods that were placed into the unhelpful group (rereading textbook and reading quizzes). The high and low performers spent similar percentages of their time on the categories that were not placed into either group because those two study methods were equal to the OHR (review questions and homework problems). This result gives some justification for the helpfulness groupings.
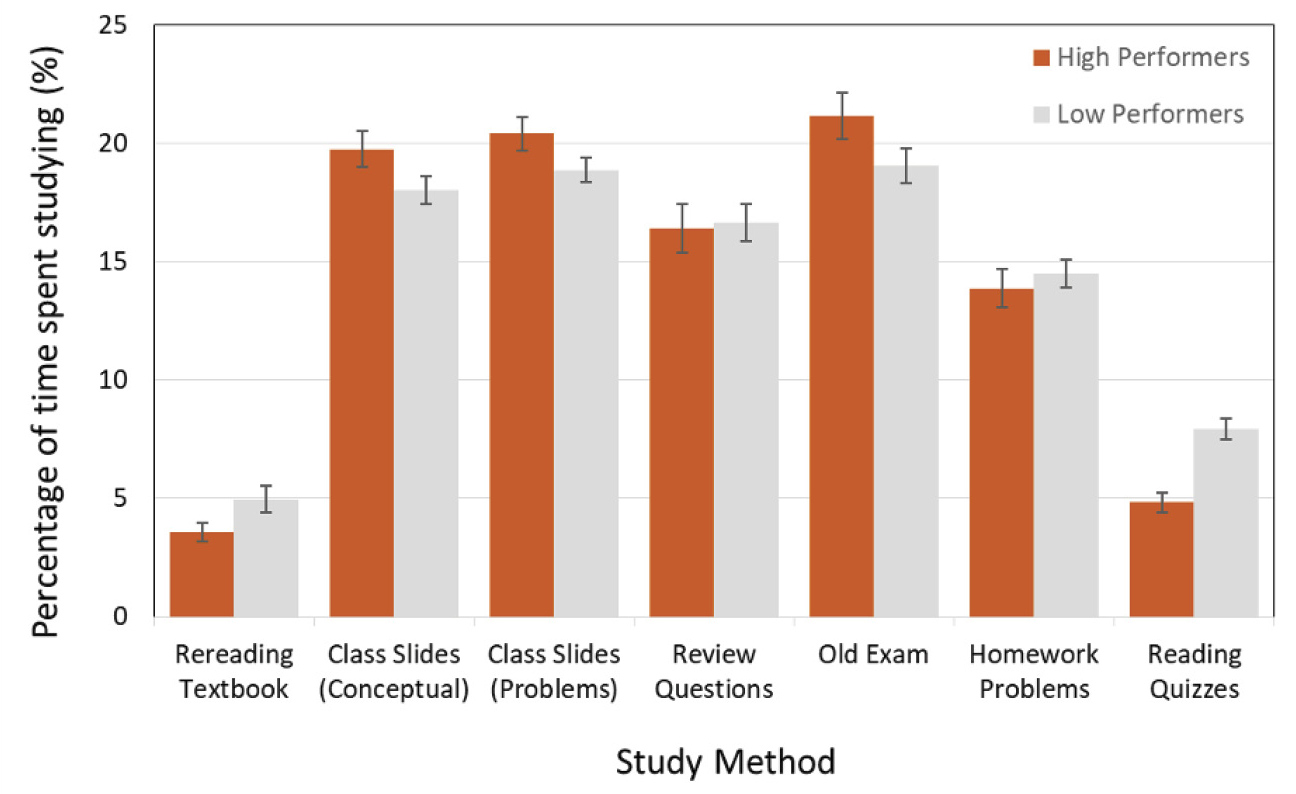
High and low performers’ average percentage of time spent studying.
Note. Error bars shown are from the standard error of the mean.
Figure 5 shows that the high and low performers had different ratings on each of the more helpful study methods. They each rated rereading textbook and reading quizzes at about the same level. Each of the other study methods were rated higher and above the OHR by the high performers. It appears that low performers did not recognize the same level of helpfulness of the more helpful study methods and thus did not use them as much as the high performers. This result tells us that low performers may need more support, but high performers seem to have a better grasp on what will help them.
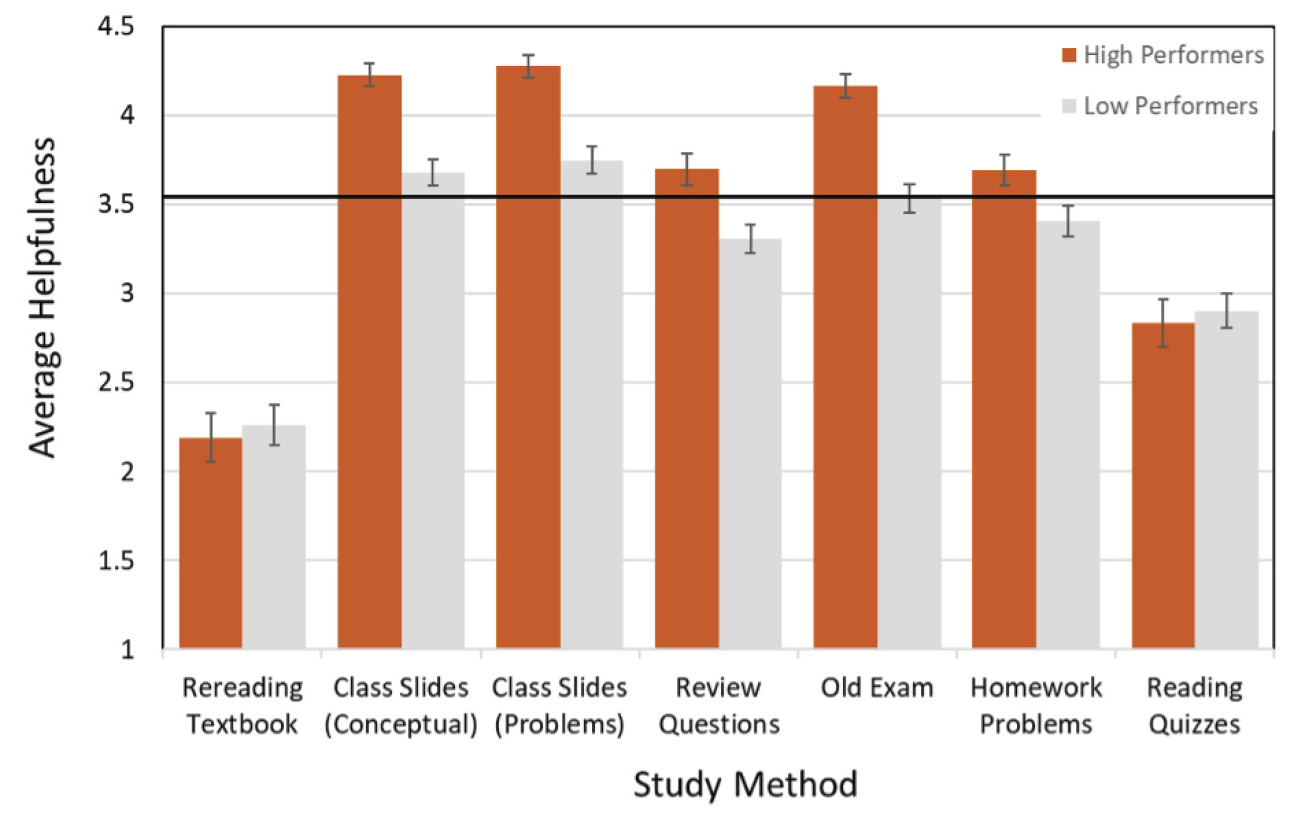
Average helpfulness rating of each study method by high and low performers.
Note. The rating was on a scale of 1 to 5, where 5 is most helpful. The horizontal black line represents the overall helpfulness rating of 3.59.
Discussion
According to the results shown in Table 2, there is not enough evidence to suggest we could simply hand students a list of helpful study methods and have all of their grades improve. On the other hand, there does appear to be study methods that are considered more helpful, as shown in Figure 2. The study methods that appear to be rated as being more helpful, in order of helpfulness rating, are class slides that review mathematical problems, class slides that review conceptual questions and materials, old exams, review questions, and homework problems. If we gave a list of these methods to students who may be struggling and considered low performers, it may give them some direction as to what materials to focus on, as Figures 4 and 5 show that low performers are not as aware of which study methods may be more helpful. Although we had hoped to come away from this project with a definitive list of helpful study methods to disseminate to all future students, we recognize that more research is needed.
David Waters (drdavidpwaters@gmail.com) was an assistant professor in the Department of Basic Sciences at the time of this research, and Rahul Jilakara was a student, both at the University of Health Sciences and Pharmacy in St. Louis in St. Louis, Missouri.