
Research & Teaching
Research Project-Based Learning in Meteorology Using an Online Severe Weather Events Archive
Journal of College Science Teaching—July/August 2023 (Volume 52, Issue 6)
By Joby Hilliker and Shannon Hilliker
This article presents a semester-long, interdisciplinary project-based learning (PBL) suitable for secondary and postsecondary students enrolled in a second-semester (i.e., intermediate) meteorology course. This case-study approach builds on the research question “What atmospheric conditions lead to tornadoes, hail, and damaging winds locally?” Students work collaboratively in a series of five activities, using an online database analyzing map and weather data from a subset of severe weather events. Students synthesize the data by identifying the severe qualitative weather variables that appeared most frequently among the cases and modify, if necessary, accepted threshold values for the quantitative variables. Students finalize the project via an oral presentation and technical paper to transform their newly discovered knowledge into improved severe weather forecasting guidance for societal benefit. An analysis of pre- and postsurvey responses from a small student sample reveals increases in both the comfort and experience of the PBL’s components, with the oral presentation showing the most significant impact. After the project, students could identify in greater depth those antecedent atmospheric conditions that generate tornadoes, hail, and strong winds.
Project-based learning (PBL) incorporates tenets that are discussed by Dewey (1916) and expounded by Larmer et al. (2009) and Lee and Blanchard (2019); motivates the instructor to compose an open-ended question; and facilitates collaborative work among students. This inquiry-based process involves a series of steps during which students are engaged over an extended period in building on foundational coursework to acquire new knowledge and skills.
PBL is particularly effective in the undergraduate science courses (Mandeville & Stoner, 2015; Patrick et al., 2020) since data collection and analysis foster computer literacy and other practical 21st-century skills (Chu, Reynolds et al., 2017). Meteorology is one branch of science that lends itself to incorporating PBL in the classroom, particularly because there is an emphasis on case studies. Yadav and Beckerman (2009) have highlighted the effectiveness of infusing current cases into the curriculum. Many of these case studies are easily accessible via online databases, which further student learning (Chu, Zhang et al., 2017).
The use of PBL in meteorology education has been limited, as lamented by Charlton-Perez (2013), who encourages their implementation by providing classroom models. Nevertheless, a few meteorology PBL activities have been showcased, including by Baker (2006), who used weather station data, and Beringer (2007), who constructed a research investigation focusing on the urban heat island. More recently, Stalker et al. (2015) shared a PBL with emergency workers to plan for severe weather.
PBL overview
The purpose of this article is to offer meteorology instructors another PBL option. The motivation for the PBL offered in this article stems from a potentially life-saving application: disseminating more accurate forecasts of severe weather to the public. Thus, the PBL activity’s driving question is “What are the atmospheric conditions that are conducive for tornadoes, hail, or damaging winds locally?” Students will gain a greater appreciation for and understanding of the atmosphere as they answer the research question and will formulate their own questions for further inquiry at lesson’s conclusion. (This research was approved by Institutional Review Board Protocol ID # 20180208B-R1.)
For this PBL, students work collaboratively through a series of activities collecting, analyzing, and synthesizing data for a subset of severe weather cases using an online weather database, the Storm Prediction Center (SPC) Severe Weather Events Archive, which is maintained by the National Oceanographic and Atmospheric Administration. The SPC is responsible for monitoring severe weather across the United States. This searchable and continually updated database catalogs reports of severe weather events (defined as a tornado, hail greater than or equal to 1 inch in diameter, or wind gusts of 50 knots or more) with respect to time and location.
Figure 1 shows the map and list of reports from October 31, 2019, a day on which the East Coast had active severe weather events. In addition, archived surface- and upper-level (300 millibars) maps and soundings (vertical atmospheric profiles) allow for the analysis of the atmospheric conditions of the requested date. Links to these data are provided on the website’s left panel, also shown in Figure 1.
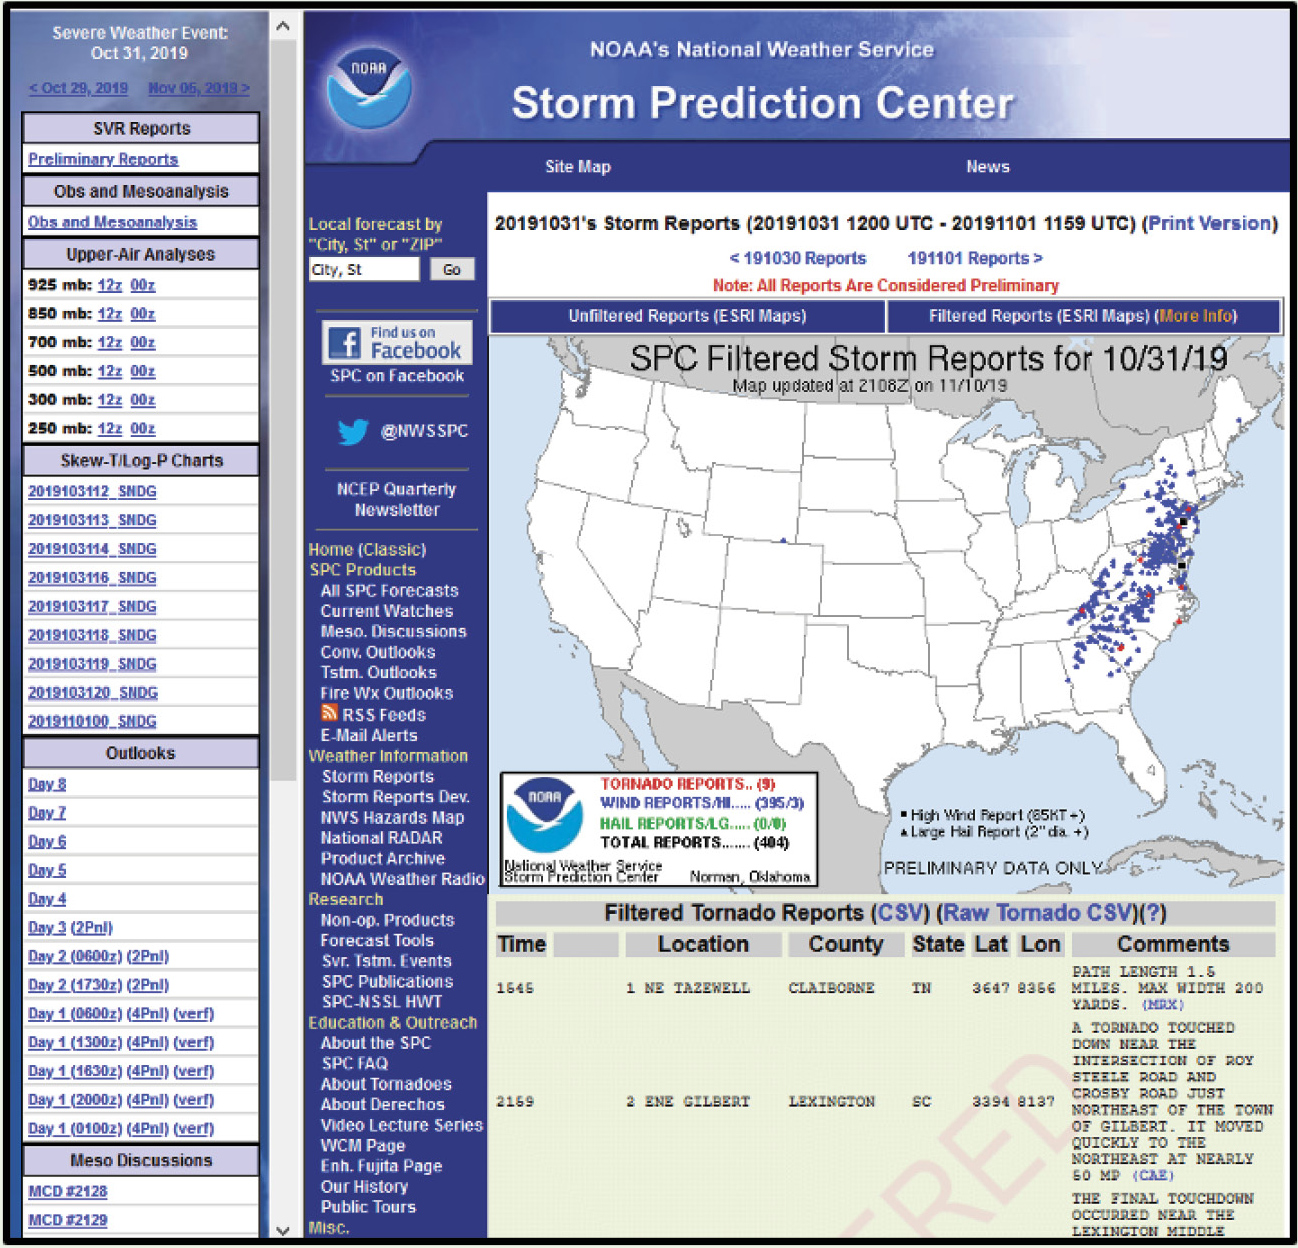
Overview of severe weather reports and meteorological data (left panel) for October 31, 2019.
At the end of the project, students construct an oral presentation and research manuscript summarizing the project’s motivation, data collection and analysis, and results. The results section reveals those qualitative variables that appeared most frequently in the case study analysis. For the quantitative variables, students modify, if necessary, the variables’ “established” (i.e., based on previous meteorological research) threshold values for severe weather.
Optimizing the variables for the local region encourages students to be mindful of a PBL element underscored in Larmer et al. (2009): having an authentic audience. For this PBL, the stakeholders might be nearby operational forecasters at a television station or National Weather Service office. To emphasize the project’s real-world application, the instructor can add that manuscripts will be shared with a public audience. Another option would be to invite a forecaster to provide feedback during the presentations.
This PBL is aimed at science-oriented students in a second-semester (i.e., intermediate) meteorology course. It is also valuable in a severe weather or forecasting course for college meteorology majors. Regardless of setting, students should have prerequisite knowledge of atmospheric stability, the jet stream, and the mid-latitude cyclone. Students should feel comfortable interpreting surface and 300 millibars (upper-level) maps.
One strategy for structuring the meteorology course is to reserve the lecture portion to review these introductory concepts, then move into covering PBL-relevant intermediate ones as the semester progresses. Because the PBL takes roughly 15 in-class hours (60 minutes per week) to complete, the project can be incorporated comfortably into the course’s lab portion. Students are expected to commit additional time outside of class to work on their presentation and manuscript.
The PBL is particularly suitable in a follow-on meteorology course because students will already have the knowledge to successfully conduct a case-study analysis. It is also appropriate at this intermediate level because it fosters higher-level cognitive thinking. For example, case studies allow students to synthesize (“Create” level from Bloom’s revised taxonomy; Anderson & Krathwohl, 2001) the individual bits of their introductory meteorology knowledge (e.g., surface processes, cloud development, jet stream dynamics) into a coherent, three-dimensional view of the atmosphere that helps them grasp more fully how the system works.
In addition, analyzing a suite of cases encourages students to weigh (“Evaluate” level from Bloom’s revised taxonomy; Anderson & Krathwohl, 2001) the various atmospheric variables. Although certain minimal conditions are typically present to generate severe weather, each day is unique. By the end of the project, students should recognize that the breadth and magnitude of these conditions vary. A case study PBL in meteorology thus encourages students to appreciate through empirical evidence the complex, nonlinear behavior of the atmosphere.
Finally, as instructors, we wanted to determine the PBL’s impact on students. We were first interested in gauging students’ affective attitudes toward the PBL’s components—namely, whether students’ comfort or experience increased with respect to collecting and analyzing data and constructing an oral presentation and manuscript. We also wanted to assess whether the project in fact increased students’ knowledge of severe weather causes, either in breadth or depth. The PBL Assessment section of this article shares the results from a pre- and postsurvey that was distributed to participating students in spring 2020.
PBL implementation
The instructor is first encouraged to review the atmospheric variables that students will assess (see Appendices A through D). Although many concepts (e.g., proximity to front) should be familiar to students after an introductory meteorology course, students must be exposed to the more intermediate concepts (e.g., positive vorticity advection) during the second-semester course.
One suggested preparatory assignment is to ask students to define commonly used quantitative severe weather derived from sounding data. Many of these variables gauge atmospheric stability and upward motion potential, except for helicity and wet-bulb zero (WBZ) height, which assess vertical wind shear (conducive for tornadoes) and wet-bulb temperature (conducive for hail), respectively. Table 1 shows a partial list of these variables, their definitions, and the established threshold values for severe weather. The American Meteorological Society (2020) provides a helpful supplement to the suggested references.
Collaboration is also a key PBL tenet, so the instructor then assigns student pairs. Although there are different strategies for assembling pairs (e.g., by ability; Braught et al., 2010), the benefits of peer learning are clear (Wilson & Varma-Nelson, 2021). Pairing students also keeps the number of assigned years, and thus workload for the instructor, manageable. Each pair is then assigned a different year to study, typically one that is recent or that has had impactful severe weather events locally.
An additional preliminary activity composed of questions from a sample severe weather event may increase students’ comfort with the online database while they review fundamental meteorological concepts. The instructor is encouraged to assess and provide feedback on this activity and the student artifacts described in the following section to determine if each student pair can move forward.
PBL activities
Five activities make up the data collection, analysis, and synthesis portion of the PBL. Each activity takes a pair roughly 1 to 2 hours to complete their data table as an artifact. In the first activity, students identify the top five severe weather events for their assigned year. In Activities 2 through 4, students qualitatively or quantitatively assess a list of traditionally recognized severe weather variables from the upper-level, surface, and weather balloon (sounding) data, respectively. In the final activity, students synthesize the case study data to identify frequently occurring atmospheric conditions and update established severe weather thresholds. The instructor then asks evaluation and reflection questions.
In this section, we detail the activities, highlighting for each the artifact and the tasks required to complete the activity. Example artifacts come from one year of study (2019) for the Philadelphia region.
Activity 1: Identifying a subset of severe weather events
Artifact
The artifact for this activity is a summary of the year’s five most severe weather dates for the region, specifying the time, date, and number of tornado, hail, and damaging wind reports.
Tasks
Students identify for their assigned year the top five most impactful severe weather dates locally. To narrow the subset, students first view, for each candidate date, a map revealing the locations, scope, and type of severe weather. Students then fine-tune the subset by reviewing the information in the reports, as this information is helpful for gauging the time and extent of severe weather. As an example, Figure 1 shows the map and reports from October 31, 2019, an active severe weather day for the eastern United States.
Pairs then share their five events, justifying their inclusion, with the instructor for approval. Upon approval from the instructor, students shade those cells of the events that occurred during the traditionally warmest part of the year (April through September) and time of day (between 18 UTC [Universal Time Coordinated, 4 hours ahead of Eastern Daylight Time] and 03 UTC). Appendix A shows a completed table of the subset of notable 2019 severe weather dates.
Activity 2: Collecting upper-
level data
Artifact
For all five cases, students conduct a qualitative and quantitative analysis of variables evident on upper-level maps that lead to rising motion in the atmosphere, a necessary component of thunderstorm development.
Tasks
Students analyze for each event the 300 mb map (12 UTC or 00 UTC) that more closely matches the time of severe weather for each upper-level variable listed in Appendix B. (Because the 00 UTC map corresponds to midnight UTC, the date stamp will read the day after the event. This is a common source of confusion, mitigated by SPC bundling the 00 UTC map with the morning’s 12 UTC map.) Because of its complexity, the last variable, vorticity (a measure of atmospheric rotation), is optional. Vorticity data can be accessed via alternative online archives (e.g., https://vortex.plymouth.edu/~wxp/upa/ovrmap.html) or by searching for “vorticity archives.” Students then shade those cells that indicate favorable conditions for severe weather per the guidance under each variable in the table. Most variables are correlated with rising motion in the atmosphere, which includes the presence of the following:
- a trough (dip in the jet stream) that is “deep” (of high amplitude) and of “negative” tilt (northeast to southwest-oriented trough axis)
- “fast” jet stream winds
- a divergent signature (spreading out, V-shape pattern) in the height lines
- the left exit or right entrance quadrant of a jet streak (local jet stream maximum)
- positive vorticity advection (PVA)
Appendix B shows the completed artifact for the suite of 2019 events. As students progress through the activity, a key discussion point is recognizing that not all factors need to be present for severe weather to occur.
Activity 3: Collecting surface data
Artifact
The artifact is the same as the one for Activity 2, with “surface” replacing “upper-level.”
Tasks
Students proceed through the same process as the second activity, with the focus shifting to analyzing surface weather maps concurrent with the time of severe weather. Because surface data are more frequent than upper-level data (every 3 hours as opposed to 12 hours), students can assess more accurately the atmospheric conditions at the time of the severe weather.
Surface data analysis for the 2019 events is shown in Appendix C. Shaded cells highlight those conditions that foster rising motion, such as the following:
- the presence of a “strong” mid-latitude cyclone
- proximity to a cold and/or warm front
- a location in the mid-latitude cyclone’s Larko’s Triangle (Nese et al., 2018)
- “high” dew point (moisture content)
- “strong” warm-air advection (air transporting relatively warmer air into the region)
Activity 4: Collecting
sounding data
Artifact
The artifact is a quantitative analysis of six commonly used severe weather variables over the region for each severe weather day, using sounding data from radiosondes, which provide vertical profiles of temperature, dew point, and wind.
Tasks
To complete the table shown in Appendix D, students transcribe for the radiosonde site closest to the location and time of severe weather the values of surface CAPE, surface LI, K-Index, surface-3 km SRH (helicity), and WBZ height. Although these values are automatically computed from the sounding data, the Total Totals (TT) Index can be calculated manually (see Miller, 1972) if the instructor wishes to offer students experience with extracting temperature and dew point from a Skew-T/Log-P chart.
Typically, one radiosonde site at either 00 UTC or 12 UTC is sufficient for analysis. However, radiosonde sites are separated over the continental United States, on average 200 miles apart (approximately 300 kilometers). Severe weather thus inevitably occurs between sites. Likewise, temporally averaging the 12 UTC and 00 UTC data is suggested for severe weather that occurred closer to 06 UTC or 18 UTC. Students are cautioned to cross-reference sounding data with the surface and radar maps to ensure the data reflect an air mass characteristic like one at the time of severe weather. A frontal passage or a thunderstorm occurring before the radiosonde launch will provide data unrepresentative of the actual severe weather conditions.
Once variable data are retrieved, students again shade cells to highlight those values that reflect an atmospheric state conducive for severe weather.
Activity 5: Data synthesis
Artifacts
Students calculate the percentage of the five cases in which each variable was present or favorable for severe weather, with modified threshold values for the quantitative variables, if necessary.
Tasks
The final synthesis activity has two parts. First, students complete the table in Appendix E by reviewing their artifacts from the first four activities and calculating for each qualitative variable the percentage of the five severe weather events that had been shaded. This procedure is repeated for the quantitative variables listed in Appendix F. Students then adjust the variables’ thresholds based on their case study analysis if they are different from the established thresholds shown in Appendix F. For helicity and WBZ height, remind students to consider in the calculation only those cases in which a tornado or hail, respectively, was observed. Appendices E and F show a synthesis of the 2019 events.
The artifacts serve as points of discussion for the instructor and are beneficial to students as they formulate their conclusions. The following evaluation and reflection questions can help guide students to construct several takeaway messages from the PBL. We provide sample responses to each question based on the 2019 analysis.
- Evaluation: Which qualitative variables are most reliable for generating severe weather locally? Daytime heating and sun angle are important; all cases had a mid-latitude cyclone with accompanying front present to generate air convergence; additionally, an upper-level divergent signature and trough approaching from the west were evident in many cases.
- Evaluation: Do the established thresholds for the quantitative variables apply locally? If not, in which direction (higher or lower) is the bias? The recommended threshold values are loosely valid for Pennsylvania; although many thresholds could be increased, that of the TT Index should be lowered; helicity values were partially reliable, but the WBZ height range should be expanded on the higher end.
- Evaluation: For those cases in which a key ingredient was missing (e.g., wintertime event, limited moisture), was there an elevated alternate variable to compensate for this deficiency? In 2019, severe weather occurred in late October with cooler temperatures; however, on this day, the mid-latitude cyclone and associated trough were particularly intense, with the jet stream winds unusually strong; atmospheric dynamics overcame the thermodynamic limitations.
- Reflection: What is one thing you learned about atmospheric behavior from this PBL? Severe weather can be generated with a mix of atmospheric conditions, with some having greater predictive value. As such, each day is unique. Because there were cases when wind shear was high with no observed tornadoes, severe weather forecasting remains imperfect.
PBL deliverables with class discussion
Students should now feel confident completing two PBL deliverables that will allow them to effectively communicate the answer to the project’s driving research question. The first deliverable is a 20-minute presentation by each student pair; the second is an individually constructed manuscript. The two formats allow students to hone diverse skills. The oral presentation emphasizes collaboration, public speaking, and how to showcase data judiciously and effectively, and the manuscript stresses effective scientific communication, thoroughness, and perseverance. The deliverables are significant undertakings, so we suggest at least one checkpoint during the semester (e.g., after Activity 1) to allow students to revise draft versions of each deliverable.
As the presentations unfold, the instructor should facilitate additional learning moments for the class as each pair reveals the antecedent severe weather conditions particular to their year’s events—that is, each group holds a component to the broader realization that there are recurring atmospheric factors that favor severe weather. To encourage active listening by those not presenting, one recommendation is to ask students to write three questions they still have (or would want to pursue) and how those questions could be answered after proceeding through the research PBL. This final piece is critical in fostering student inquiry, a key PBL tenet, because many of the activities presented in this article are prescriptive.
The final class is then devoted to a robust, student-driven discussion on the commonly asked student questions generated from the presentations. The instructor can guide students to their answers by having them apply the knowledge, skills, and research methodology acquired from the PBL. Example follow-up questions include the following:
- Are the top severe weather variables and their threshold values valid for other areas of the country?
- Could severe weather occur without any of the traditional severe weather variables present?
- Can analyzing past events also improve forecasts of other significant weather events, such as snowstorms and hurricanes?
PBL assessment
Five geoscience majors at a university enrolled in a second-semester meteorology course in spring 2020 volunteered to participate in a pre- and postsurvey set of identical questions. The first set of questions asked students to assess on a 4-point (1 to 4) Likert scale their comfort, experience, and confidence with respect to the PBL components: data collection, data analysis, presentation, manuscript, and identification of severe weather ingredients.
Figure 2 reveals the mean student response scores before (open circles) and after (filled circles) the PBL was conducted. Overall, it was encouraging to see the PBL impact on students’ affective attitudes in many areas. The most notable increases were with respect to students’ comfort and experience in constructing a research manuscript (average score 2.5 pre-PBL to 3.2 post-PBL) and, more notably, presenting a longer, more professional oral presentation (average comfort and experience score pre-PBL 1.5 to 2.5 post-PBL). This was a reassuring result because these PBL components provide students with practical and transferrable skills that will serve them well as future employees or graduate students. Kolber (2011) also showed that a PBL in a biology course improved students’ scientific communication skills. More limited impacts were apparent with the data collection (average comfort and experience score pre-PBL 3.2 to 3.5 post-PBL) and analysis (3.4 to 3.4) components as the geoscience majors indicated an already high level of assurance when working with data, presumably from encountering data-intensive assignments in other program courses.
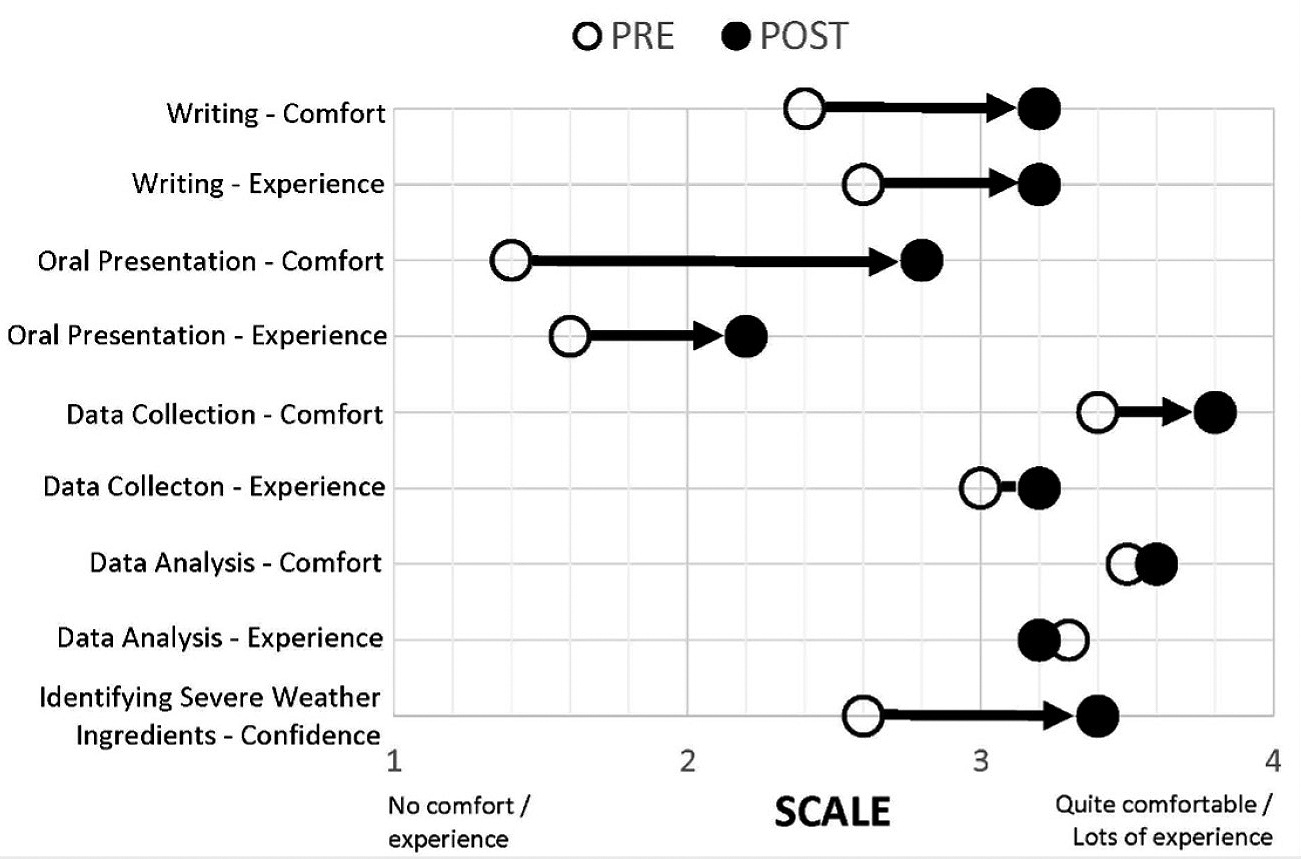
Mean pre- and post-PBL student survey scores.
Students were also asked in the survey to list atmospheric ingredients conducive for tornadoes, hail, and damaging winds. Table 2 compares the pre- and post-PBL distribution of student responses when asked to identify those factors. In the pre-PBL survey, students could correctly identify several key severe weather ingredients from base knowledge recalled in an introductory meteorology course. After the PBL, students were able to expand on the list of conditions. Most apparent was their ability to identify several additional processes that cause rising motion in the atmosphere. Students could additionally expand on the various measures of atmospheric stability (e.g., K-index, CAPE) and, for each measure, specify a threshold favorable for severe weather. These thresholds were derived directly from their case study analysis.
Conclusion
The research PBL showcased in this article provides the instructor with an additional option beyond lecture to extend students’ foundational meteorological knowledge. Key project attributes include student collaboration, online case study analysis, severe weather forecasting, and effective scientific communication so that students may better understand those atmospheric conditions that lead to tornadoes, hail, and damaging winds.
Joby Hilliker (JHilliker@wcupa.edu) is an associate professor of meteorology in the Department of Earth and Space Sciences at West Chester University in West Chester, Pennsylvania. Shannon Hilliker was an assistant professor of TESOL in the Department of Teaching, Learning, and Educational Leadership at Binghamton University in Binghamton, New York, when this article was written.
Earth & Space Science Research STEM