
Feature
Small Instructional Changes to Emphasize Data Modeling Practices
Journal of College Science Teaching—March/April 2021 (Volume 50, Issue 4)
By Joshua W. Reid, Candice M. Quinn, Zhigang Jia, Ryan Jones, and Anna Grinath
Data modeling practices are often invisible to students in introductory biology courses. However, developing a well-rounded understanding of these practices is critical for scientific literacy. Furthermore, introductory undergraduate science laboratory courses are often taught by graduate students or novice instructors with little autonomy, pedagogical preparation, and support to implement changes. In this manuscript, we describe three small instructional changes that can be used to create space for student reasoning about and interaction with data modeling practices. Additionally, we describe how these small changes fostered student thinking and discussions about variation in data, sources of variability, the importance of shared procedures, and predictions of sampling variability. We argue that instructors do not have to redesign curriculum to emphasize data modeling practices. Instead, this manuscript presents small instructional changes that can be implemented within a variety of undergraduate science classrooms and laboratories.
When generating knowledge about the natural world, scientists make decisions about how to capture qualitative observations through quantifiable measures. Although the decisions underlying data collection and analysis practices can seem invisible, members of the scientific community generally respond to scientific claims with critiques to make those decisions explicit. For example, they might ask how individuals were sampled from a population, how variables were measured, and why those measurements were the most appropriate to answer the research questions. This critical stance in response to scientific claims encapsulates what Ford (2008) refers to as a “grasp of scientific practice” (p. 150). An important goal for science education from elementary and secondary levels (NRC, 2012) to postsecondary levels (AAAS, 2011; NRC, 2011; NRC, 2015) is to support all students to develop a grasp of practice by moving past a focus on what we know in science to emphasizing how we know it and why one claim might be accepted over plausible competing alternatives (Duschl, 2008).
One way to promote a grasp of practice in science classrooms is through an emphasis on data modeling. Data modeling practices include: identifying attributes and measures that address a research question, how to sample populations, structuring data as distributions, and statistics to measure distributional characteristics (Lehrer & Schauble, 2004; Petrosino & Mann, 2018). Science laboratory courses generally provide opportunities for students to interact with data, and all undergraduates are commonly required to take at least one laboratory course. These two features highlight general science laboratories as a critical space to engage all students in data modeling practices to develop a grasp of practice. However, typical science laboratory courses provide structured procedures for data generation and analysis for students to verify a desired outcome (Blanchard et al., 2010). This verification structure limits students’ opportunities to develop a grasp of practice because they do not get to participate in the decision-making process to negotiate those procedures.
This article describes three small instructional changes (SICs) that fostered opportunities for students to engage meaningfully with data modeling practices in a highly structured laboratory course. These SICs were successfully implemented by a graduate teaching assistant (GTA) within a prescribed curriculum. Many laboratory classes are taught by GTAs or early career faculty who likely do not have the time, autonomy, or pedagogical training to redesign entire laboratories, but who are eager to support their students to develop a grasp of scientific practice. This article will enable science laboratory instructors to integrate authentic data modeling practices into their varied teaching contexts and provide exemplars of the forms of authentic student engagement that were evoked through these SICs.
Data modeling practices
Data modeling refers to the practice of organizing, describing, and making meaning from data for the system in question (Houle et al., 2011; Petrosino & Mann, 2018). Educational research has highlighted three important components for students to develop an understanding of data modeling: variability, distributions, and sampling (e.g., Petrosino & Mann, 2018). Variability refers to differences found either among individuals (i.e., natural variability), when repeatedly measuring the same individual (i.e., measurement variability), when manipulating variables (i.e., induced variability), or from multiple samples of a population (i.e., sampling variability). This topic is central for students to be able to make comparisons between data samples and reasonably draw inferences from the data; therefore, we argue that making sense of variability is fundamental for students to be able to quantify biological constructs and generate claims from data models. One way to make sense of variability is through the notion of distribution, and how a collection of measurements takes on meaningful shapes when organized on a number line (Lehrer & Schauble, 2004).
Prescribed laboratory context and focal investigation
The authors (including the instructor) worked together to draw on the data modeling literature (Lehrer & Schauble, 2004) and design SICs to emphasize data modeling practices in an undergraduate biology context. We describe how each change repeatedly engaged students in data modeling practices within one section of a general biology laboratory course for nonscience majors at a large, public university in the southeastern United States. Consistent with design-based research (Cobb et al., 2003), we examined five different investigations to test the stability of the linkages between the carefully designed changes and the forms of data modeling practices evoked by those designs. Based on the stability we observed and the alignment of these changes to existing literature, our findings contribute practical strategies for emphasizing data modeling practices in undergraduate settings that we hope will be taken up and further tested by biology instructors.
The laboratory curriculum was composed of prescribed investigations. We implemented the changes and described student practices for five investigations grounded in different types of data models that were evenly spaced throughout the semester: (1) repeated measures of human reaction time, (2) pillbug behavior, (3) osmosis in potato cores, (4) fermentation, and (5) seed germination. During each iteration, we observed these changes creating opportunities for students to use data modeling practices. We illustrate the three SICs from the first investigation and our observations of students’ data modeling practices. We chose to highlight the first investigation to capture how the changes evoked data modeling practices on the first day of class before classroom norms for interaction were established. This illustration might be more broadly informative to undergraduate biology educators.
The goal of the focal investigation was for students to experience the challenge of describing and quantifying variables using methods of comparing reaction time of a dominant and nondominant hand. In pairs, students were instructed to drop and catch a ruler with their dominant and nondominant hands four times. Students measured the distance the ruler fell for each trial (i.e., reaction distance), calculated their individual mean reaction distance across four trials for each hand, and entered this mean into a common spreadsheet, which calculated mean reaction distance with standard error for the class.
Small instructional changes emphasizing data modeling practices
We designed three SICs to promote authentic data modeling practices: mucking around with measurement, organizing data as distributions, and making predictions about other laboratory sections’ findings. The designs of each change were guided by literature on learning cycles, student learning theories, and model-based learning. The following sections provide a brief theoretical rationale and an illustration within the focal laboratory investigation for each change.
Mucking around with measurement
The SIC we named “mucking around with measurement” is aligned with learning cycles. Exploration phases of learning cycles (Abdulwahed & Nagy, 2009; Withers, 2016) can be easily implemented into a prescribed curriculum by allowing students to explore the data collection materials before explicit instruction about protocols. This phase places emphasis on the procedures and materials used for the activity by creating space for students to grasp the why behind the activity (Abdulwahed & Nagy, 2009), and evoking discussion around investigation design issues and measurement variability.
In the focal investigation, students were prompted to muck around with dropping and catching the ruler before collecting data for analysis (see Figure 1A). As the quote illustrates, while mucking around, students were encouraged to ask questions about the measurement tools and biological systems, and to consider what might happen when all of the students attempted to use the tools to make measurements of the same system. Students explored by dropping and catching rulers and considering how to measure reaction time. This occurred after a brief discussion about why making claims in biology may be difficult (i.e., making inferences about a population from a sample) and before any explicit directions about how to drop and catch the ruler, what types of data to collect, and how many times to repeat the drop. Although specific instructions were in the laboratory manual, students had not been previously instructed to read these directions.
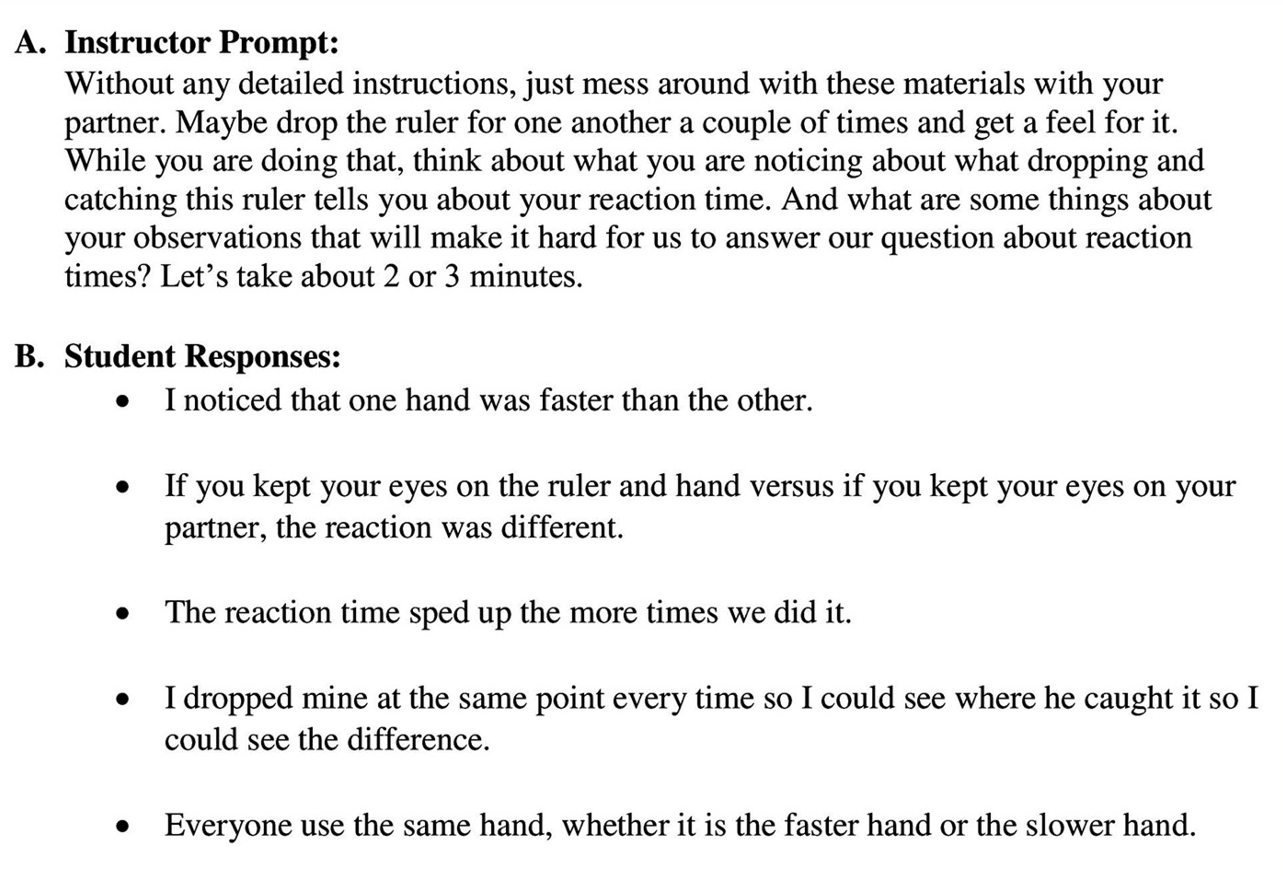
Example prompt and student responses for Mucking Around with Measurement.
Through mucking around, the students noticed aspects of the system and the measurement tools that were important to consider as a class to accurately capture reaction time. The instructor prompted, “So what are some of the things that you noticed as you were mucking around and dropping and catching the ruler?” See Figure 1B for student responses.
Students noticed that one hand was faster, which indicates that they noticed variation in the procedure they used (i.e., which hand was used). Students also discussed the source of this variability, one student mentioned making eye contact could have contributed to this variability whereas another student talked about how there was a practice effect. This discussion made visible the importance of a shared procedure for data collection to reduce measurement variability. In the conversation that followed, students mentioned that everyone should drop the ruler at the same time and place.
Organizing data as distributions
We designed a SIC to allow students to visualize the focal phenomenon in the investigation by collaboratively constructing a frequency distribution to mirror how scientists generate data representations to emulate natural phenomenon in order to convince others (Airey & Linder, 2009; Ford, 2008). Each student added and organized their data point within the class data set using materials to highlight each individual student’s contribution to the shape of the class distribution in real time. The materials and representation changed throughout the semester. Sometimes each student contributed their data point to the class distribution using sticky notes, making “dots” or “Xs” on a whiteboard number line, or putting their individual data into software such as Tinkerplots (Konold & Miller, 2005). In addition to allowing students to generate and take ownership of their data, this method of using cheap and available resources allowed for mistakes, which provide rich opportunities for discussion (Borasi, 1996; Lischka et al., 2018).
In the context of the focal investigation, the prescribed procedure was for students to plug their data into a common spreadsheet to automatically calculate a measure of the class mean and standard deviation needed to compute a 95% confidence interval. To engage students in data modeling practices instead of using the spreadsheet, students constructed a distribution to visualize the variability in their data before calculating descriptive statistics (Figure 2). After mucking around, students decided to measure the reaction time of their dominant hand 10 times, wrote each measurement on an individual sticky note, and added their sticky notes to the class distribution on a large whiteboard.
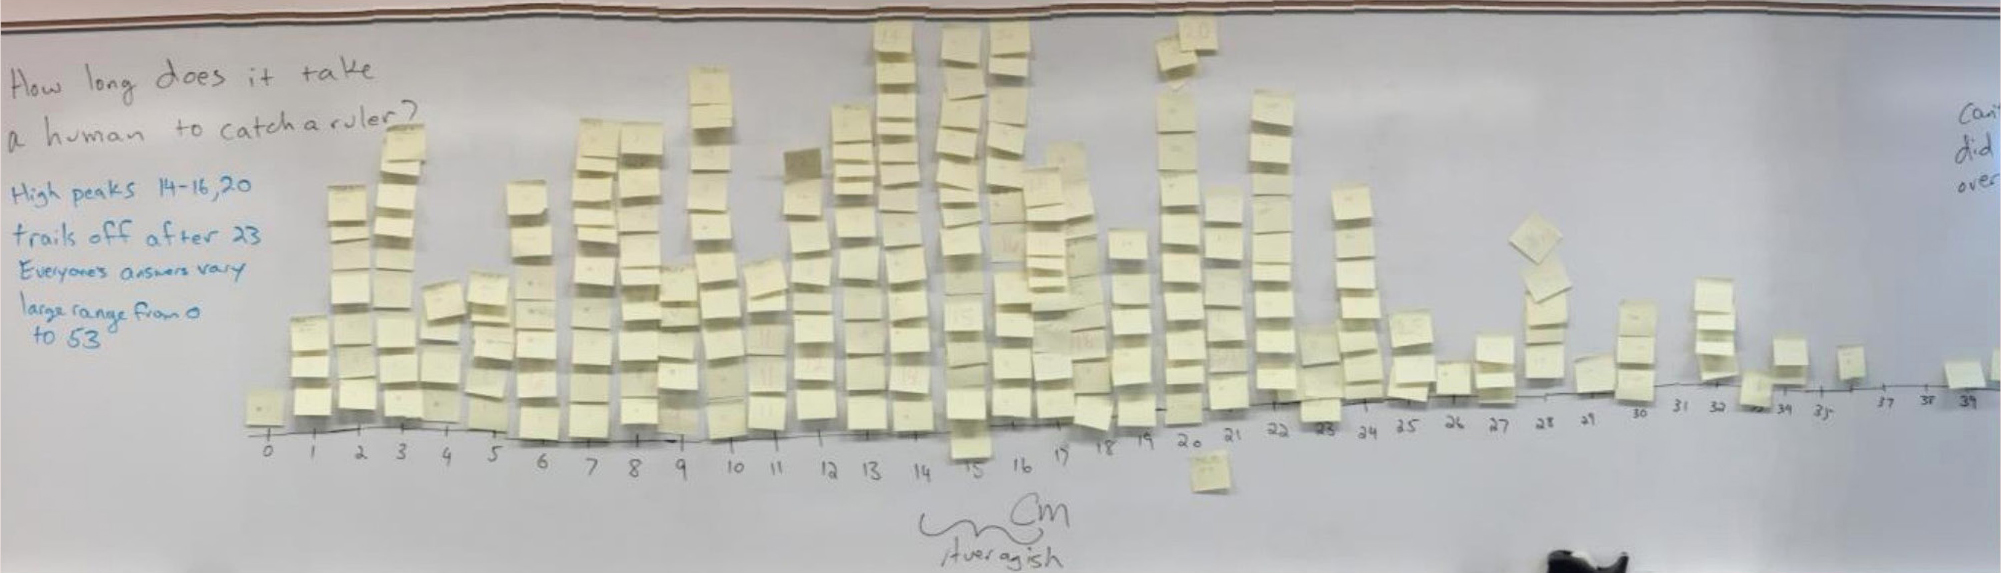
Student-generated data distribution with sticky notes.
This change made student-generated data visible as a distribution, which evoked observations of the central tendency, spread of the data, data points that might represent errors in data collection, and consideration of what claims they would be comfortable making about reaction distance based on the data. For example, in the following conversation students discussed common and extreme values in the data distribution:
Instructor: What things do you think you can see when you look at the data this way?
Student A: High peaks.
Instructor: Any other things?
Student B: It trails off after 23.
Student A: No more high peaks after 23.
Student C: Everybody’s answers vary.
Instructor: Tell me what you mean by that.
Student X: Large range, from zero to 53.
Student X: There’s no way to tell if people got better or worse over time; lack of progression, if any.
Instructor: Right, so there’s things we can see, but there are some things we can’t see.
Additionally, students commented on the frequency of certain data points, how the mean differs from the median and mode as a measure of central tendency, what may have caused variation within their data, and the differences between measurement and induced variability. Anecdotally, students had not paid attention to these details in previous semesters without this change.
Making predictions about other laboratory sections’ findings
Sampling variability is an important component of data modeling practices (Franklin et al., 2007), yet students are typically limited to the “sample” of their classroom. Therefore, we designed a SIC to prompt students to predict what they think other laboratory sections might find when they do the same experiment based on what they found in their laboratory section. This change positions each laboratory section as a different sample of a population and emphasizes sampling variability and how randomness has structure, with some outcomes being more likely than others. This activity is at the heart of understanding why scientists can make inferences about populations of organisms based on carefully collected data from one sample of that population.
To implement this change, the instructor asked, “Would the lab section after yours have similar data or data display? Why or why not?” This prompted students to consider the types of variability represented in their sample distribution and how it informs their predictions about the expected variation in a subsequent sample and the expected variation of the population. An example from one of these discussions follows:
Instructor: What if another lab class came in here right after ours, students very much like you all, not clones of you, but you know, typical students like you all, and what if they collected data using the exact same procedure you did. What do you think their sticky note wall would look like?
Student A: Similar.
Instructor: Okay, I am hearing similar. I am also seeing some shrugs that maybe suggest like there is no way to know. I don’t know, what do you guys think? Do you think they would get the exact same numbers we got?
Student B: No.
Instructor: Okay, I am hearing a definitely not on that. Do you think their numbers would resemble ours at all? Or is it just we have no way of telling. There is no possible way to know.
Student C: They may get the same range, but they won’t get the exact like bullets that we have.
Instructor: Okay, so they are not going to get the exact bullets but I heard that maybe they would have the same range. Maybe between zero and 53 all of theirs would fall. Anything else you think would be similar about theirs, maybe?
Student D: The pattern. There could be the same pattern maybe.
Instructor: Okay so do you mean things like trailing off after 23? That maybe theirs would kind of follow that same pattern?
Student D: Yeah or maybe after that.
Instructor: Yup. I wonder if maybe even their peaks would be in a similar area as ours. Would you be very surprised if a class just like you all had their highest peaks at 30 or 31 or 32?
Student E: Yes.
Instructor: Why would you be very surprised by that?
Student E: Because in this whole class nobody got that high so it would be kind of strange if a whole bunch of people got that in the other class.
Instructor: Yeah because it might make you think, whoa whoa whoa, are we sure we used the same procedure? Or is something weird going on here? Because there is something that jumps out really different than ours.
As seen in this excerpt, students argued that observing a region of high frequency in the tail of their distribution would be unlikely because other classes would create data with the same pattern. This suggests that students were reading the shape of the distribution as an indication of which measurements were more likely to be observed across repeated sampling than others. This discussion could not have happened without the opportunity to examine the data through a sticky note distribution. This idea is important for understanding sampling variability, and tools such as confidence intervals that represent likelihood of observing particular statistics across repeated samples (Petrosino & Mann, 2018). Students used this overall pattern observation to infer that although exact data points would not necessarily be the same, similar populations should have similar patterns. Overall, this change evoked students’ underlying assumptions of population sampling and laid the groundwork for future conversations about sampling distributions, standard error, and confidence intervals.
Conclusion and implications
Data modeling practices are important components of scientific inquiry and undergraduate science education. Oftentimes undergraduate laboratories confine students to interact with data in very structured ways, leaving aspects of scientific inquiry and data modeling practices invisible to students. This article illustrates how SICs, requiring little time, can create opportunities for students to authentically engage in data modeling practices, even within prescribed laboratory contexts. Such engagement is critical if undergraduates are to develop a grasp of practice to apply appropriate critique to the underlying assumptions of scientific claims they encounter.
We assert that incorporating data modeling practices does not require an overhaul of course structure. Small changes can shift the dynamics of the learning environment to evoke data modeling discussions and practice. Our findings are useful for anyone who teaches biology laboratories, specifically those with little autonomy over course structure, such as GTAs. However, these findings are from a single laboratory section. Although we observed a stable connection between each SIC and student participation in data modeling practices in this class, others who implement these changes might observe different forms of student participation. This work was the product of one GTA’s pedagogical discontentment (Southerland et al., 2011) and the SICs were designed through a collaboration of all authors. We hope biology instructors will implement these changes and further test their stability for emphasizing data modeling practices in diverse contexts (i.e., additional laboratory sections, other science courses) to build toward generalization. We offer the following advice to instructors wishing to implement these changes. It is important for the instructor to be clear on the goal and rationale of each change. To reflect on this alignment, we suggest that instructors read this paper with a colleague, come to a common understanding of the goals and rationale of each change, and invite the colleague to observe their teaching and then reflect on how the changes were enacted and evoked observable interactions. This could be extended with interested GTAs as a form of training; however, the purpose of this article is to offer some tools for instructors who are seeking to support students in data modeling practices and is not intended to guide GTA training. ■
Joshua W. Reid (Joshua.reid@mtsu.edu) is a postdoctoral research fellow at the Tennessee STEM Education Center at Middle Tennessee State University in Murfreesboro, Tennessee. Candice M. Quinn is the director of the Mathematics Learning Center at the University of North Alabama in Florence, Alabama. Zhigang Jia is a doctoral candidate in Mathematics and Science Education at Middle Tennessee State University in Murfreesboro, Tennessee. Ryan Jones is an assistant professor in the College of Education at Middle Tennessee State University in Murfreesboro, Tennessee. Anna Grinath is an assistant professor in the Department of Biological Sciences at Idaho State University in Pocatello, Idaho.
Literacy Teaching Strategies Technology