
Research & Teaching
Building Bridges
An Active Learning Lesson in Evolution and Collaboration
Journal of College Science Teaching—May/June 2019 (Volume 48, Issue 5)
By Kelly A. Carscadden, Molly T. McDermott, Sheela P. Turbek, Silas B. Tittes and Andrew P. Martin
We describe a hands-on, collaborative activity designed to illustrate general properties of evolution, provide practice for quantitative skills, promote creativity and collaboration, and enable student self-assessment of learning. During the activity, teams construct bridges using common office supplies. The best-performing bridge becomes the template for a second generation of bridges. After students have tested two generations of bridges, they manipulate, visualize, and analyze their data. Using these analyses, students make evidence-based claims about key evolutionary concepts: adaptation, trade-offs between traits, and complexity. Our study included multiple lab sections (analogous to populations), so students see that evolution can proceed differently across populations. Student responses indicated the activity fostered community and teamwork, helped students understand evolution, and improved their quantitative skills. To assess how well this activity illustrated predictions of evolutionary theory, we analyzed the full dataset across lab sections. This activity incorporates science teaching best practices and could be readily adapted for learning goals beyond evolution.
Evolution is widely recognized as an important core concept for understanding biology (Am erican Association for the Advancement of Science [AAAS], 2011). An increasing number of online resources (e.g., Wei, Beardsley, & Labov, 2012), computer software for simulation-aided instruction (e.g., Kliman, 2008; Zurita, 2017), and published activities and labs (e.g., Christensen-Dalsgaard & Kanneworff, 2009; Ratcliff, Raney, Westreich, & Cotner, 2014) have been developed around key principles of evolution. Alongside these core concepts, incorporating core competencies like collaboration and quantitative skills is crucial in undergraduate education (e.g., Vision and Change report on undergraduate education in biology [AAAS, 2011]; Next Generation Science Standards [NGSS Lead States, 2013]; Kober’s [2015] report to improve undergraduate STEM education). Some of the activities that best engage students in the scientific process (e.g., experiments like Ratcliff, Raney, Westreich, & Cotner’s [2014] lab focused on the evolution of multicellularity) require daily monitoring of experiments, which is often not possible for typical university settings with once-a-week lab sections. In addition, activities need to scale to accommodate 100 or more students in large-enrollment classes without imposing a significant burden on the instructor. Given the need to address multiple learning dimensions simultaneously in ways that integrate real-world skills and big-picture concepts (Laverty et al. 2016) and scale to large class sizes, developing engaging and effective curricula for teaching evolution is challenging. Despite decades of curriculum development, few activities integrate concepts of evolution with quantitative and collaborative skill building.
Active learning that combines collaboration, structured (or scaffolded) problem solving, and self-reflection may help students learn not only course content, but also strategies for learning, interacting, and problem solving that transcend the classroom (see Deslauriers, Schelew, & Wieman, 2011; Freeman et al., 2014; Haak, HilleRisLambers, Pitre, & Freeman, 2011; Hacker, Dunlosky, & Graesser, 1998; Jensen, Kummer, & Godoy, 2015; Smith, Douglas, & Cox, 2009; Tanner, 2012). Cooperative learning, where students work together to solve problems, may be an especially important core competency in large undergraduate classes, where it creates social communities and support networks for students (Faust & Paulson, 1998; Frederick, 1987; Slavin, 1996). Moreover, in the workforce, scientists learn cooperatively.
We created an activity using the Instant Challenge model from the Destination Imagination program (e.g., Students for a Creative Iowa, 2017) as a template. Our activity emphasizes two important science core competencies (quantitative reasoning and effective communication and collaboration; AAAS, 2011), encourages metacognition, and explores core concepts of evolution. The activity involves students building and assessing the performance of two generations of bridges constructed out of common office supplies (Table 1). By simulating evolution using inanimate objects, the activity encourages students to work together to test predictions from evolutionary theory. In this way, students learn that evolution explains changes over time in much the same way for inanimate objects (e.g., bridges, cell phones) and cultural phenomena (e.g., art, music) as it does for biological organisms (Boyd & Richerson, 1988). Our activity demystifies evolutionary thinking using familiar objects.
| Table 1. List of bridge-building materials for each team (list can vary depending on the availability of office supplies). | |||||||||
|---|---|---|---|---|---|---|---|---|---|
|
Core principles of evolution
Evolution by natural selection has few key ingredients: There is heritable variation among individuals, and the individuals that are best suited to the current environment will have greater fitness (contribute disproportionately more offspring to the next generation than other individuals; Darwin, 1859; Lenski, Rose, Simpson, & Tadler, 1991). Through the activity, students collect data to test four predictions from evolutionary theory: (1) Traits vary among individuals within a population, leading to fitness differences among individuals. Variation is considered the fuel for evolution: without variation, evolution is impossible. (2) If the traits that lead to fitness differences are heritable, average fitness increases from one generation to the next—a process called adaptation. (3) There are trade-offs between traits (e.g., Nijhout & Emlen, 1998; Novak, Pfeiffer, Lenski, Sauer, & Bonhoeffer, 2006; Studer, Christin, Williams, & Orengo, 2014; but also see Roff & Fairbairn, 2007). That is, an increase in one trait is accompanied by a decrease in another trait. Limited resources that prevent an organism from maximizing all traits simultaneously, or a gene that influences multiple traits that have opposing effects on fitness (antagonistic pleiotropy), could generate trade-offs. In Building Bridges, we expect a trade-off between bridge length and the load a bridge can support. Clearly the most “fit” bridge is both long and strong, but because the building supplies (resources) are limited, a longer bridge may be weaker than a shorter bridge. (4) Complexity often increases over generations (McShea, 1996), although there is also evidence that selection can favor greater simplicity or economy (Goodwin, 2001). In Building Bridges, we predict an increase in bridge complexity—measured as the diversity of items incorporated into bridges—from the first to second generation, in part because students will become better builders. Last, evolution can proceed differently in isolated populations because of the randomness of mutation, emergence of novelty, and selection (e.g., Blount, Borland, & Lenski, 2008). In our implementation of Building Bridges, students were distributed across different lab sections (isolated populations) and, from a limited set of resources, constructed bridges that were subjected to an identical performance challenge. Thus, after two generations of bridges, students compared results across lab sections to explore whether bridges that experienced the same selection pressures evolved similarly or not.
Methods
This activity was developed and administered across six semesters in an upper division course, Evolutionary Biology, taught by multiple instructors at the University of Colorado, Boulder. Here, we present data from our most recent iteration (spring 2018), when we included student self-reflection. The spring 2018 class comprised 136 students split across nine lab sections (13–20 students each section). Most enrolled students were biology majors in their junior (43%) or senior (28%) year. We ran this collaborative activity during the second week of the semester to foster community and introduce foundational principles of evolution. The research did not require IRB approval because it was not designed to produce generalizable information; moreover, all student information is anonymous, is de-identified, and cannot be linked to any individuals.
We ran the activity over an hour and 50 minutes, in four stages: (1) a 10- to 20-minute introductory presentation to review the predictions and planned analyses (Appendix 1, available online at ); (2) bridge construction; (3) analysis—data assembly, visualization, and analysis; and (4) reflection—student assessment of the activity and their learning gains. The bridge construction involved students working in teams of three to four to (1) make a bridge that spans an abyss, (2) test whether the bridge successfully transports balls of different size and mass across the abyss, (3) record bridge characteristics, (4) rank bridge fitness, and (5) identify the most fit bridge and use that bridge as a model (ancestor) for repeating steps 1–4 above (FIGURE 1; Table 1). Bridge span (bridge length) and load (the weight a bridge can support) are key traits for bridge function, so we quantify bridge “fitness” as a combination of these two traits. It is important to note that we limited bridge construction time to 8 minutes, so teams that worked collaboratively and divided tasks should be most successful. This activity is particularly well suited for relatively large classes to enable students to replicate the process of evolution.
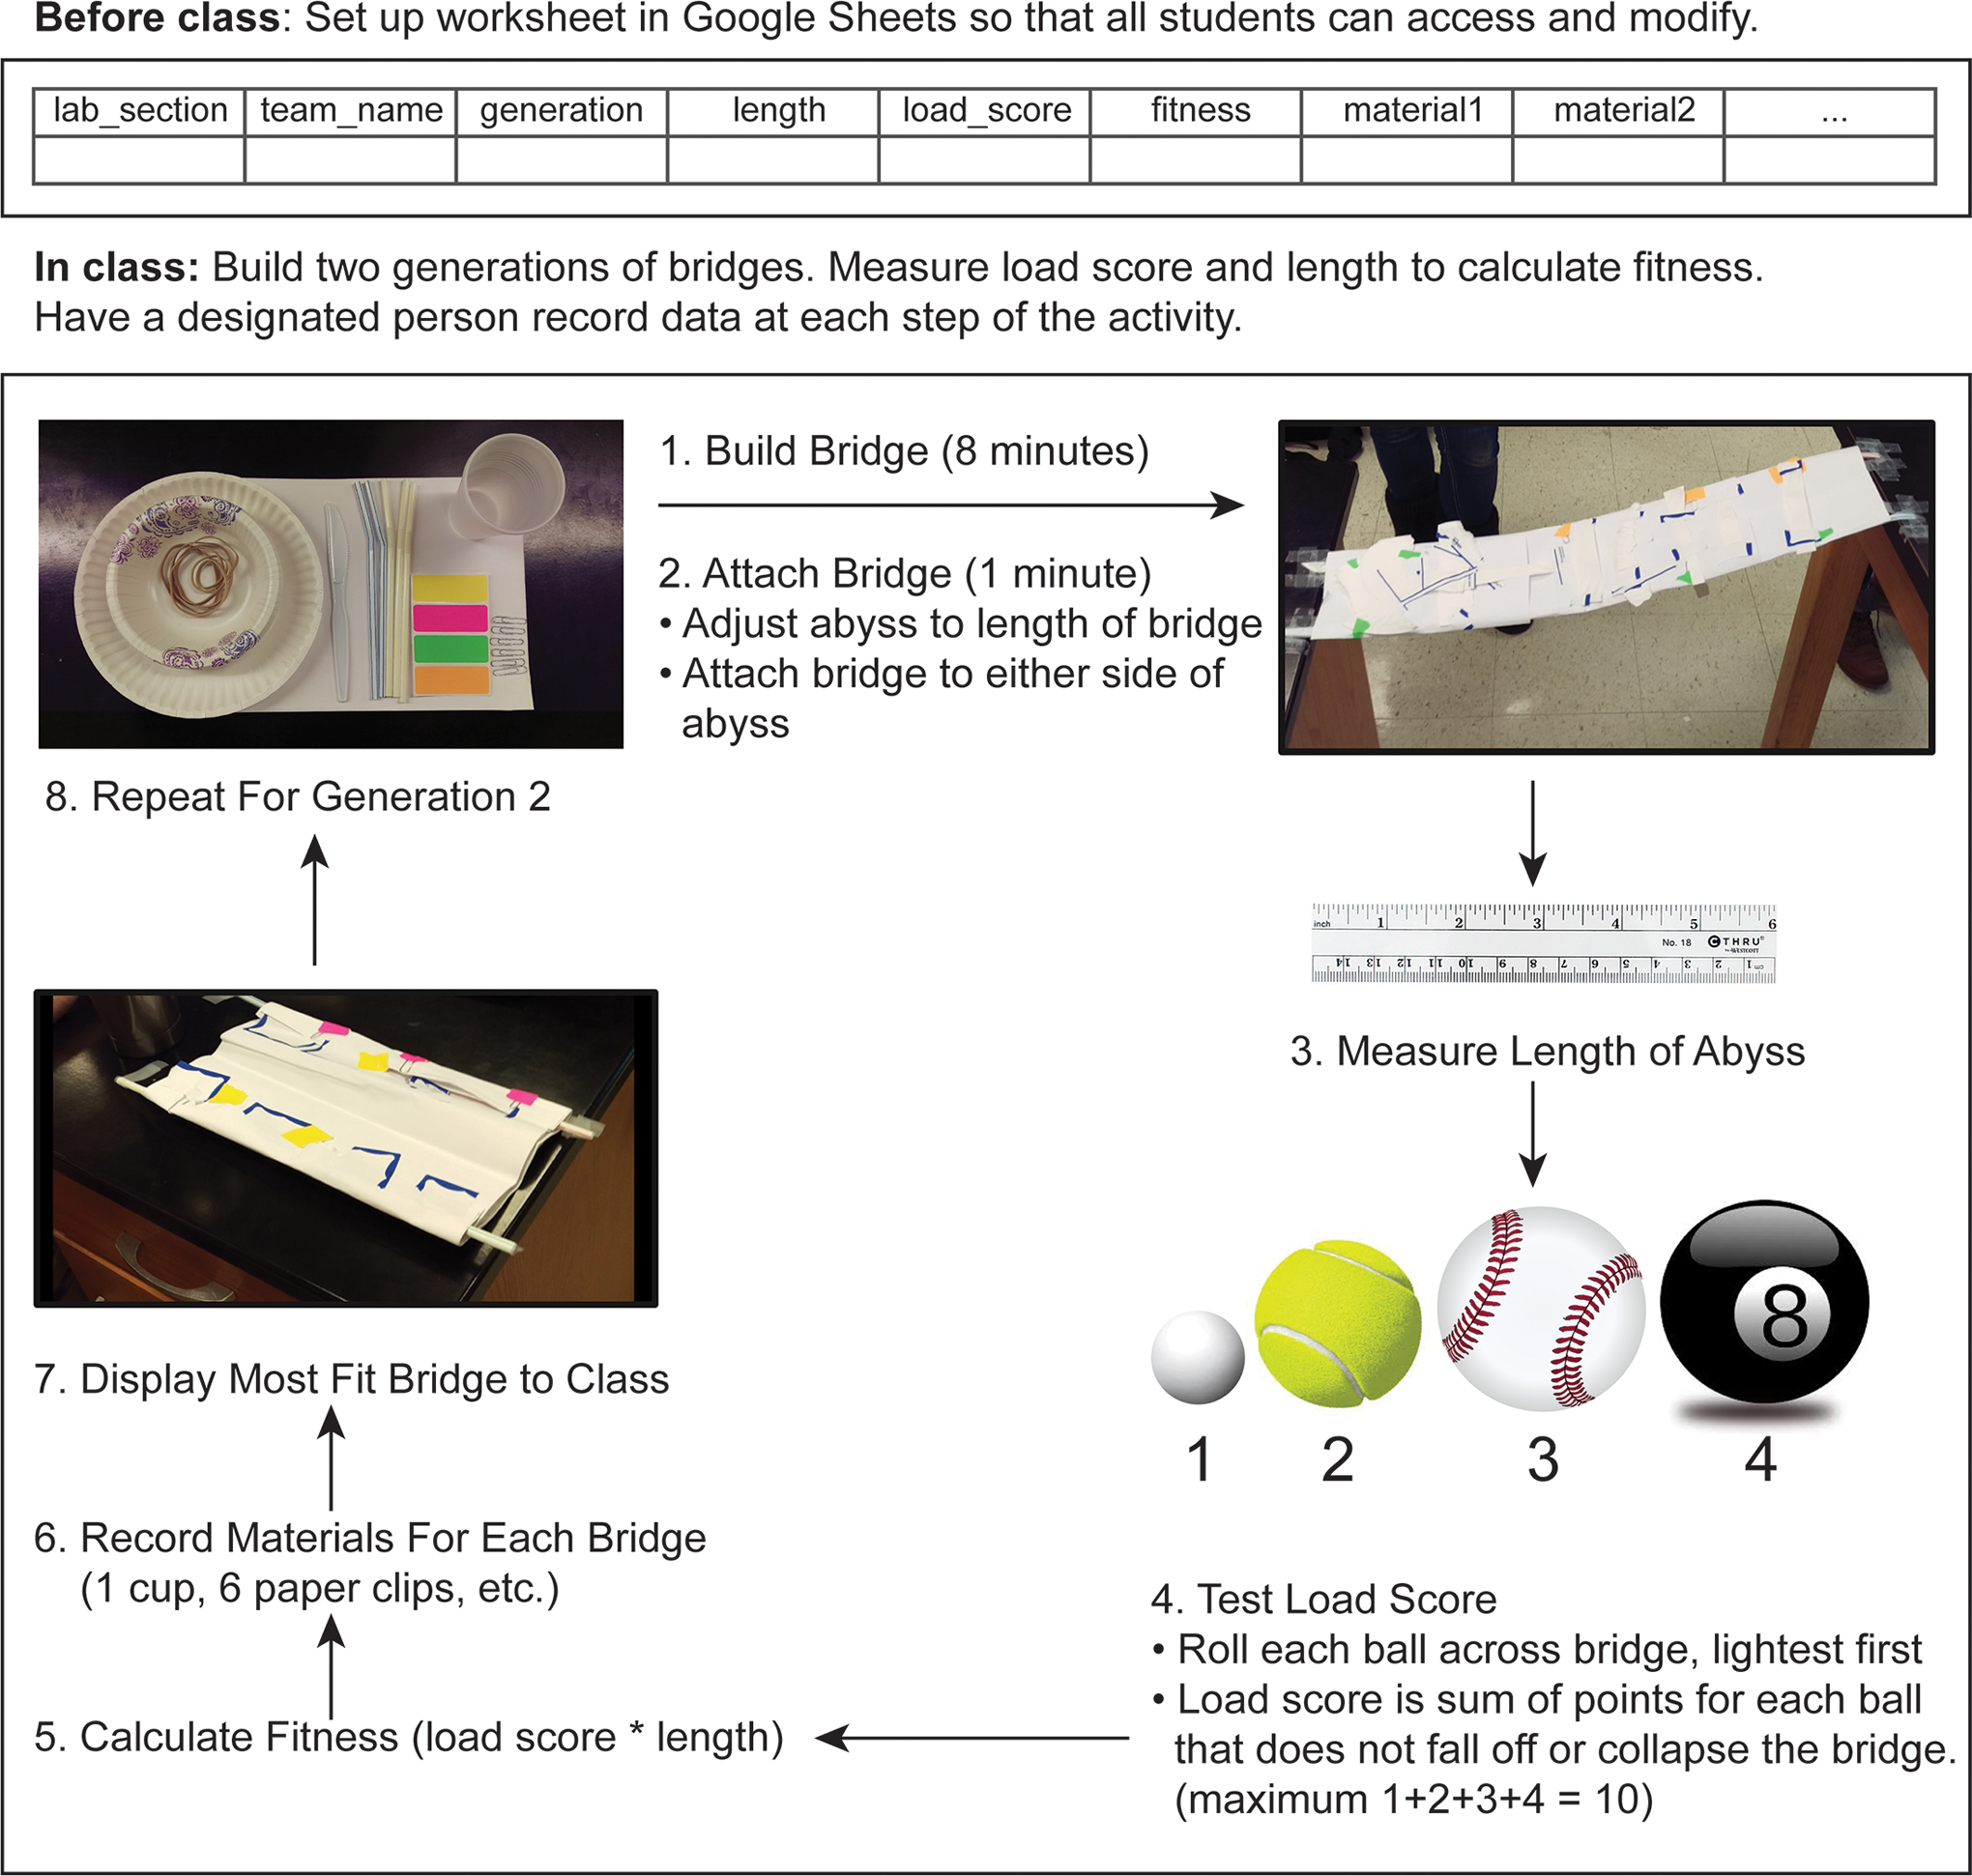
Schematic of Building Bridges activity, detailing how students will construct and test two generations of bridges to gather data for evaluating evolutionary predictions. Instructors may wish to use this as an instructional handout for their classes.
Evaluating evolutionary predictions
To complete the lab assignment, students followed prompts in a Word document (Appendix 2, available online at ) and visualized data in R, a widely used, free and open source computational environment (R Core Development Team, 2017). Early in this upper division course, we provided students with annotated R code, which they modified and executed. With this toolkit of R scripts, we gradually built their capacity to write code and perform their own visualizations and analyses through the semester. We include a student template and an instructor key (worked example) for the Building Bridges lab code (Appendix 3, available online at ). We also provide code that illustrates key R functions using a different available data set, so students familiar with R could apply these functions to their Building Bridges data (Appendix 3). This code uses R Markdown language, which lets students embed code, plain text answers, and generated figures into a single html file. Students must have the appropriate R packages installed and be familiar with R Markdown before this lab. However, instructors can use R without R Markdown or use other analysis and visualization environments (e.g., EXCEL). Students submitted their html file to a learning management system (i.e., Canvas) within a week after the activity.
Using R, students manipulated and plotted the data to make evidence-based claims. Because the activity occurred early in the semester, students primarily used visual (rather than statistical) interpretation of the data to make evidence-based claims about evolution. Students compared the range of fitness values among bridges using scatterplots and boxplots of bridge fitness versus generation for assessing whether fitness varied among individuals (Prediction 1) and whether adaptation occurred (Prediction 2). Trade-offs (Prediction 3) were assessed from a scatter plot of bridge length versus load score for all bridges. Optionally, students fit a simple linear model to the data to explore the strength of this relationship.
Students estimated bridge complexity using the Shannon index:
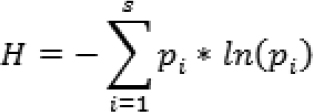
where s is the number of different structural materials, and pi is the frequency of each type of material used in the bridge. For example, if a total of 31 items are used and six were paper clips, paper clips would contribute
![]()
to the sum above. Students compared H values between the two generations to determine whether complexity increased over time (Prediction 4). Last, students compared results across lab sections (“populations”) and discussed the repeatability (or contingency) of evolution.
Student assessment of learning gains
After students submitted the assignment, they completed an online quiz (Table 2) following the format of the Student Assessment of Learning Gains (SALG; Seymour, Wiese, Hunter, & Daffinrud, 2000). This quiz was not timed and was auto-graded for completion (5 points; a typical lab report is 15–20 points) to incentivize participation. This approach was implemented as part of regular emphasis on metacognition in the course. We used Question 1 to omit responses from students that were not present for the in-lab activity. Responses from Questions 2–8 were transformed from Likert-scale to numeric responses and summarized with medians (Sullivan & Artino, 2013) and simple bar plots. We divided free responses (Question 9) into comments about what students liked and what students would change about the lab. Qualitative analysis of free responses revealed several emergent themes, and student responses were coded into four apparent categories (e.g., “Collaboration”) and summarized.
| Table 2. Student Assessment of Learning Gains questionnaire prompt and questions to stimulate student reflection on learning gains and seek feedback about the lab activity. | ||||||||||||||||||||
|---|---|---|---|---|---|---|---|---|---|---|---|---|---|---|---|---|---|---|---|---|
|
Analysis of full data set, across populations
We also analyzed the combined data from all nine lab sections (“populations”) to search for overarching patterns. This section is not part of the student assignment but may be useful to instructors for follow-up discussion about the activity. To visualize variation in fitness among individuals (Prediction 1), and how fitness changed across generations in each population (Prediction 2), we created scatterplots showing mean fitness and ancestor–descendant relationships. To further test whether bridge fitness increased across generations and varied among populations, and the trend across generations varied among populations, we fit a linear model of fitness with generation, population, and their interaction as predictors in a full model. Assumptions of normality were confirmed by visual inspection of quantile–quantile plots of residuals from the best model (model selection described next).
To test for trade-offs between bridge length and load score (Prediction 3), we used a cumulative link model (Christensen, 2015). We used this regression approach to model load score as an ordinal response (because the scores for supporting balls of different weights are ordered but arbitrary) and to determine whether load scores varied among populations. For simplicity, we did not include an interaction term here (i.e., to evaluate whether relationships between length and load score vary among populations). Using the “clm” function in the ordinal package in R (Christensen, 2015), we fit the full model:
clm(load score ~ length + population, data = bridges, threshold = “flexible”, link = “loglog”)
where load score is a factor and threshold and link terms were selected as options that maximized model log likelihood.
To test Prediction 4, that bridge structural complexity increases across generations, we ran a linear model of Shannon’s diversity values (transformed to meet model assumptions using “boxcox” in the R package MASS [Venables & Ripley, 2002], lambda = 2) with generation, population, and their interaction as predictors. The interaction term was included to test whether any trend in bridge complexity across generations was consistent across populations.
For each model described above, we used Akaike Information Criteria (AIC) to determine which predictors were important. Models with AIC scores within 2 of each other (ΔAIC < = 2) were considered statistically indistinguishable. We did not statistically account for nonindependence (i.e., two bridges constructed by the same team) in the above analyses, but the qualitative conclusions rest on broad comparisons (e.g., the change in mean fitness across generations) and should not be unduly influenced by team identity.
Results
Evaluating evolutionary predictions
Teams constructed two generations of bridges that varied in phenotype and fitness (FIGURE 2) and visualized the data to test the four predictions (sample results from one lab section shown in FIGURE 3). The example illustrates variation in fitness (FIGURE 3A), an increase in median bridge fitness across generations (FIGURE 3B), no clear trade-off between bridge length and load score (FIGURE 3C), and a slight increase in bridge structural complexity across generations (FIGURE 3D).
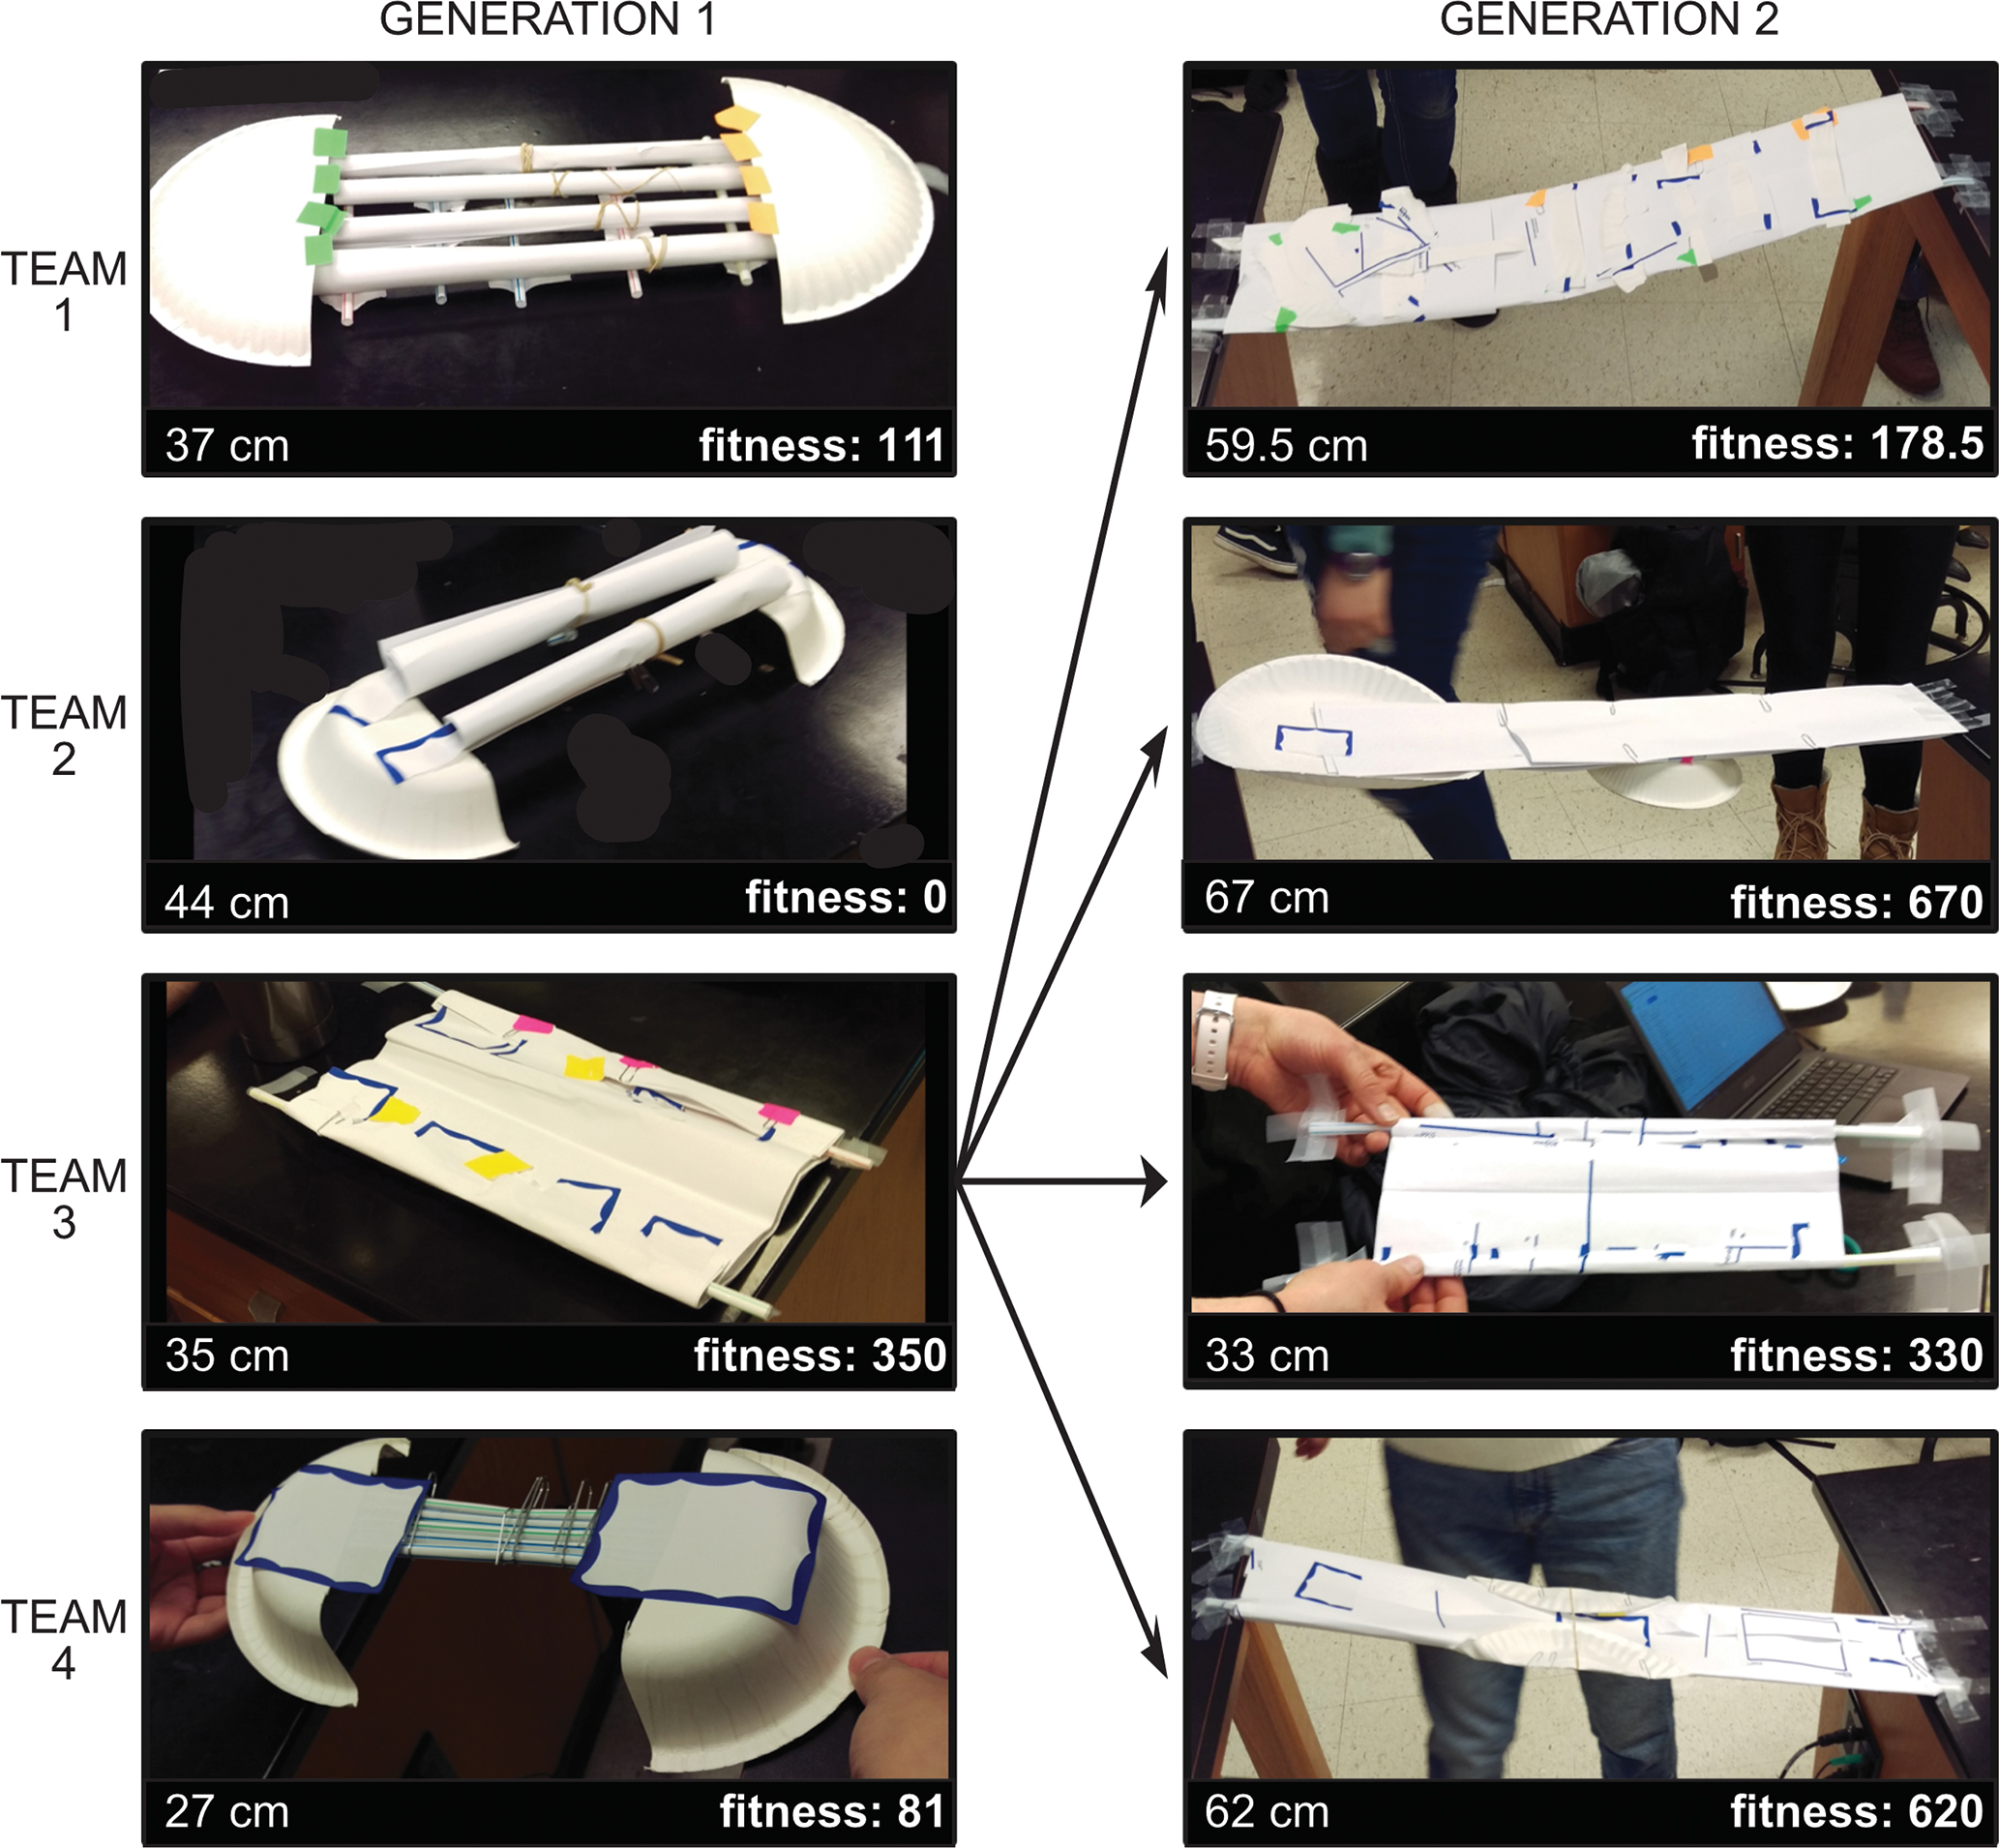
Example bridges from one lab section. Bridges are constructed from basic stationery supplies (see main text) and competed. The Generation 1 bridge with the highest fitness (length * load bearing score) is the template for Generation 2 bridges.
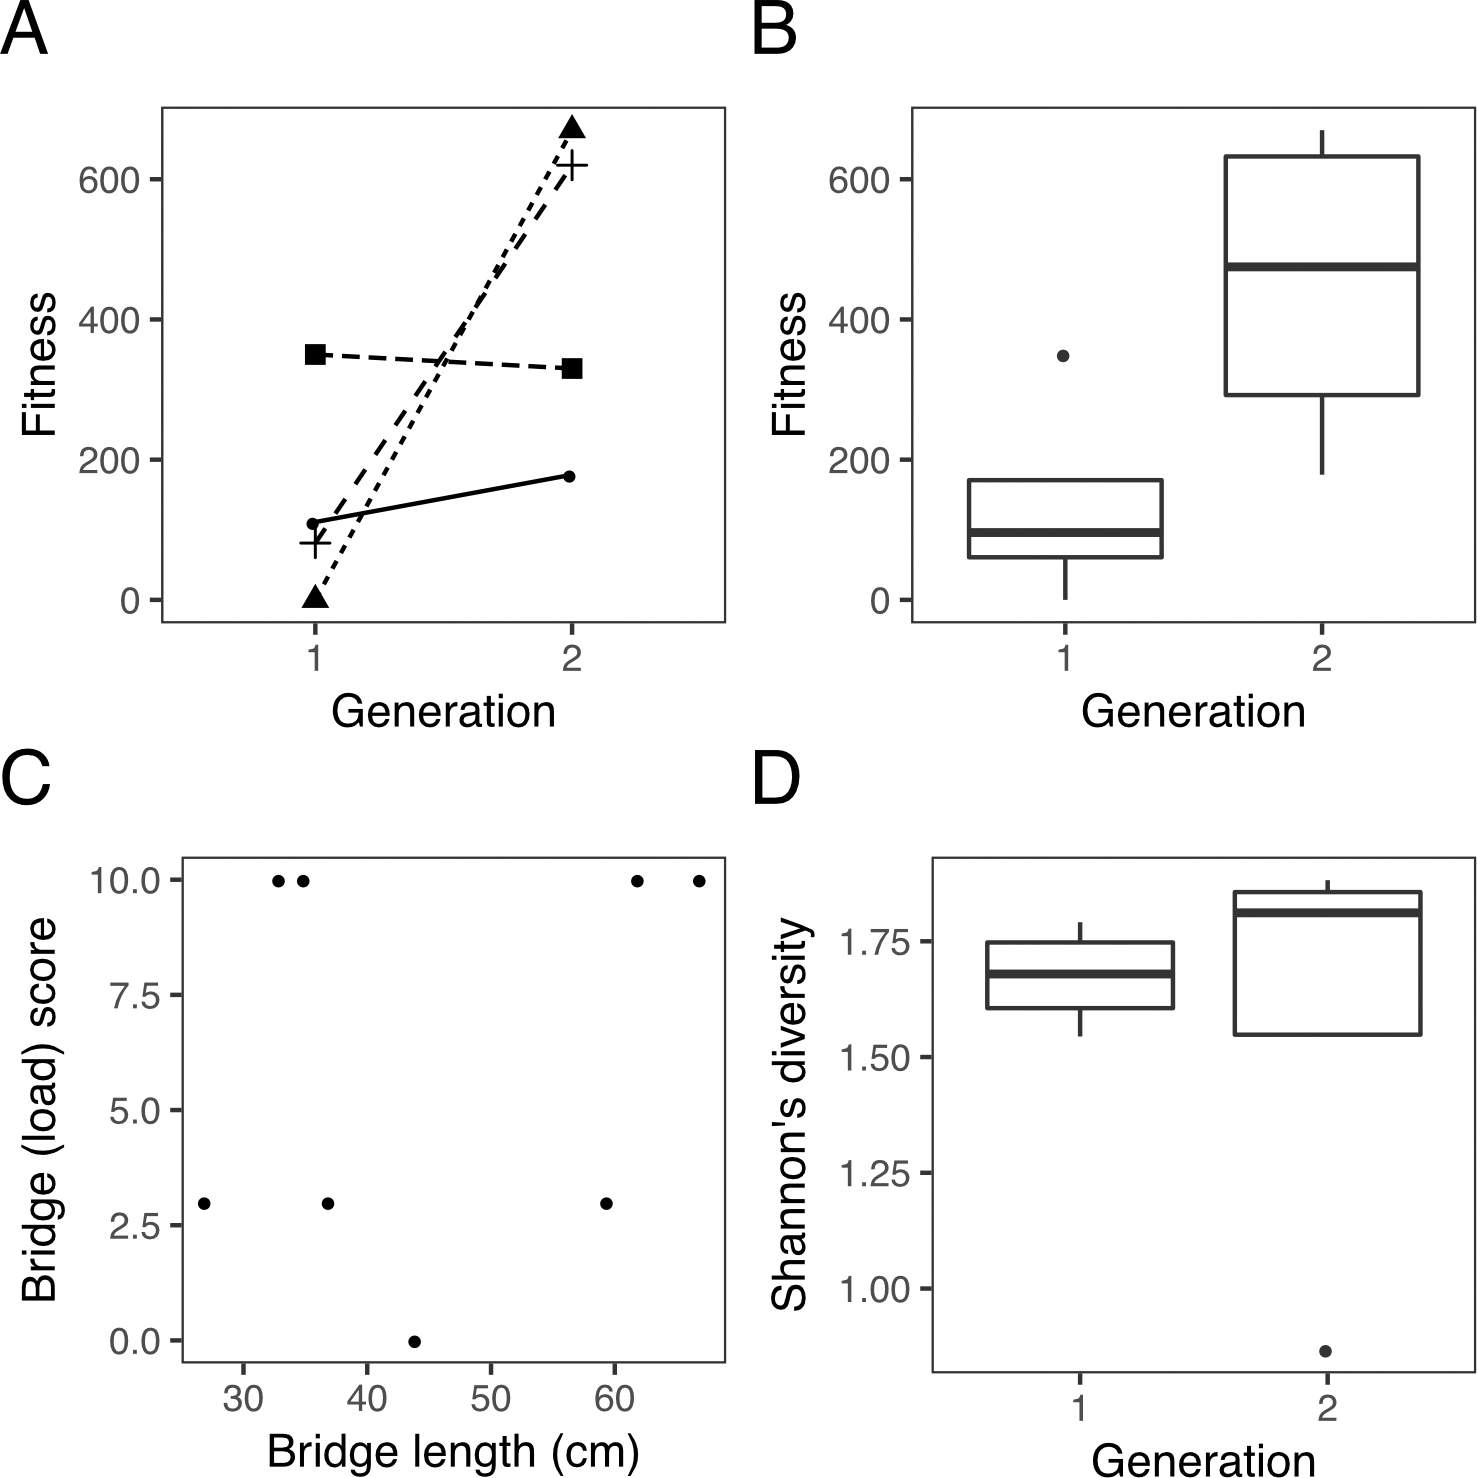
Sample plots from one lab section that illustrate the figures students create in the assignment. (A) Variation in bridge fitness among teams and across generations. Line types represent different teams, so students can track the performance of each team. (B) Boxplot of bridge fitness across generations, to assess whether median fitness increased across generations. (C) Bridge load score vs. length, to look for trade-offs among these traits. (D) Shannon diversity across generations, so students can see if structural complexity or economy was favored by “selection.”
Student Assessment of Learning Gains
SALG responses confirmed Building Bridges increased community through collaborative work and improved student understanding of evolution. Students reported “good gain” (median = 4 on a 5-point scale) in their sense of community, teamwork ability, and understanding predictions regarding mean fitness, trade-offs, structural complexity, and repeatability of evolution (FIGURE 4). They reported “moderate gain” in understanding elements of evolution (e.g., adaptation, median = 3). The vast majority of responses indicated students benefited from this activity.
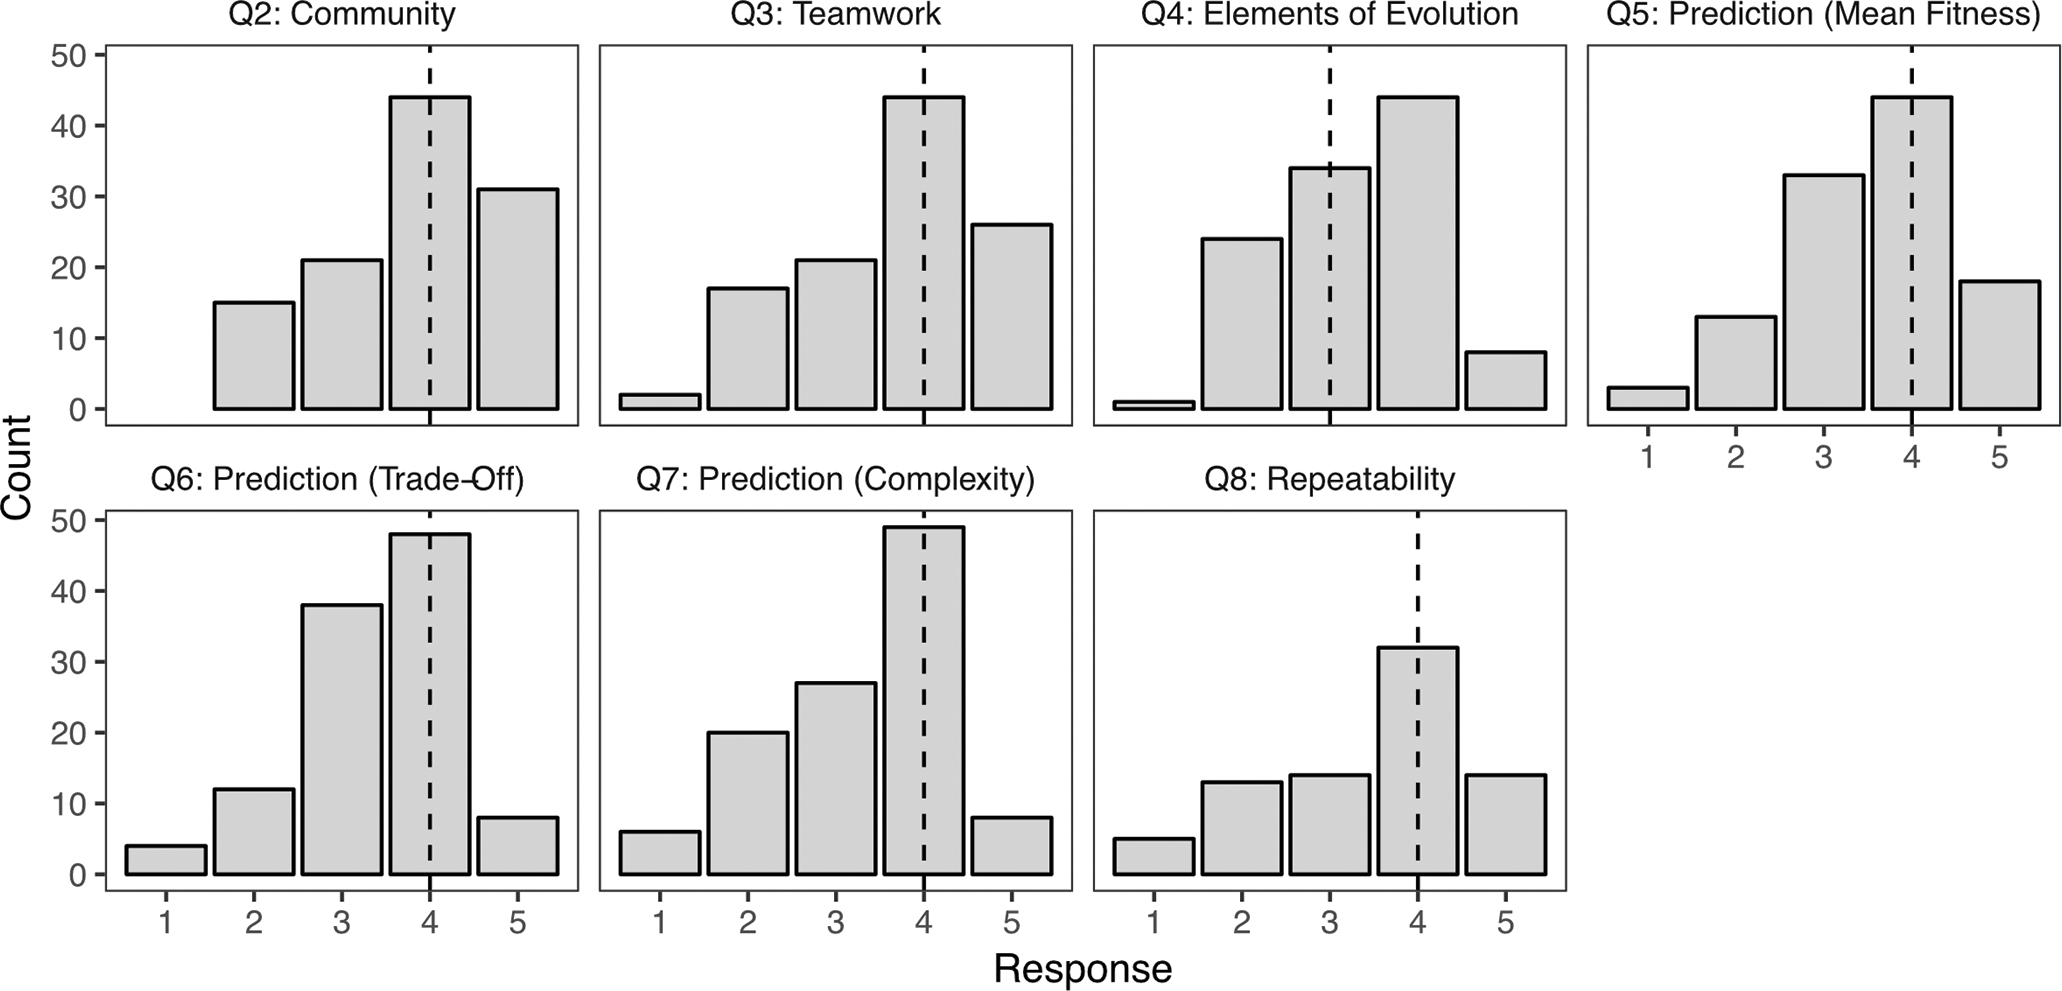
Student Assessment of Learning Gains quiz responses. Panels refer to survey questions from Table 2. Responses are: no gain (1), a little gain (2), moderate gain (3), good gain (4), great gain (5), or NA (not shown). Dashed lines are median response scores, across all lab sections (n = 117 of 136 enrolled students completed the survey).
Analysis of students’ free responses identified three main categories of things students valued about the activity: collaboration, computation, and learning about evolution (Table 3, FIGURE 5). Responses that mentioned “fun,” “teamwork,” “community,” or “hands-on” were classified as Collaboration. Comments that mentioned gains from working with R, or that the provided code was clear or helpful, were grouped as Computation. The Evolution Info category included mention of participating in an evolutionary process, observing trends either consistent or inconsistent with their evolutionary predictions, or using a model or nonbiological metaphor for evolution. An Other category included comments that did not fall within the three other topics.
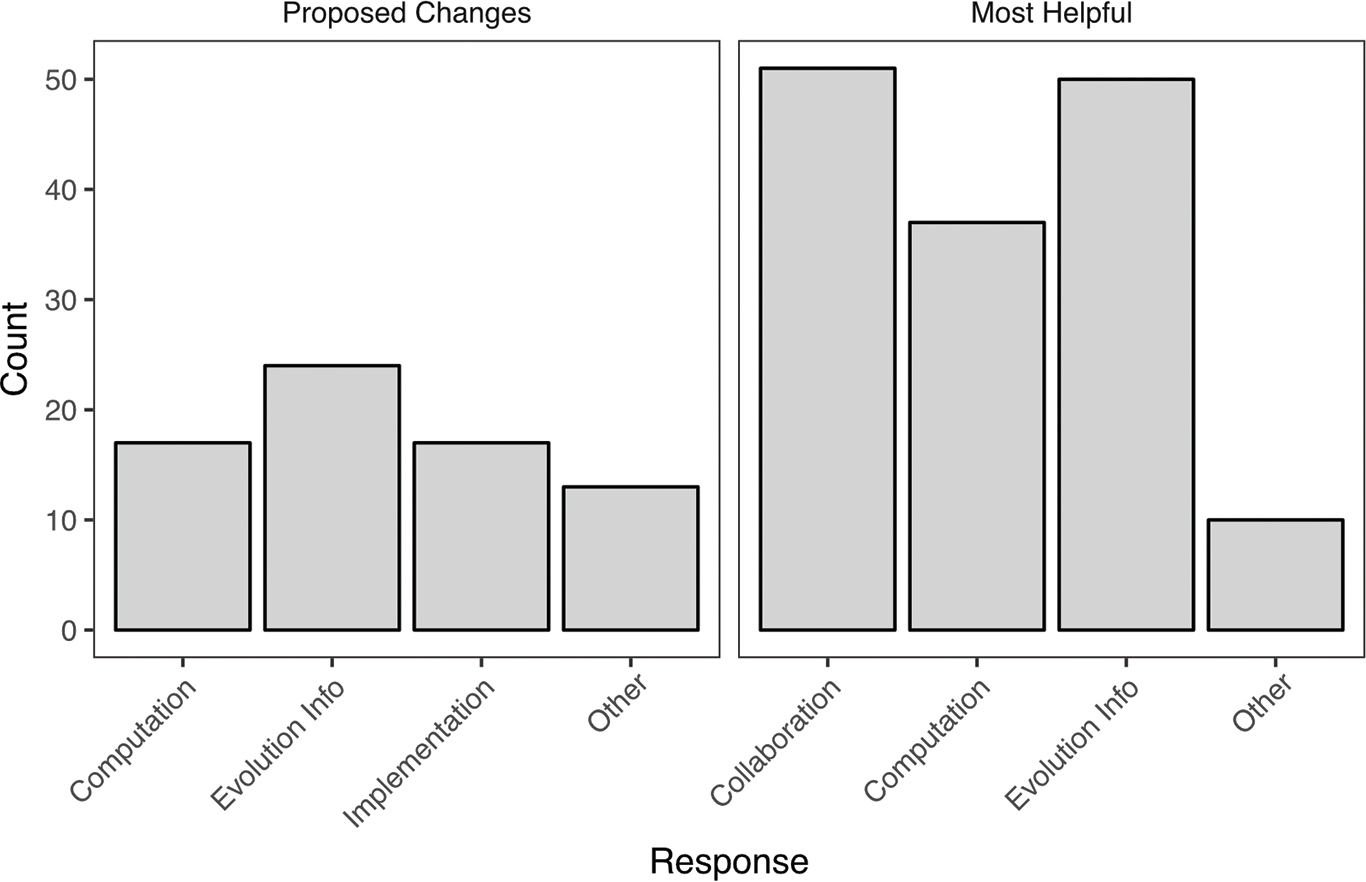
Free responses from Student Assessment of Learning Gains questionnaire (as in Table 2). Students were prompted to propose improvements and consider what elements of the Building Bridges lab were most helpful. Students could offer multiple comments, and each response is tallied here as an independent response (range was 0–5 comments for either proposed changes or helpful comments). See Table 3 for example comments.
| Table 3. Example free-response student answers from the Student Assessment of Learning Gains questionnaire on what they found most helpful or would change about the Building Bridges activity. Responses are used with student permission. | |||||||||||||||||
|---|---|---|---|---|---|---|---|---|---|---|---|---|---|---|---|---|---|
|
Students were also asked to suggest improvements (Table 3, FIGURE 5). We have already made many of these changes in the materials provided, and we make further recommendations in the Discussion section. Several students found working with R challenging or requested more lab time to work with code or more explanations of the code (Computation). Under Evolution Info, we included student suggestions like adding further background on Shannon’s index to the introduction (we have added this) and making links between evolutionary concepts and the activity more explicit. In addition, not all teams confirmed all predictions; some students cited this discrepancy as helpful (making them think critically about evolution and the activity), whereas others thought they would learn better if the data were consistent with each prediction. This reflects a pedagogical choice, and we recommend instructors consider whether they wish to emphasize that experimental evidence does not always support a given hypothesis or allow students to discover and explore this themselves. Last, students made helpful suggestions (e.g., have smaller teams—some had six members) that we term Implementation.
Analysis of full data set, across populations
Plotting ancestor–descendant relationships across generations for bridges in each lab section revealed tremendous variation among second-generation bridges relative to the ancestral (first generation) model (FIGURE 6). In nature, new mutations may lead to novel high-performing forms, such that certain offspring have greater fitness than even their ancestor. In Building Bridges, if a team discovered a new way to arrange materials that increased bridge structural integrity, after their first generation trial, we would see this pattern of increased fitness. The variation in bridge fitness in the second generation was, however, mainly due to second-generation bridges with lower fitness than the ancestor. In nature, this pattern may arise from deleterious mutations or trait combinations that break up beneficial interactions among genes (reduced positive epistasis).
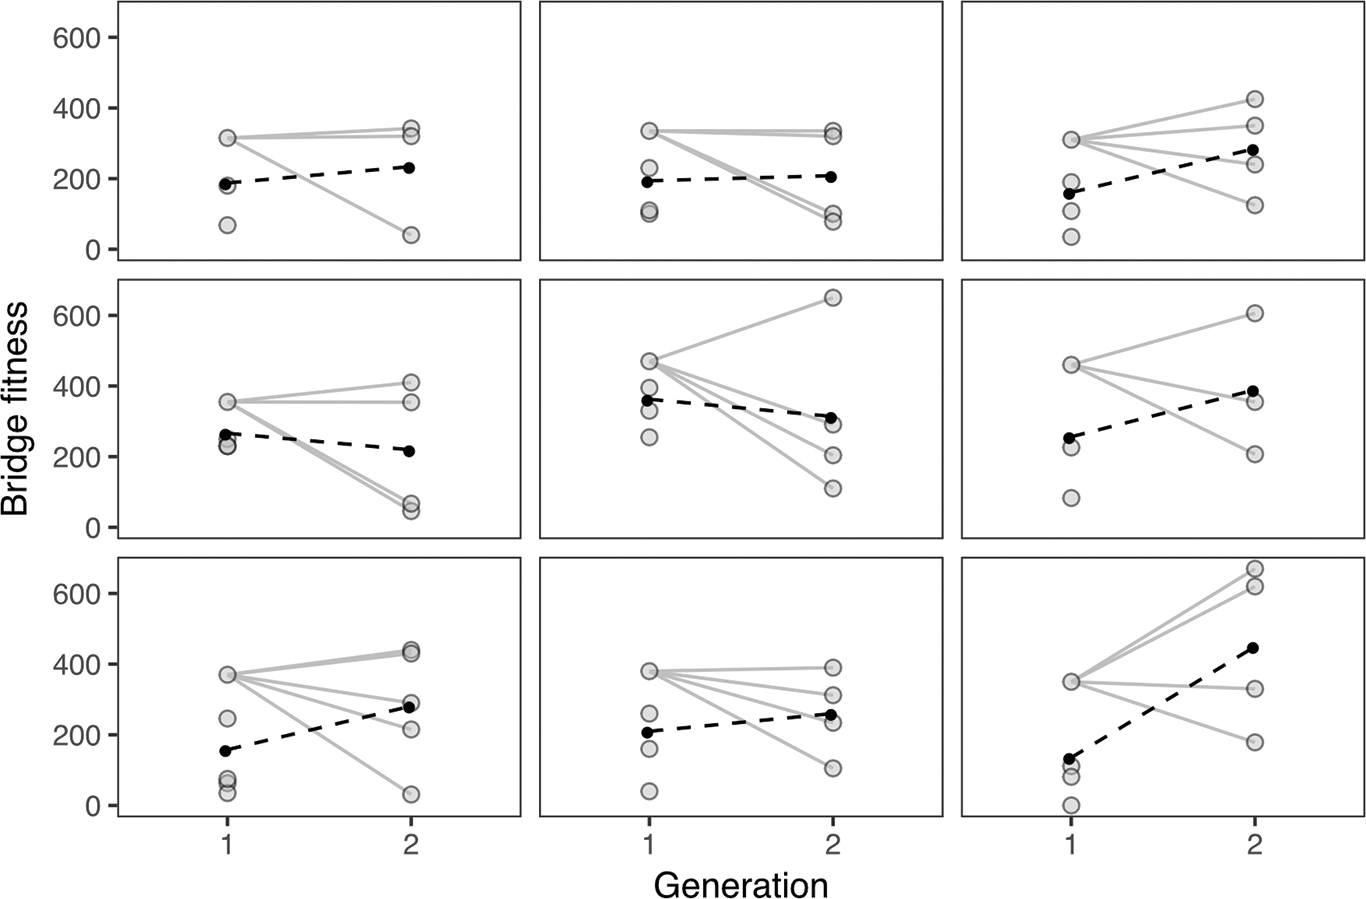
The fitness of bridges across generations for nine lab sections. Each section can be considered a separate and independent population. The solid lines join the most-fit ancestor from Generation 1 with the descendent bridges in Generation 2. The filled circles are means and the dashed lines connect the two means.
Visually, in seven of the nine populations, mean bridge fitness increased over generations (FIGURE 6). A model including generation as a predictor of bridge fitness (FIGURE 7) was better than the null model (with only intercept, ΔAIC = 2.60) and was also better than a model including both generation and population (ΔAIC = 9.07) and one including both predictors and their interaction (ΔAIC = 14.90). Hence, this analysis suggests populations behaved similarly, and variation in fitness was largely across generations.
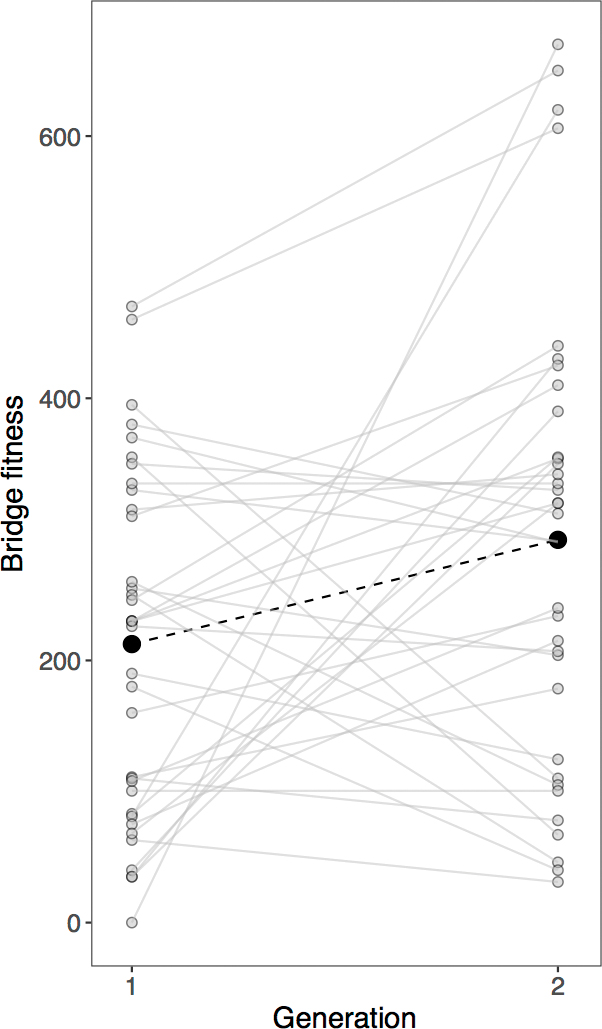
Bridge fitness across generations, from all class data. Black circles connected by a dashed line show the statistically significant increase in mean bridge fitness across generations (see main text).
We observed a trade-off between length and load score using a cumulative link model (β =—0.020, 95% CI—0.036 to—0.0054); population was not an important determinant of bridge load score. A model of Shannon’s diversity (structural complexity) including only generation as a predictor had the lowest AIC score, but this was not statistically better than models including both generation and population (ΔAIC = 1.89), or a null model (ΔAIC = 1.71). A model including both predictors and their interaction was significantly worse (ΔAIC = 14.08).
Overall, we found variation in fitness among individuals (bridges), an increase in mean fitness from one generation to the next (adaptation), and a functional trade-off between bridge length and load-bearing properties. There was not evidence of an increase in mean complexity, nor did we detect differences among populations in bridge mean fitness or length.
Discussion
Students reported gains in their sense of community, quantitative skills, and evolution content knowledge from Building Bridges. This activity emulated the process of evolution by natural selection: there was variation among individuals in the population (different bridge designs) linked to variation in fitness (the capacity of the bridge to carry objects across an abyss), and the characteristics were heritable (the second-generation bridge design is based on the best bridge from the first generation). Although the activity was tailored to communicate evolutionary concepts, the basic framework and principles of the activity may apply to other STEM disciplines and learning aims. For example, an engineering class could examine the structural components that contributed to bridge load score and then redesign bridges based on first outcomes.
Across lab sections (“populations”), we observed that bridge fitness increased from one generation to the next, consistent with an inference of adaptation, and we found a weak trade-off between bridge length and load score, consistent with the idea that maximizing fitness through one trait comes at the expense of fitness through another trait. There was no discernible change in bridge complexity. Results from different populations were qualitatively but not statistically different (e.g., FIGURE 6). Thus, even though bridge design often differed substantially among populations, these differences did not translate into corresponding effects on fitness. For their assignments, students perform only qualitative comparisons among few lab sections—they may report similar trends but differences in the perceived magnitude of variation or strength of relationships, highlighting that starting conditions (trait variation and trade-offs) and evolution (changes over generations) may not be identical across populations.
Suggestions for implementation and extension
Student free responses to the SALG questionnaire suggested ways to improve the lab. Some requested additional time for construction or for working through the R code, so we do not recommend this activity for classes shorter than 1 hour 50 minutes. Using interactive quizzes in lab (or online beforehand) might minimize time needed for the introduction by ensuring students come to lab prepared. Because one of our goals was for students to recognize the value of collaboration for success, we recommend limiting construction time to 8 minutes, which is already longer than other Instant Challenges developed to promote team building and collaboration (Students for a Creative Iowa, 2017). Students also suggested more prominently displaying the “winning” bridge from Generation 1 (e.g., on a raised table), so all teams could model their second bridge off of it. In longer lab periods, instructors may also be able to implement students’ idea of running a third generation of bridges, which they thought could clarify trends across generations. By continuing the Building Bridges activity over many more generations, instructors could emulate a famous, long-term experimental evolution study (Lenski et al., 1991). Instructors could, for example, use the winning bridge from the second generation of one lab section as a starting template for the next lab section, and so on. However, we generally advocate spending any additional time discussing the results in the context of evolution, rather than building more bridges. Last, a few students suggested clarifying the R code: we have done this here by providing two formats to suit students’ prior experience with R (Appendix 3, available at ).
This Building Bridges activity could be further modified to make it more impactful. First, it could include inductive reasoning (Prince & Felder, 2006). Rather than providing predictions for the students to test, instructors could introduce the activity and the idea of bridges as organisms with traits and different fitness values. Then, ideas about how to parse the data and how evolution works could “evolve” in the class through observation, prediction, and discussion. This approach may be more suitable for longer lab periods. Second, long-term learning gains could be maximized by revisiting the central predictions and findings from the Building Bridges activity in lecture or subsequent labs, spaced through the semester (Kang, 2016). Comparing results across lab sections in lecture could reinforce the idea that even though the “rules of the game” may be the same across populations, evolutionary outcomes (or trade-offs, heritability, bridge designs, or fitness) may differ. Last, instructors could reinforce concepts from Building Bridges by linking the variation in fitness seen in the second generation back to ideas of beneficial and deleterious mutations. To clarify that natural selection is not working toward a universal “goal” or ideal form, but rather varies with environment, instructors could ask students to consider when selection would favor a different optimum. Alternatively, they could have students build their second generation bridges as before, but then impose a different selective regime, simulating environmental change unforeseen by the previous generation (e.g., a paper clip “drought” now means that designs minimizing paper clip use are favored). This idea that selection varies across environments could be driven home by discussing real examples, like selection on lizard horn length varying with predation pressure, or selection on finch beak size dependent on drought and seed availability (Boag & Grant, 1981; Young & Brodie, 2004). Seeing explicit comparisons between their results and evolution in real biological populations could help students cement their understanding of evolution.
Collaboration and community
We emphasized creativity, cooperation, effective communication, and developing interpersonal relationships through hands-on construction. Each group’s bridge design was unique, and bridge construction necessitated cooperation and effective communication. Most student free responses identified aspects of collaboration and community building as strengths of the activity, and self-assessment of learning gains revealed increases in collaboration and community. Thus, the activity fostered a positive learning community, which aligns with the purpose of bringing students together in the same place for engaging in the social enterprise of education.
With this Building Bridges lab, we proposed an activity developed with STEM teaching best practices in mind: building community; engaging students in hands-on, experiential, collaborative learning; linking teaching concepts to everyday life; working on quantitative skills like data visualization and interpretation; and promoting metacognition. Responses to the SALG questionnaire indicated the activity was successful in meeting these multidimensional learning gains. We end with a quote:
I liked using everyone’s strengths to solve the puzzle—i.e., … creating a model and using it to understand evolution on a deeper level. It allowed me to practice team-working skills and go outside of my comfort zone by talking and working with other people and using creativity. (anonymous student response)
Acknowledgments
The University of Colorado Boulder and the ASSETT program at the University of Colorado supported this work. We thank instructors and teaching assistants that have run this lab in previous years.
Kelly A. Carscadden (kacarscadden@gmail.com), Molly T. McDermott, Sheela P. Turbek, and Silas B. Tittes are doctoral students and Andrew P. Martin is a professor, all in the Department of Ecology and Evolutionary Biology at the University of Colorado Boulder.
Biology Evolution Research Teaching Strategies Postsecondary