
TWO-YEAR COMMUNITY
Community College Students Rise to the Challenge
Meeting the Time Demands of Highly Structured Courses
Journal of College Science Teaching—May/June 2020 (Volume 49, Issue 5)
By Scott Freeman, Pamela Pape-Lindstrom, Anne Casper, and Sarah Eddy
High-structure course designs have reduced achievement gaps for low-income and underrepresented minority students at research universities. But do community college students have time to do the preclass preparation required for intensive active learning, given their work and family commitments? We asked introductory majors biology students at two community colleges, a regional comprehensive university, and a research university (R1) in two states to report the number of hours spent on various activities each week. Our sample included one low-structure and one high-structure course at each institution type. Community college students reported higher levels of nonacademic time commitments than students at the regional comprehensives and the R1s. The community college students in both states reported spending the same amount of time studying for their biology course as the students at the R1s; in one state, the community college students were spending more time studying than the students at the comprehensive university. Our data show that community college students commit as much time to biology as other students, demonstrating that they can readily meet the time demands of a high-structure course.
Since their founding in 1901, community colleges have focused on a single mission: improving access to higher education. Thanks to their open admission policies and affordability, they have been spectacularly successful. Community colleges currently enroll about 41% of all undergraduates in the United States, and relative to bachelor’s degree granting institutions, educate a disproportionately large percentage of students from demographic groups that are under-represented in STEM fields (American Association of Community Colleges, 2017; Community College Research Center, 2017; Ginder et al., 2017; Labov, 2012; Snyder et al., 2016).
Unfortunately, community college students are also subject to disproportionately high rates of attrition, with over 70% leaving school without completing an associate’s degree or bachelor’s degree, compared to 40% of students at four-year schools failing to complete a bachelor’s degree (Juskiewicz, 2015; National Center for Education Statistics, 2017). Students who are returning to school or who are of nontraditional age are at particularly high risk of withdrawing, as they are often working to support themselves and juggling family responsibilities (Johnson et al., 2016). Other barriers to success for community college students may include speaking English as a second language and entering with poor academic preparation (Johnson et al., 2016).
Under-preparation can also be an issue that places students at risk of failure in comprehensive universities. Many of these four-year, master’s degree granting institutions, which are also called regional public universities, are similar to community colleges in following nearly open-enrollment policies.
Retention in college is important not only for students themselves, but for the United States as a nation. For example, Carnevale and Rose (2011) estimated that the U.S. economy would benefit from an additional 15 million graduates with four-year degrees by 2025, and the President’s Council of Advisors on Science and Technology (2012) called for an additional one million graduates with STEM degrees per year. Meeting these goals will be difficult or impossible unless success rates at community colleges increase sharply.
For STEM-interested community college students of all ages and backgrounds, one of the most important predictors for retention is level of performance in their initial STEM courses (Bahr et al., 2017; Chen & Soldner, 2013). Poor grades trigger withdrawals. What innovations can help students overcome barriers to success and achieve the types of grades that encourage persistence in STEM?
Recent work has shown that for all undergraduates in STEM, increased active learning during class time—defined as problem-solving and discussions that engage students, often in groups, in the process of learning—can improve course performance (Freeman et al., 2014; Freeman et al., 2011). In addition, achievement gaps that impact underrepresented students can be reduced or eliminated by high-structure, flipped, or inverted courses—where intensive active learning is combined with required preclass preparation activities and postclass exam preparation exercises (Eddy & Hogan, 2014; Haak et al., 2011). Based on these data, policy makers and opinion leaders advocate for high-structure course designs that emphasize active learning during class as a solution to historical problems with retention in the STEM disciplines (President’s Council of Advisors on Science and Technology, 2012; Wieman, 2014).
There may be a catch, however. Most research on innovative course designs has taken place at research-intensive universities, not at community colleges (Schinske et al., 2017). This observation is important because the efficacy of high-structure courses depends in part on assigning more work outside of class than is typical of traditional lecture courses (Ruiz-Gallardo et al., 2011). Thus, it is legitimate to question whether course designs with high demands on “the other 23 hours” can be successful at community colleges, given that students at those institution types may be more time-constrained than students at research-intensive institutions. For example, Clement (2016) found that almost 55% of community college students surveyed had a job, and that 35% were working more than 16 hours per week.
If community college students actually do have more out-of-school commitments than peers at other institution types, do they have enough study time available to meet the demands of high-structure courses? If the answers to these two questions are yes and no, then a healthcare analogy is relevant: A beneficial drug, developed by education specialists at research-intensive universities, may be priced out of reach in terms of the time commitment required for “treatment” for the student populations who would benefit the most.
Although study time was the most salient question motivating this study, we also wanted to explore how many hours per week students at different institution types spent working or volunteering in a field related to their course of study. This query was inspired by the literature on the positive impacts of undergraduate research experiences and internships in promoting retention in STEM (e.g., Fakayode et al., 2014). Do students at community colleges have time to participate in noncourse activities that can play an important role in professional development?
To address these questions, we designed an online survey to assess how students partition their time among competing activities. We administered the instrument in introductory biology courses for majors across three institution types in each of two states in the United States. We studied these three institution types because they host the clear majority of undergraduates in the United States; we studied two states to furnish a replicate and contrast quarter versus semester systems. Our goal was to generate data that will help instructors and administrators understand the trade-offs that students at different institution types are making in response to course demands.
How are students spending their time?
We surveyed students at two community colleges in the state of Washington and two community colleges in the state of Michigan, along with the comprehensive university and the research-intensive university in each state where most of the community college students in the sample intended to transfer (Table 1). At all eight institutions, we administered the survey in the first course in the introductory sequence required of biology majors. The four schools in the state of Washington were on the quarter system, while the four schools in the state of Michigan were on the semester system. Students completed the survey in approximately the seventh week of a 10-week quarter or the seventh week or later of a 14-week semester. In every case, we were careful to schedule the survey during a week when no high-stakes exams were scheduled in the focal course.
| Table 1. Courses sampled. | ||||||||||||||||||||||||||||||||||||||||||||||||||||||||||||||||||||||
|---|---|---|---|---|---|---|---|---|---|---|---|---|---|---|---|---|---|---|---|---|---|---|---|---|---|---|---|---|---|---|---|---|---|---|---|---|---|---|---|---|---|---|---|---|---|---|---|---|---|---|---|---|---|---|---|---|---|---|---|---|---|---|---|---|---|---|---|---|---|---|
|
To determine how highly structured each course in the sample was, three of the authors independently inspected syllabi from each course and determined whether instructors tasked students with completing assignments outside of class rarely, weekly, or daily. The three researchers then met to reach the consensus determination reported in Table 1. Following Freeman et al., 2011 and Haak et al., 2011, we interpreted courses with daily assignments as highly structured. Although the nature of these assignments differed among instructors, information from the instructors involved confirmed that all attempted to design assignments that directed students’ time and attention to content that had challenged their students in the past.
Because no standardized instrument exists to gather data on student time allocation, we designed survey questions with consultation from experts in survey design and time-management studies (see Acknowledgments). The full survey is available in Appendix 1; in essence, we asked students to estimate how many hours they spent on various activities in a typical week that did not include a biology exam. After stating how many credits and courses they were taking in the current term, students answered a series of questions asking about the time they allocated to each activity. Each question appeared as a separate page in the survey; responses (including 0) were required for each. We did not ask students to estimate how many hours they spent eating, in personal care, or in scheduled classes, laboratories, or discussion sections. Most instructors gave a small number of course points to motivate student participation, and all students were told that their instructors would not see their data during the term in question.
In at least some contexts, self-report data need to be interpreted cautiously. Self-report data on time allocation can be subject to inter-individual variation due to different definitions or interpretations of tasks (Burke et al., 2000). In addition, over- or under-estimation of time spent can occur in low- and high-time-investment individuals, respectively (Collopy, 1996). Our use of self-report data is based on the premise that students we surveyed at different institutions are comparable in terms of the frequency and direction of these biases.
We analyzed all data in R (R Core Team, 2013). Preliminary analyses indicated that there were regional differences in the amount of time spent studying for the focal biology course. We attributed this to the differences in the quarter versus the semester system, as students in the quarter system take fewer courses at the same time than students in the semester system—typically three versus four. Accordingly, we added state as a predictor variable to control for this difference in subsequent analyses.
Does time committed to nonacademic obligations vary by institution type?
To test the hypothesis that there is a significant difference in nonacademic obligations for students from different institution types, we modeled time reported on nonacademic activities—those related to a student’s intended field as well as those not related to a student’s intended field. These obligations included work for pay and volunteering inside or outside of the student’s intended field, commuting, family care, and participating in sports or student organizations, all reported in units of half hours. The survey questions provided in Appendix 1 provide a full listing of the possible activities that students considered (Table 2). Students report a median of 20 hours spent on these activities a week, with a range from zero hours to 143 hours. This variable shows a high skew, so it was log10 transformed for this analysis. In addition, given the large range in student responses, some of the reported times (such as 143 hours per week) seemed unreliable. Lacking an objective and reliable way to identify and delete unreliable estimates of time, we used Tukey’s outer fence (three times the interquartile range) to identify outliers.
| Table 2. How the undergraduates surveyed report spending their time, by institution type. | ||||||||||||||||||||||||||||||||||||||||||||||||||||||||||||||||||||||||
|---|---|---|---|---|---|---|---|---|---|---|---|---|---|---|---|---|---|---|---|---|---|---|---|---|---|---|---|---|---|---|---|---|---|---|---|---|---|---|---|---|---|---|---|---|---|---|---|---|---|---|---|---|---|---|---|---|---|---|---|---|---|---|---|---|---|---|---|---|---|---|---|---|
|
In addition to testing the explanatory importance of institution type, our model accounted for the differences in the two regions and included a random effect for instructor. We used this random effect, symbolized as 1|Instructor, to control for course- or section- or term-specific variation that might have affected time allocation—such as course difficulty or instructor enthusiasm. The following linear mixed model was fit by reduced maximum likelihood, using t-tests based on the Satterthwaite approximation: Log10(nonacademic obligation hours) ~Institution type × Region + 1|Instructor.
Based on initial model testing of the higher-order term, we found no support for the inclusion of interaction term between institution type and region (χ-value = 4.3, p = 0.16). Thus, the final model only includes these factors as main effects. This final model was then run with and without outliers to test the sensitivity of the results to extreme reported values.
The linear mixed-effect model that we fit to answer this question is summarized in Table 3; it indicates that institution type is the only significant predictor of time devoted to nonacademic obligations. Community college students devoted almost twice as much time to noncourse-related commitments as students at the research-intensive universities (Figure 1; p = 0.001). There was no difference in this aspect of time allocation between students at comprehensive universities and R1s. Running the model on the dataset without outliers did not impact these results.
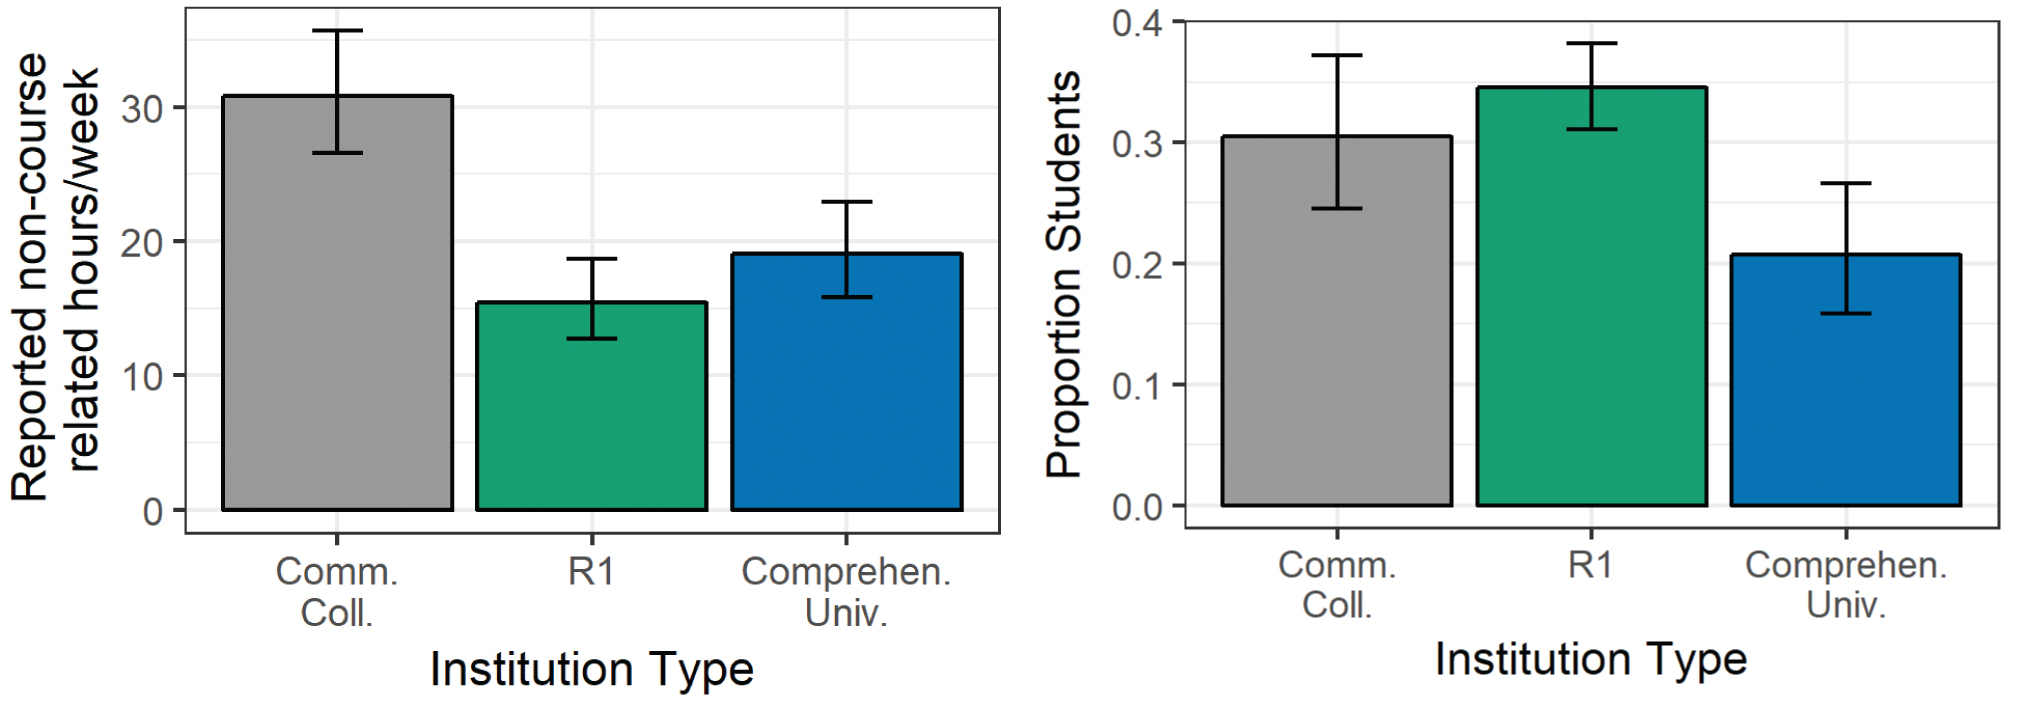
Community college students have more noncourse-related time commitments (a) and an equal chance of working or volunteering in their field (b).
The outcome for (a) is the time that community college (n = 267), comprehensive university (n = 417), and research university (n = 955) students spent commuting, working outside their field, caring for family members, doing chores, or participating in sports or clubs. Bars are model-predicted outcomes back-transformed to the raw scale of half hours, then divided by two to represent hours. These estimates are averaged across states; vertical lines indicate 95% confidence intervals. For (b) the outcome is the likelihood that students at a particular institution are engaging in work related to their future career.
| Table 3. Nonacademic obligations vary by institution type. | ||||||||||||||||||||
|---|---|---|---|---|---|---|---|---|---|---|---|---|---|---|---|---|---|---|---|---|
|
Does study time for a biology course vary by institution type, nonacademic obligation hours, and/or frequency of outside-of-class assignments?
If community college students have more nonacademic obligations than students at other types of institutions, do they have less time to study biology than their peers at regional comprehensive universities and R1s? If so, it would suggest that they may not be able to meet the time demands of a high-structure course—one that includes daily required assignments outside of class. To address this issue, we constructed a model to predict study time that accounted for the differences in geographic region, time spent on nonacademic obligations, and included a random effect for instructor. In this model, the degree of structure was indexed by the number of outside-of-class assignments, binned as rare, weekly, or daily (Table 1); institution type was binned as community college, comprehensive university, or research-intensive university.
In this sample, students reported a median of eight hours a week studying for their introductory biology class in a typical nonexam week, but reports ranged from 0 to 70 hours. This variable shows a high skew, so it was log10 transformed for this analysis. Like obligation time, we suspected that the time estimates on the tail of this distribution were unreliable.
Our initial full model was: Biology study hours ~ Institution type + Nonacademic obligations + Outside-of-class assignments + State + Institution type × Region + Nonacademic obligations × Outside-of-class assignments + 1|Instructor.
Initial examination of the higher-order terms suggested that “Nonacademic obligations × outside of class assignments” was not necessary to retain in the model (χ-value = 2.05, p = 0.35), but that “Institution × Region” should be retained (χ-value = 18.4, p = 0.001). This final model was run with and without outliers to test the sensitivity of the results to extreme reported values.
Table 4 summarizes the result for the fixed effects in the final model. The frequency of out-of-class assignments did not significantly influence the reported hours students studied per week (Figure 2a). In addition, there were no significant differences between institution type and region in reported time studying. However, model selection suggested the retention of the interaction term. This suggests that the relationship between institution type and reported study time varied by region (Figure 2b). The results also show that nonacademic obligations do not explain a significant amount of the observed variation in study time. Although the estimate did not change substantially when we ran the model without outliers, hours spent in nonacademic obligations approached significance (β = 0.0004 ± 0.0002, p = 0.055).
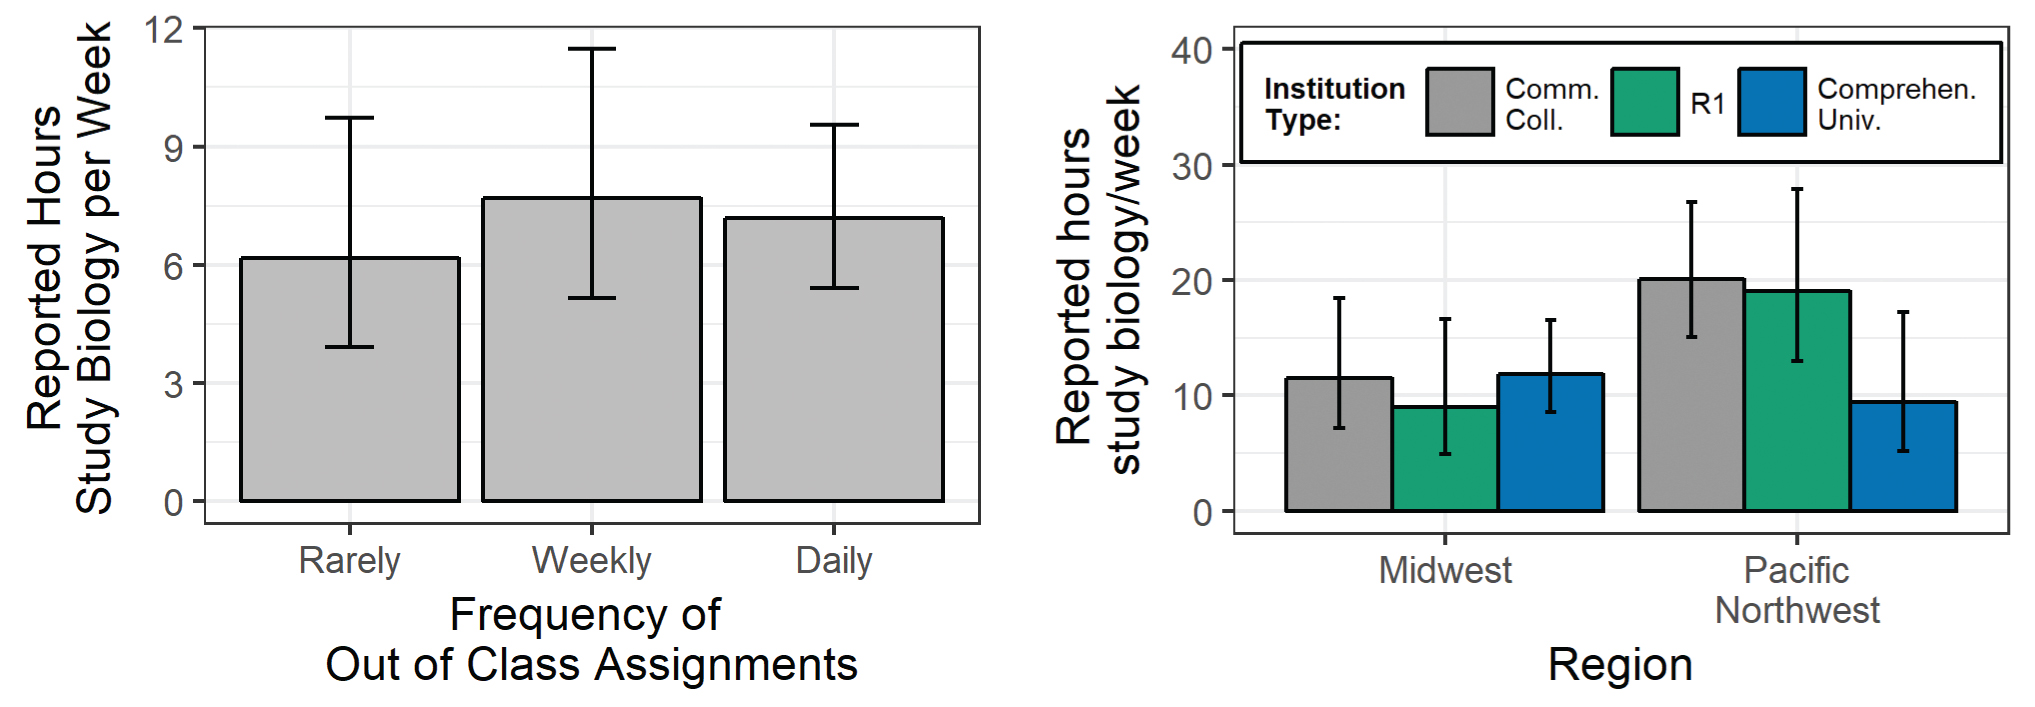
Frequency of out-of-class assignments (a) and institution type (b) do not impact time students perceive studying for their biology course per week.
Bars indicate the model-predicted relationships between out-of-class work or institution type and studying biology, backtransformed into the raw scale of hours. These predictions are for a student with an average number of nonacademic obligation hours in the average class in the sample at each institution type in each state; vertical lines represent the 95% confidence interval for each estimate.
| Table 4. Predicting how much time students spend studying biology: model results. | ||||||||||||||||||||||||||||||||||||||||
|---|---|---|---|---|---|---|---|---|---|---|---|---|---|---|---|---|---|---|---|---|---|---|---|---|---|---|---|---|---|---|---|---|---|---|---|---|---|---|---|---|
|
Does the amount of time that students commit to nonacademic work in their field (paid or volunteer) vary by institution type?
There is an important difference between time that students spend working for pay or volunteering in nonacademic activities that are relevant to their intended career path, and nonstudying hours that are spent on paid or volunteer activities unrelated to their intended field. We designated the former as In-Field and the latter as Not-In-Field. The majority of students (69%) did not report any hours in this category. For those that did report hours, the median was six hours with a range of 0.5 hrs to 57 hours and a large negative skew.
We chose to model this outcome variable as a binary (1 = In-Field experience and 0 = Not-In-Field experience) rather than hours reported, because so few students actually had these hours. Thus, we used a general linear mixed effect model with a binomial distribution to model the data. The initial model was: In-Field ~Institution Type + Region + (Institution type × Region) + 1|Instructor.
An initial test for the inclusion of higher-order terms found no support for retaining the interaction term (χ-value = 1.65, p = 0.44).
The results reported in Table 5 indicate that students at comprehensive universities spend significantly less time on experiences in their chosen field—via either work for pay or volunteering—than students at either community colleges or research-intensive universities.
| Predicting whether students engage in nonacademic work—paid or volunteer—in their field. | ||||||||||||||||||||
|---|---|---|---|---|---|---|---|---|---|---|---|---|---|---|---|---|---|---|---|---|
|
Community college students are motivated
Our data indicate that students at community colleges spend just as much time studying introductory biology as students at R1s, and the same or more time studying than students at comprehensive universities. This result holds even though community college students are partitioning other aspects of their time differently than students at comprehensive universities and R1s. Consistent with earlier work, the community college students we surveyed have many more hours of nonacademic commitments than students at comprehensive universities and R1s, but spend more of this nonacademic time pursuing paid or volunteer opportunities related to their field of study than students at comprehensives, though less than students at R1s.
Taken together, these results suggest that community college students are putting a high priority on their academics, and making different trade-offs than their peers at four-year institutions in terms of time allocation. Compared to students at comprehensive universities and R1s, the data in Table 2 suggest that community college students devote more time to family and job responsibilities and less time to student groups and clubs or recreational activities. Being more likely to attend school part-time may also play a role in this trade-off, with reduced credits possibly allowing part-time community college students to invest large amounts of time in each course they take while fulfilling their work and family obligations—at the cost of extending their time to degree.
Our data support the hypothesis that increased course structure—in the form of additional outside-of-class assignments—could be a viable way to promote the success of students at community colleges and comprehensive universities (Pape-Lindstrom et al., 2018). In the state of Washington, community college students studied the same amount as students at an R1 with a high-structure course design. In the Michigan sample, we found no difference in average time spent studying for classes that had rare, weekly, or daily assignments outside of class.
Further analyses are warranted, however, on the relationship between course structure, study time, and study techniques. The question is important because study time in and of itself is not a strong predictor of achievement in many courses (Clement, 2016; DesJardins et al., 2010; Nandagopol & Ericsson, 2012; Plant et al., 2005). Instead of simply needing more time, underprepared students may need more structure—especially in introductory courses (Bahr et al., 2017)—to acquire study skills that are effective at the college level (Clement, 2016; Masui et al., 2014). For example, Nandgopol and Ericsson (2012) found that variation in aspects of self-regulated learning—such as seeking assistance from peers and pursuing additional information—not only explained 46% of observed variation in final grades, but was the key factor distinguishing low-, medium-, and high-performing students. As these authors pointed out, self-regulated learning is closely related to deliberate practice. Deliberate practice, in turn, is hypothesized to be a causative agent in course designs that employ high structure and find disproportionate benefits for underprepared students (Eddy & Hogan, 2014; Haak et al., 2011). Taken together, these observations suggest that how students study may be just as or more important than how much they study.
In conclusion, our data point to two significant take-home messages:
- Instructors at two-year schools should not assume that their students are unable to spend time completing required work outside of class. Although our data on this point are limited, they suggest that “added” assignments do not necessarily impact a student’s overall time budget. One hypothesis to explain these data is that the added assignments help students make more efficient use of their available study time. To test this idea, it would be beneficial to study whether the assignments are better aligned with assessments than study strategies that students pursue on their own. For example, well-designed assignments may direct students to tasks that promote higher-order thinking skills versus traditional study strategies, such as rereading notes, that focus on lower-order skills.
- Community college students are serious about their academic commitments, and will respond to the best in evidence-based instruction (Labov, 2012; Schinske et al., 2017). Even though they are juggling family and work commitments, community college students are extending their time to degree when they opt for part-time status and are reducing recreational time and commitments to student clubs or groups so that they can study. Although their time management practices are different from peers at other types of institutions, our results suggest that they are willing to invest an equivalent amount of time to their educational goals. Significantly, 28% of individuals entering medical schools in the United States in 2012 had at least some community college experience during their preparation (Talamantes et al., 2014). This observation, along with the data reported here, suggest that the dedication and career potential of community college students deserves more recognition. As institutions, community colleges deserve more educational resources than they receive under current funding models (Kahlenberg, 2019)—especially if the United States is to achieve the ambitious goals for STEM degree attainment set forth by policymakers.
Acknowledgements
We thank Catharine H. Beyer and the consulting group at the University of Washington Office of Educational Assessment for help designing the time-on-task survey and Allen Farrand, Diane Forson, Jenny McFarland, Carrie Schwarz, Linda Brandt, David Wooten, Matthew Chapman, and Gyorgyi Csankovszki for help with data collection. Comments from the University of Washington Biology Education Research Group improved the manuscript. This work was supported in part by NSF DUE grant 1118890, and was conducted with oversight from the Institutional Review Boards of Everett Community College, Eastern Michigan University UHSRC #131110M, Western Washington University # EX14-015, the Institutional Research Office at Henry Ford Community College, and the Office of the Vice President for Instruction at Washtenaw Community College.
Scott Freeman (srf991@uw.edu) is lecturer emeritus in the Department of Biology at the University of Washington in Seattle, Washington. Pamela Pape-Lindstrom is dean of science, technology, engineering, and mathematics at Harford Community College in Bel Air, Maryland. Anne Casper is professor in the Department of Biology at Eastern Michigan University in Ypsilanti, Michigan. Sarah Eddy is assistant professor in biology and the STEM Transformation Institute at Florida International University in Miami, Florida.
Appendix 1
Time on task survey.
This survey asks you to report the average number of hours you spend per week on various activities during the current term.
- Assume that you do not have a biology exam this week.
- If you spend no time on one of the activities listed, please enter a zero into the space provided.
- There are 168 hours in a week, but your total number of hours should be less than that, because we are not asking you about personal care (getting dressed, etc.).
- How many courses are you currently enrolled in this academic term?
- How many credits are you taking this term?
In the following series of questions, please respond to the following prompt:
On average, over the course of this current academic term, how many hours a week have you spent on the following:
1. Studying outside class for this biology course (including time spent studying alone, with others, and at study or tutoring centers):
2. Studying outside class for all your other courses (including time spent studying alone, with others, and at study or tutoring centers):
3. Getting to and from campus:
4. Of the hours you spend working for pay, how many of these hours are spent at a job directly related to your intended career (i.e., a job where you are developing skills or knowledge you may use as a professional in your intended field):
5. Volunteering (average hours per week):
6. Of the hours you spend volunteering, how many of these hours are spent at a job directly related to your intended career (i.e., a volunteer position where you are developing skills or knowledge you may use as a professional in your intended field):
7. Taking care of your children (e.g., preparing meals, taking them to daycare, playing with them, etc.):
8. Taking care of elderly family members (e.g., preparing meals, helping them with daily chores, etc.):
9. Taking care of siblings, helping family members navigate organizations or demands, or assisting family members in other ways:
10. Household maintenance and chores (e.g., laundry, cleaning, lawn mowing, etc.):
11. Practicing, training, and engaging in other activities directly related to your performance in a sport if you are a scholarship-supported college athlete:
12. Practicing, training, and engaging in other activities directly related to your performance in a sport if you are a nonscholarship-supported college athlete:
13. Exercising, including intramural sport activities (but not related to college-level athletics):
14. Participating in clubs or other college-sponsored activities:
15. Watching TV, playing video games, socializing, or staying in touch with friends:
16. Sleeping:
17. Are there any activities that take a significant amount of your time that are not listed in this survey? Please describe these activities and how much time on average you spend on them a week.
Thank you so much! Your answers will help us design courses that will help students perform better, given the other demands on their time.
Preservice Science Education Teacher Preparation Postsecondary