
Research & Teaching
Student Active Learning Anxieties Differ by Preferred Seating Location in Introductory Biology Classes
Journal of College Science Teaching—November/December 2021 (Volume 51, Issue 2)
By Elisabeth E. Schussler, Brianna Reynolds, Benjamin J. England, and Jennifer R. Brigati
As undergraduates’ academic distress continues to rise, it is important to consider factors related to classroom anxiety. This study investigated how student anxiety varied by preferred seating location and whether the reasons for their preferred seating location were related to these anxiety levels. In seven introductory biology classes at a large public university, we assessed student anxiety levels about different classroom practices. Students also reported where they preferred to sit in a lecture class and explained why they preferred that location. We coded and created themes from these explanations without knowing the anxiety levels or student seating preferences. We compared anxiety levels among nine preferred seating locations via ANOVA: front-right, front-middle, front-left, middle-right, middle-middle, middle-left, back-right, back-middle, back-left. The back-left had higher group work anxiety. The middle-right had higher anxiety for volunteering, cold calling, and clicker use. The back-left and front-middle had higher test and clicker anxiety. Student explanations for seating preference indicated a balance between wanting to be engaged in the class yet wanting to avoid others and feel comfortable; these reasons did not directly align with anxiety differences, however. We suggest teachers consider how anxiety varies spatially in their classroom to inform their active learning implementation practices.
Anxiety is increasingly reported among college students in the United States (Bledsoe & Baskin, 2014; Kitzrow, 2003). An analysis of student anxiety based on data in a mental health database found that distress related to academic concerns was responsible for most of the variation in student anxiety levels (Jones et al., 2018). Several investigators have explored student anxiety in undergraduate classrooms, specifically finding that active learning practices are related to differential levels of anxiety among students in the same class (Broeckelman-Post et al., 2016; Cooper et al., 2018; England et al., 2017). One unexplored question is the extent to which different types of active learning anxiety vary by where students sit in a biology classroom.
Spatial variation in anxiety has been found in both classroom and nonclassroom settings. A study by Rebeta et al. (1993) measured state anxiety (transitory anxiety felt in a particular context), trait anxiety (tendency to experience anxiety based on personality), and test anxiety (anxiety in response to assessment) and found that trait anxiety increased significantly in students who sat in the back versus the first row. Luck (2006) found that patients with anxiety or depression had different left-versus-right seating preferences than patients without these conditions. These studies provide evidence that students with different anxiety levels may sit in different locations, but they do not indicate why this may be.
Losonczy-Marshall and Marshall (2013) identified five factors underlying student seating preference: performance, social, asocial, noticeability, and environment. Of the five, performance (conditions that students believed help them succeed) and noticeability (being seen by others and the professor) were identified most often by students who preferred the first row, asocial (not wanting to stand out or sit near others) was identified most often by students who preferred the back of the room, and environment (proximity to doors, windows, or vents) was identified most often by students who preferred to sit in the center. Although this suggests personality plays a role in seating preference, a nonclassroom study by Karev (2000) found that cinema attendees preferred seats on the right and suggested that handedness and emotional processing plays a role. Harms et al. (2015), however, found that students preferred seats on the left side of the classroom and attributed it to left- versus right-brain processing of information.
Regardless of what drives student preferences about where to sit, seating location has been linked to student performance and engagement in the classroom. Benedict and Hoag (2010) found that students who preferred to sit in the back of the classroom were more likely to receive a D or F in the course, even when those students did not sit in the back. Conversely, students who preferred the front had a higher probability of receiving an A in the course. Marshall and Losonczy-Marshall (2010) studied 1,829 students over 15 years and found higher grades and attendance for students seated in the middle of classrooms. Parker et al. (2011) studied 55 students to determine whether class participation differences were due to student personality (linked to seat choice) or the influence of location on student behavior. One group was assigned seats in the classroom for the entire semester, while the second group was assigned a new seat each day. At the end of the study, students assigned to the front row all semester participated more than those assigned to the back, but there were no differences between the front and the back for those who moved each day. Their results suggested that participation frequency is an interaction between personality preference and influence of seating location.
Given the research on anxiety, seating location preferences, engagement, and performance, we investigated whether students’ preferred seating location in introductory biology related to active learning anxiety levels and why students preferred certain seating locations. The results will add to the literature about how student anxiety may interact with active learning, even at smaller spatial scales within a classroom. The study was guided by two research questions:
- Are there differences in active learning anxiety levels among students who prefer to sit in one of nine different classroom locations?
- Does the reason for seating location preference relate to potential anxiety differences?
Methods
Context of the study
This study was conducted in spring 2017 at a large, public research university in the south. In week 4 of the class, students in seven introductory biology lecture courses (three organismal and four cellular) were provided information about the study and an online survey link by their instructor. The survey was the same for each class. Course sizes were: 75 (N = 2), 100, 150, 175, and 225 (N = 2). Students who chose to complete the survey received 1 to 3 bonus points (depending on the instructor) toward their 1,000-point total in the class.
Consistent with the Vision and Change in Undergraduate Biology Education (AAAS, 2011) report, these classes were taught using active learning, typically consisting of clicker questions, instructors’ verbal questions that students answered voluntarily or were called on to answer (cold calling), or in-class written work. Much of this work was done in small student groups. Six classes were taught in traditional stadium-style lecture classrooms (four classes in two of the same rooms). All the stadium-style classrooms had two central aisles. All except one of the rooms had student entrances at both the front and back. These entrances were symmetrical—with either one entrance at each corner of the room or one large central entrance and exit. The seventh classroom was not a stadium-style lecture class, but a large, flat (i.e., non-stadium style or tiered) classroom with long tables and chairs that seated about 75 students. This room had one entrance at the front left and one central aisle. Three of the rooms had centrally located presentation podiums, and three of the rooms had presentation podiums at the front right (relative to the instructor), although all instructors moved around the front of the room while they taught. Classroom layouts are shown in Figure 1.
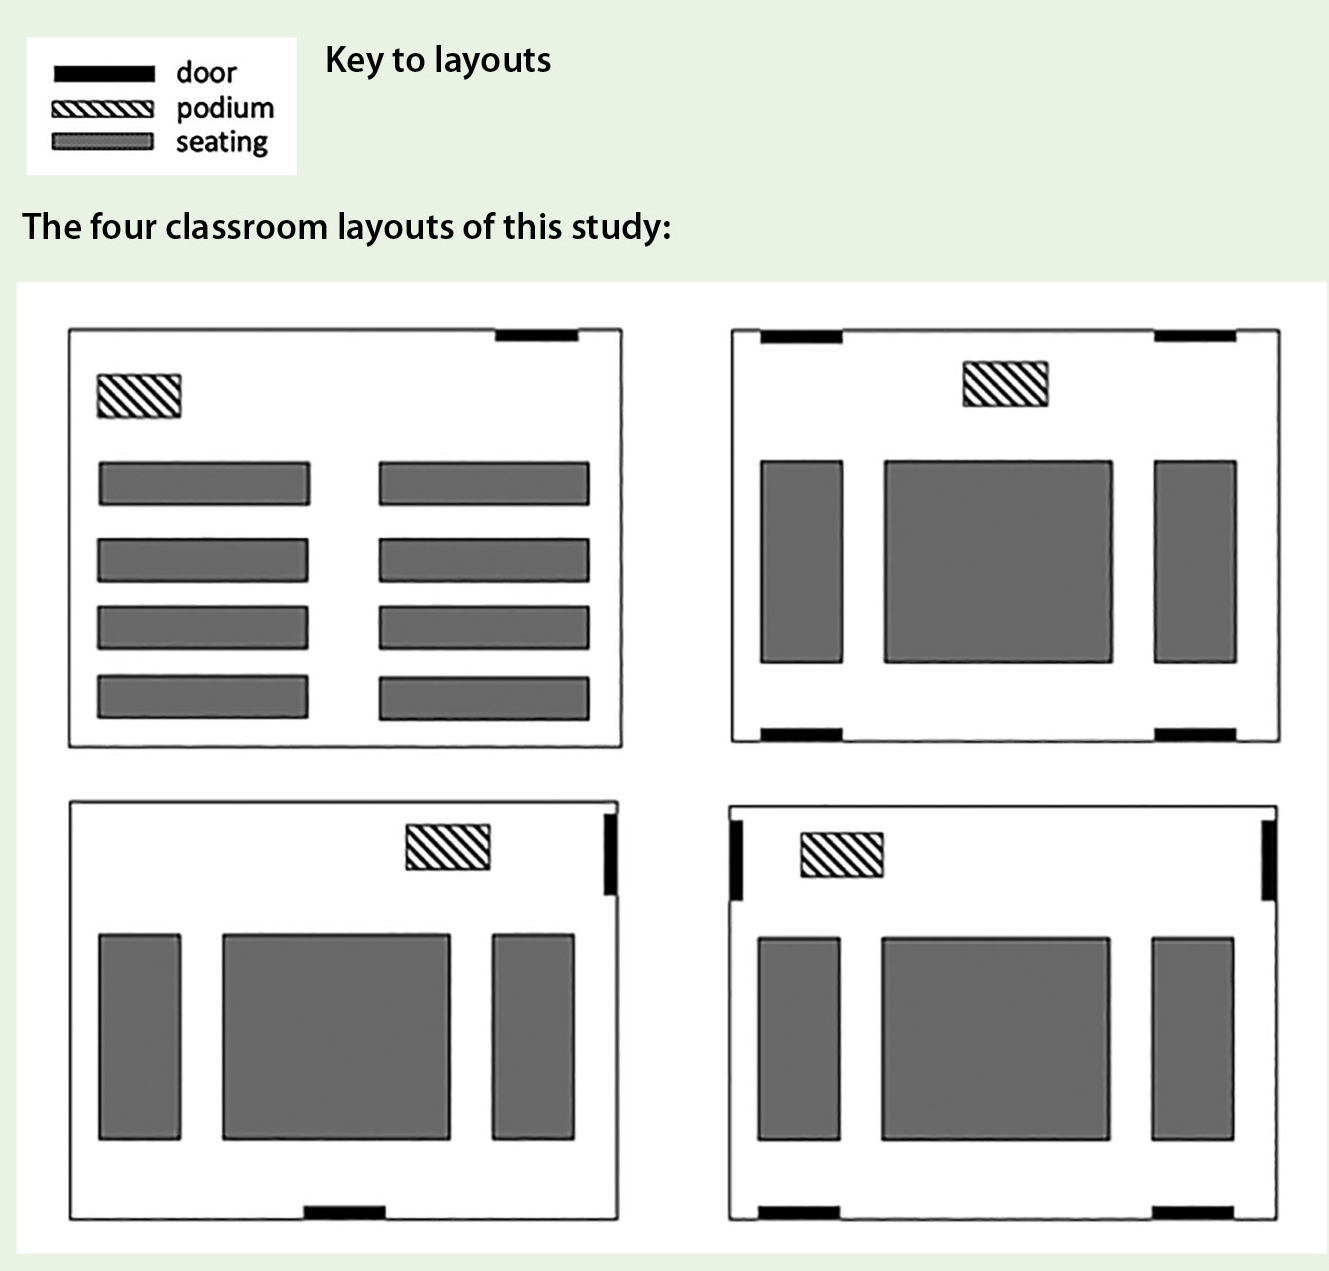
Classroom layouts of the rooms used in this study in spring 2017.
Data collection
The survey (Figure 2) collected students’ self-reported information about their active learning anxiety levels, their preferred seating location, why they preferred to sit there, and demographic information (gender, year in school, racial and ethnic identity, and instructor). The survey included four closed-response questions, 25 Likert scale questions, and two open-ended questions. There were also other questions not used as part of this study. The total time required to complete the survey was 10 to 15 minutes.
Survey items used in this study.
Please respond to the following items on a scale of strongly disagree to strongly agree (1 to 7).
[General anxiety]
- Biology lecture makes me nervous.
- Biology lecture is stressful.
- Biology lecture makes me anxious.
- Biology lecture scares me.
Please respond to the following items. Use the following scale:
1 = not at all true of me
7 = very true of me
[Test anxiety]
- When I take a test, I think about how poorly I am doing compared with other students.
- When I take a test, I think about items on other parts of the test I can’t answer.
- When I take tests, I think of the consequences of failing.
- I have an uneasy, upset feeling when I take an exam.
- I feel my heart beating fast when I take an exam.
Please respond to the following items. Use the following scale:
1 = strongly disagree
5 = strongly agree
[Communication anxiety]
- I have no fear of answering a question in front of the class.
- Certain parts of my body feel tense and rigid while answering a question in front of the class.
- I feel relaxed while answering a question in front of the class.
- My thoughts become confused and jumbled when I am answering a question in front of the class.
- I face the prospect of answering a question in front of the class with confidence.
- While answering a question in front of the class, I get so nervous I forget facts I really know.
[Social anxiety]
- I dislike participating in group discussions.
- Generally, I am comfortable while participating in group discussions.
- I am tense and nervous while participating in group discussions.
- I like to get involved in group discussions.
- Engaging in a group discussion with new people makes me tense and nervous.
- I am calm and relaxed while participating in group discussions.
Please respond to the following items. Use the following scale:
Rate each of the following active learning practices based on how much ANXIETY they cause you to feel during class this semester. Use the following scale: 1 = no anxiety, 4 = moderate anxiety, 7 = high anxiety
[Active learning practices anxiety]
- You are asked to respond to a clicker question.
- You are asked to volunteer to answer a question the instructor has posed.
- You are called on by name to answer a question the instructor has posed.
- You are asked to work with others in class to answer questions or complete an in-class activity.
Where do you prefer to sit in your biology lecture class? Right is relative to the teacher. If you have no preference, leave this question blank.
front-right, front-middle, front-left, middle-right, middle-middle, middle-left, back-right, back-middle, back-left
Why do you prefer to sit in the location you indicated?
[open response]
What is your gender identity?
- Female
- Male
- Prefer not to answer
- Open response
What year are you in school?
- 1 (freshman)
- 2
- 3
- 4
- > 4
What is your racial/ethnic identity?
[open response]
What is the name of the professor of your biology lecture class this semester?
- List of instructors
Students’ perceptions of their general anxiety toward the course were assessed using a survey modified from Papanastasiou and Zembylas (2008) by England et al. (2019). We also measured test, communication, and social anxiety, as these are common in large introductory courses (Culler & Holahan, 1980; Gerwing et al., 2015; Zeidner & Matthews, 2005). For test anxiety, the items from the Motivated Strategies for Learning Questionnaire (MSLQ; Pintrich et al., 1991) were used. We also used the communication anxiety (talking in front of the class) and social anxiety (working with peers) scales from the Personal Report of Communication Apprehension-24 (PRCA-24; McCroskey, 1982) instrument. To measure student anxiety about specific active learning practices, single-item measures asked students to rank their anxiety about four active learning practices (England et al., 2017).
In addition to measures of anxiety, students were asked, “Where do you prefer to sit in your biology lecture class?” The preferred seating location was based on nine potential locations: front-right, front-middle, front-left, middle-right, middle-middle, middle-left, back-right, back-middle, back-left. Students were provided a reference to the teacher (right and left were in reference to how the teacher saw the class) and asked to select one preferred location from the nine options. We explicitly indicated that their preferred location may differ from where they actually sat for various reasons. Students then answered an open-ended question explaining why they preferred that location (“Why do you prefer to sit in the location you indicated?”).
All procedures for this study were approved by the institution’s human subjects review board prior to the start of the research (IRB-16-03181-XP).
Data analysis
Anxiety levels and seating location
The survey data were downloaded to an external program for statistical analysis (SPSS, 2017). Any responses from students who did not consent to participate in the study or who were younger than 18 were removed from the data set. There were 665 students who completed the survey; however, not every student answered every question. The respondents of the survey were mostly freshmen (62%), female (67%), and White (76%) (Table 1). Response rates for each class ranged from 28% to almost 100% of students in the class (N = 25 to N = 227 per class).
Students’ preferred seating locations were coded as a number from 1 to 9, each aligned with one of the nine classroom locations. Students who selected more than one location were removed from the data set. We pooled the data from the individual lecture classes because the sample sizes for each of the nine locations in each class were too small for robust statistical analysis.
Individual student responses to the four general anxiety items were averaged to arrive at a mean general anxiety score for each student (with 7 being the highest level of anxiety). These student anxiety scores were then sorted by preferred seating location (1 to 9) for each student, and the scores of the students in each of the nine locations were averaged. Student responses to the test anxiety scale were also averaged, then sorted and averaged by room location. Student scores for communication and social anxiety were calculated based on the protocol provided by McCroskey (1982). Communication and social anxiety scores for individual students ranged from 6 to 30, with higher scores indicating higher levels of anxiety. Once again, students were sorted into their preferred room locations, and scores for communication and social anxiety were averaged for each location. For the single-item measures of anxiety toward particular active learning practices, averages for students who preferred each of the nine room locations were calculated (once again, a score of 7 was the highest level of anxiety for each practice). The dependent variable for all analyses was the average anxiety level for each of the nine room locations. The constructs of general, test, communication, and social anxiety were validated with this population in fall 2016 (England et al., 2019).
We conducted a multivariate analysis of covariance (MANCOVA) with the dependent anxiety variables, room location as a fixed effect, and year in school as a covariate to test whether there was a difference in the dependent variables by location and whether the student’s year impacted the model. Based on the MANCOVA results, we then conducted separate analyses of variance (ANOVAs) with post-hoc tests (Tukey’s honestly significant difference [HSD]) for the anxiety variables with room location as a fixed effect.
Student explanations for preferred seating location
A total of 590 students indicated where they preferred to sit in the room and why they chose to sit there, with preferences as follows: 23 in the back-left, 27 in the back-middle, 29 in the back-right, 52 in the middle-left, 107 in the middle-middle, 59 in the middle-right, 69 in the front-left, 151 in the front-middle, and 73 in the front-right.
Responses indicating why students preferred to sit in a particular location underwent inductive thematic analysis (Braun & Clarke, 2006). Through this process, we were blind as to the seating preference of the students. The first and second authors each read the explanations independently and made lists of potential codes that would capture most of the student responses. We then met to generate a consensus list of codes into which we would sort the student responses.
We then independently assigned codes to the student responses. Students sometimes gave multiple reasons for their seating preference, in which case students received multiple codes for their response (e.g., to see, to hear, and to be close to the professor were separate codes). As we coded, we had regular discussions about any coding difficulties and revised the coding sheet and recoded responses to reconcile any confusion.
After independently coding all student responses, one researcher compared all codes and identified those with and without agreement between coders. We had an initial agreement of 86.7%. All codes that were different between the coders were discussed until agreement was reached. The agreed upon and reconciled codes were used as the final codes for each student response.
After codes were assigned, the data were sorted by preferred seating location, and a frequency for each code in each of the nine room locations was generated. As we organized these data, we compiled the codes into overarching themes that described the codes. For example, there were many codes about wanting to be near the instructor to hear, near the screen to see the slides, and near the front to stay focused. These were grouped into an “engagement” theme. Using the same technique, we grouped students who said they did not want to be noticed, or wanted to have more space, into an “Avoidance” theme.
Results
Anxiety levels and students’ preferred seating locations
The number of student responses for each classroom location varied from a low of 14 in the back-left to a high of 146 in the front-middle; however, responses varied by location and question. Response rate ranges are indicated in Figure 3.
For the overall sample, students’ general anxiety averaged slightly less than the midpoint on the 7-point Likert scale (3.07). Of the four active learning practices, student anxiety was highest for volunteering to answer a question (3.96 out of 7) and cold calling (4.73 out of 7) and lowest for clicker questions (2.35 out of 7) and group work (2.70 out of 7). Average test anxiety was almost at the middle of the 7-point Likert scale range (3.95). Both social anxiety (20.05) and communication anxiety (19.97) were mid-range on the scale that ranged from 6 to 30.
The MANCOVA revealed differences among the anxiety variables by location (Wilks’ lambda 0.784; F(64, 2095) = 1.408, p = .019) and indicated that year was not significant. For the ANOVA results, there were no differences in general anxiety among the students who preferred to sit in different room locations. There was a difference in test anxiety by location (p = .022), with higher levels of test anxiety in the back-left and front-middle (throughout this article, a statement of room location is inferred to mean “students who preferred to sit in X room location”), and lower levels of test anxiety in the back-right (see Figure 3 for anxiety values and significant differences by location; Table 2 shows the significant post-hoc room location comparisons with p-values). The overall communication anxiety model was significant (p = .045), but the post-hoc analyses did not identify significant differences among specific locations. Social anxiety was also significant overall (p = .004), with the back-left having higher levels of social anxiety, and all front-row locations and the middle-middle having lower levels of social anxiety.
Among the four active learning practices, each had significant differences among particular room locations. Anxiety toward the use of clickers was significantly different among the nine locations (p = .002), with the back-left, middle-right, and front-middle having higher levels of clicker anxiety than the back-right. There was an overall significant difference among locations for anxiety about volunteering to answer a question (p = .012), with the middle-right having higher levels of anxiety and the front-right having lower levels of anxiety. There was also a significant difference among locations for anxiety about cold calling (p = .024), with higher levels of cold call anxiety in the middle-right and lower levels of cold call anxiety in the back-right. Anxiety toward group work was significantly different among the nine locations (p = .012), with the back-left having higher levels of group work anxiety and the back-middle, back-right, middle-middle, and front-right having lower levels of group work anxiety.
The only location in the room that did not have higher or lower anxiety than other locations was the middle-left (Figure 3).
Explanations for seating location
The codes were organized into five overarching themes: engagement, proximity, ease, avoidance, and view (Table 3). Students choosing a location for engagement wanted to see the screen, hear the instructor, and pay attention to the content and thought that location would be less distracting than others. The proximity theme reflected a code of students wanting to be close, but not too close, to the instructor and content. An ease theme reflected students’ desire to be relaxed and comfortable and able to find a seat easily and leave the classroom when needed. The avoidance theme reflected codes of wanting to sit apart from others, get away from the crowd, spread out, and not be noticed. Finally, the view theme encompassed codes of wanting to see the landscape of the classroom and view all students at once.
| Table 1. Demographics of student survey sample (N = 665). | ||||||||||||||||||||||||
|---|---|---|---|---|---|---|---|---|---|---|---|---|---|---|---|---|---|---|---|---|---|---|---|---|
|
||||||||||||||||||||||||
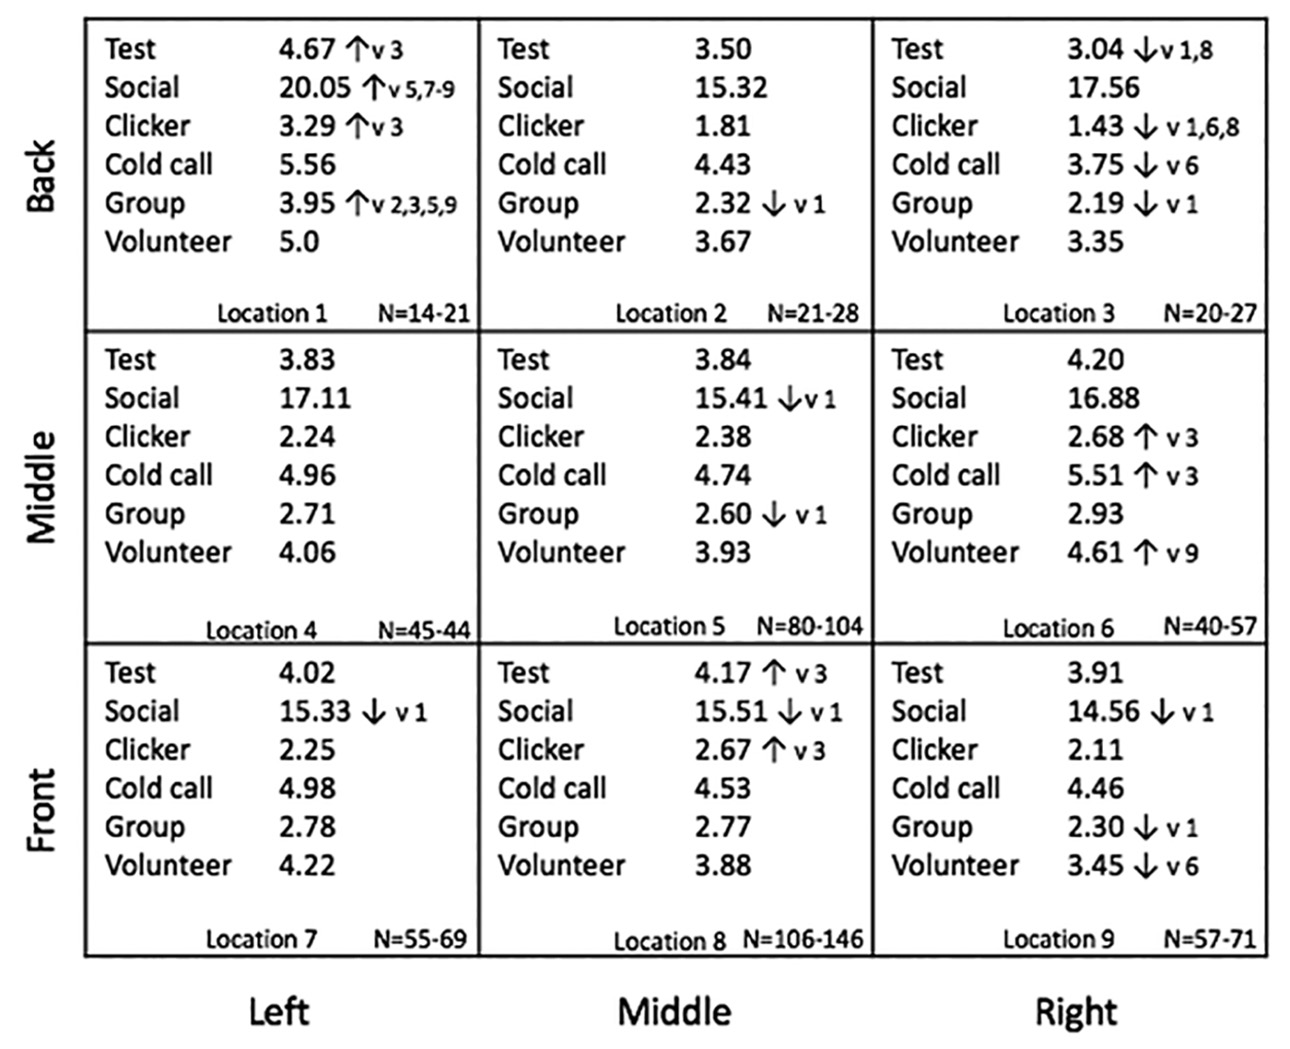
Active learning anxiety levels by room location (right is the teacher’s right; front is the front of the classroom).
Note. Each of the nine locations is numbered at the bottom of each cell. The average of each anxiety measure is listed to the right of each type of anxiety (Test = test anxiety, Social = social anxiety, Clicker = clicker anxiety, Cold call = cold call anxiety, Group = group work anxiety, Volunteer = volunteer anxiety). Arrows indicate significant differences between specific locations (p-values shown in Table 2), with up arrows indicating higher levels of anxiety and down arrows representing lower levels of anxiety based on Tukey post-hoc comparisons among the nine room locations. The specific statistical differences are noted to the right of each arrow, with a v indicating “statistically different compared to,” followed by the room location number it differed from. Student response rates for each location are shown in the bottom right corners; response rates varied by question.
| Table 2. Significant post-hoc comparisons for each anxiety type, showing specific room location comparisons where p < .05 (ANOVA and Tukey’s HSD). | |||||||||||||||||||||||||||||||||||||||||||||||||||
|---|---|---|---|---|---|---|---|---|---|---|---|---|---|---|---|---|---|---|---|---|---|---|---|---|---|---|---|---|---|---|---|---|---|---|---|---|---|---|---|---|---|---|---|---|---|---|---|---|---|---|---|
|
|||||||||||||||||||||||||||||||||||||||||||||||||||
The assignment of themes to each room location was determined by identifying the top three highest frequency codes for each of the nine areas and matching the theme to those codes (e.g., if “need to see” was in the top three in the middle-middle, this indicated “engagement” as a theme in that location). In one case, ties in the top three codes resulted in four themes for one location, or in other cases all three codes were in the same theme, resulting in only one theme for a room location. The themes for each location and summary of quantitative results are shown in Figure 4.
For the engagement theme, as student seating preference moved from the front to the back of the classroom, there was an overall decrease in the prevalence of engagement codes; however, engagement codes were among the top three most frequent codes in each location except the back-right. The codes related to the proximity theme were most frequent in the middle-middle and middle-right portions of the classroom. Avoidance codes were rare in the front (never rising into the top three in frequency) and increased toward the back of the room, but they only broke into the top three codes in the back-left of the classroom. Ease codes were also infrequent among students who preferred sitting in the front of the classroom; none of these codes were in the top three for any of the front room locations. These codes increased in proportion as seating preference moved toward the back of the classroom, with this theme identified for all back-row locations and the middle-left. View codes were more likely to be mentioned by students who preferred the back-left and back-middle.
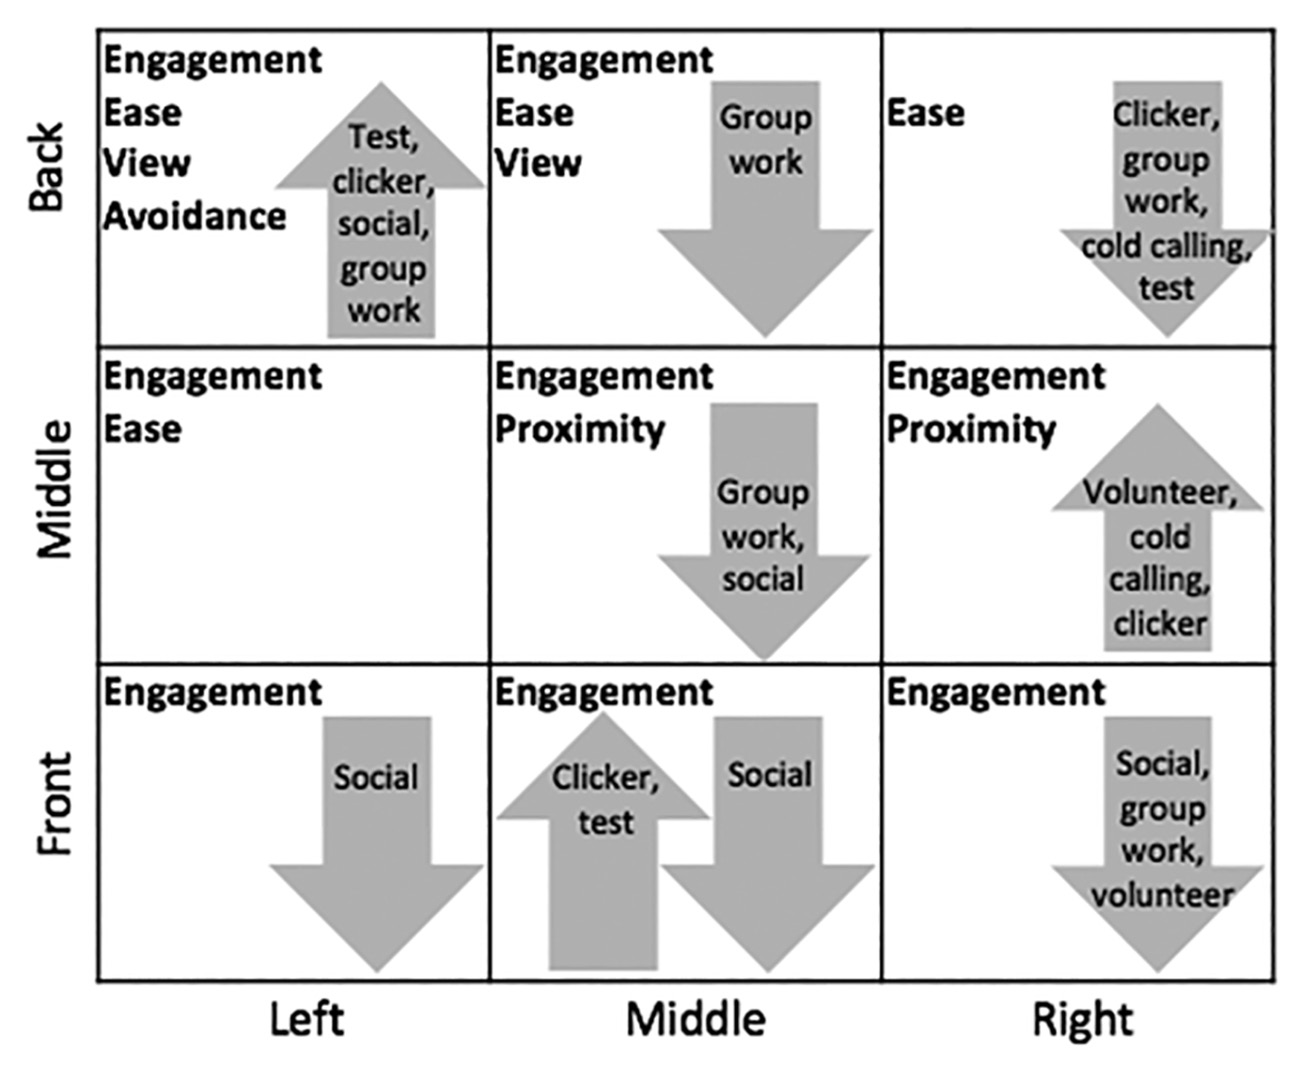
Seating preference themes by room location, as well as a summary of the significant differences in test, social, clicker, volunteering, cold calling, and group work anxiety levels among locations.
Note. Up arrows represent higher levels of anxiety compared to at least one other location, and down arrows represent lower levels of anxiety compared to at least one other location (see Figure 3 and Table 2). “Right” is in reference to the teacher’s right.
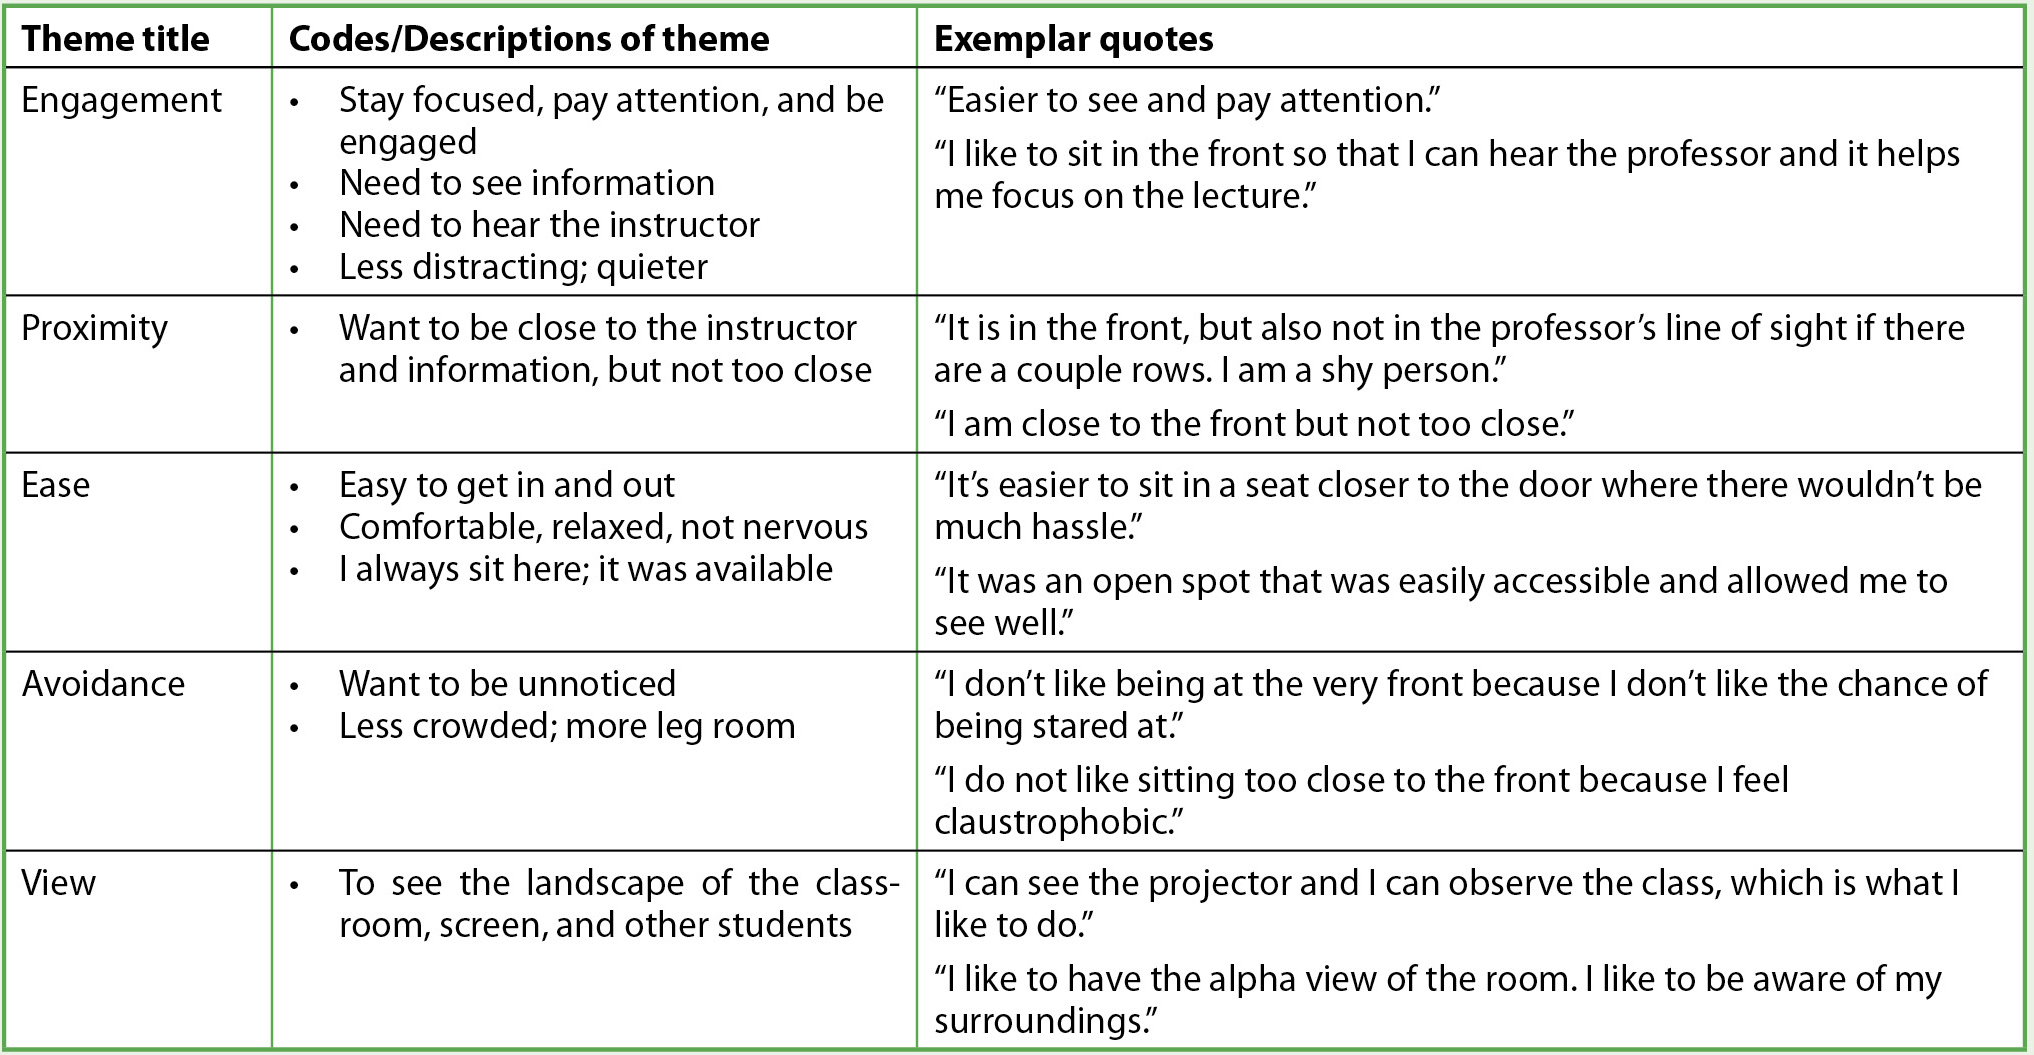
The most frequent final themes related to students’ preferred seating location, with a description and supporting quotes.
Discussion
Our results indicate that certain types of active learning anxiety vary by student seating preference in introductory biology classrooms at this university. The underlying reasons for student preference in seating location were an apparent tension between wanting to be engaged in the class (seeing, hearing, and staying focused), yet also wanting to avoid notice, seek ease (relaxing and getting in and out), and have a view of the whole classroom. Codes related to student engagement dominated seating preferences in the front row but were mixed with other themes of proximity, view, ease, and avoidance as student preference shifted to the back. These themes were not directly related to anxiety levels, however; instead, anxiety varied by room location and theme combinations.
It is likely that student personality plays a role in seating preferences, as suggested by Losonczy-Marshall and Marshall (2013), who indicated motivation, sociality, and environmental preference as some of the main factors influencing seating preference. Our study expands that work by aligning student room location preference with specific types of anxieties, and it supports work by Rebeta et al. (1993) that suggests that anxiety increases toward the back of the class, although our results suggest some nuance to this generalization. In our study, students with engagement tendencies and who were low in avoidance and ease codes were more likely to prefer the front of the room. These students had uniformly lower levels of anxiety about social interactions. The back-right was favored by students who were focused on ease, did not value engagement, and had low anxiety, while those who preferred the back-left had higher relative anxieties. Thus, anxiety was not uniform in the back row. These findings are important for instructors because if they let students sit in their preferred seating locations, there may be differences in student participation and engagement with active learning in different room locations, as suggested by Parker et al. (2011), and perhaps even student grades, as reported by Benedict and Hoag (2010) and Marshall and Losonczy-Marshall (2010).
In seeking general patterns from this study, we found that students who preferred the front row, middle-middle, and middle-back were generally more similar to each other than students who preferred the other room locations. Students who preferred the middle-left versus middle-right and the back-left versus back-right showed curious patterns. Students who preferred the middle-right had high anxiety for questioning and clickers and were concerned with engagement and being “close, but not too close.” On the other side of the room, students who preferred the middle-left had no anxiety differentials and chose the location for engagement and ease. In contrast, students in the back-left of the room had the highest anxiety compared to the back-right. Students in the back-left had many aspects of high anxiety and were difficult to characterize in terms of why students preferred that location. Students in the back-right, however, all had low anxiety, and their seating preference was almost solely focused on ease. These differences between the middle-left and middle-right and back-left and back-right are difficult to explain. In some ways, they mirror results by Karev (2000) and Harms et al. (2015) that suggest there are distinct left versus right seating differences that may be related to anxiety (Luck, 2006). However, our results suggest that there is no general rule about the left versus right side of the classroom in terms of our students’ anxieties, and we did not find a distinct seating preference for one side of the classroom. However, it is likely that classroom context plays a large role in seating preferences, meaning classrooms that look different from ours may generate different results. It is also likely that how individual instructors use active learning practices makes a difference (Cooper et al., 2018).
Given that anxiety impacts persistence in the major at this university (England et al., 2017, 2019), it is important to investigate how anxiety may differentially affect students in introductory biology classes. Our work suggests that at our university there are differences in student anxiety by classroom location that may impact the efficacy of particular active learning practices. For example, an instructor who unknowingly asks more questions of students sitting on the middle-right side of the classroom may increase students’ apprehension and decrease the utility of that practice for those students (Cooper et al., 2018; Eddy et al., 2015; England et al., 2017). Instructors should also anticipate that students seated in certain areas of the room may be less likely to work productively in groups. At our university, for example, instructors could monitor group work more closely in the back-left of the classroom and use supportive language when asking for volunteers or cold calling students in the middle-right (Seidel et al., 2015).
Limitations
We were unable to include analysis by individual classes in this study. It would have been preferable to conduct the analyses by classroom to see whether there was an instructor or room effect to spatial anxiety. This may suggest that instructor practice (e.g., more questioning; see Cooper et al., 2018; England et al., 2017), movement within the room, or even room arrangement may impact seating location preference and anxieties. Although asking students to articulate their reasons for seating preference yielded rich data, it was not nuanced enough to parse out reasons for selecting the right versus the left side of the room, which turned out to be an important factor. More work on right versus left seating preferences related to anxiety is merited.
Conclusion
We hope this study helps instructors think about how students in different parts of large lecture classes may differ in their anxiety levels. This study may influence instructor practices related to specific active learning activities, although more research is needed on this topic. Observations of engagement differences between these nine spatial locations, particularly regarding specific active learning practices, would bolster specific suggestions. Assessing how instructors implement active learning in different classes and aligning these practices with anxieties of students in different locations would also offer insight into practice. These research studies fall firmly into the category of what Freeman et al. (2014) called “second generation active learning,” in which knowing the details of implementing active learning will be critical to student success in our classes.
Elisabeth E. Schussler (eschussl@utk.edu) is a professor in the Department of Ecology and Evolutionary Biology and associate head for undergraduate programs at the University of Tennessee, Knoxville (UTK); Brianna Reynolds earned a bachelor’s of science degree from the Department of Ecology and Evolutionary Biology at UTK in 2019; Benjamin J. England is an assistant professor in the Biology Department at Saint Louis University in St. Louis, Missouri; and Jennifer R. Brigati is an associate professor in the Department of Biology and chair of the Division of Natural Sciences at Maryville College in Maryville, Tennessee.
Biology Pedagogy Teacher Preparation Teaching Strategies Postsecondary