
Research & Teaching
Recent Developments in Classroom Observation Protocols for Undergraduate STEM
An Overview and Practical Guide
Journal of College Science Teaching—September/October 2022 (Volume 52, Issue 1)
By Joan Esson, Paul Wendel, Anna Young, Meredith Frey, and Kathryn Plank
Over the past decade, researchers have developed several teaching observation protocols for use in higher education, such as the Teaching Dimensions Observation Protocol (TDOP), Classroom Observation Protocol for Undergraduate STEM (COPUS), Practical Observation Rubric to Assess Active Learning (PORTAAL), and Decibel Analysis for Research in Teaching (DART). Choosing a protocol for a particular need can seem daunting. In this article, we describe these protocols—including characteristics such as theoretical lens, disciplinary expertise required, complexity, level of inference, type of behavior recorded, training time required for implementation, and data output—and discuss the strengths and weaknesses of each protocol for different uses. This article will aid anyone in choosing effective observation tools for their particular needs, including instructors who want to address specific questions about their own teaching and researchers who are studying teaching and learning.
To improve student persistence in the sciences, postsecondary educators need a better understanding of teaching and learning in the classroom (President’s Council of Advisors on Science and Technology, 2012; National Science Board, 2007). Observation protocols offer one way to capture specific behaviors and interactions exhibited by faculty and students, and they are typically more objective than faculty self-reports and student evaluations (American Association for the Advancement of Science, 2013; Marsh, 2007). Thus, teaching observations can play a key role in evaluating instructors; measuring changes following professional development; characterizing teaching for a course, department, school, or multi-institutional study; and providing data for research in the scholarship of teaching and learning (SoTL). The proliferation of protocols, especially over the past decade, has posed a challenge to practitioners and researchers determining which protocol to use.
Although earlier reviews have compared observation tools, they have not necessarily included more recently developed protocols or focused on higher education classrooms (Hora & Ferrare, 2013; Klette & Blikstad-Balas, 2018; American Association for the Advancement of Science, 2013; William T. Grant Foundation et al., 2015). In this article, we review recent additions to the higher education classroom observation landscape, with an emphasis on training and expertise requirements, appropriate use, and interpretation of results. We aim to provide college teaching faculty and SoTL researchers with a practical guide to recent observation protocols for use in postsecondary science classes.
Criteria for selecting an observation protocol
Before describing the observation protocols, we first consider two main questions: (a) What are the goals for conducting observations? (b) What would it take to implement a particular protocol?
What are the goals for conducting observations?
The first step when selecting an appropriate observation protocol should be considering the purpose of the observations and the research goals or questions. Is the purpose instructor evaluation, professional development, instructor self-assessment, institutional effectiveness, or research? If the purpose is research, possible questions include the following:
- What are the predominant teaching approaches or techniques in a department or across the sciences at a university?
- What are students doing during class?
- How faithfully do instructors implement a particular teaching approach?
- Does changing a teaching approach lead to a change in student engagement?
- To what extent do classroom questions encourage lower- or higher-order thinking?
The nature of the question will guide consideration of instrument characteristics, such as the type of data recorded, the data output, and the theoretical lens.
Type of data
When choosing an observation tool, one should consider the type of data recorded, including both the sampling rule (the focus of the observation) and recording rule (how it is recorded; Martin & Bateson, 1986). Each rule has inherent challenges. For example, in a large survey class, it would be impractical to record all behaviors by all individuals in the class. Therefore, most protocols sample only specific behaviors (e.g., student poses a question, instructor demonstrates a concept) during the observation period. With regard to the recording rule, some protocols continuously record all instances of certain behaviors. Others use interval recording methods (e.g., whether a student posed a question during a 2-minute interval).
The sampling and recording rules determine how the observation needs to be conducted. If the goal lends itself to observing relatively few behaviors using interval recording, then it may be possible to conduct in-person classroom observations. However, if precise timing of behavior onset is needed, or the number of behaviors under study is comparatively large, then a recorded class would enable greater measurement precision and accuracy.
Type of data output
Another consideration is the type of data to be gained from the observation tool. Some protocols yield a breakdown of the frequency or percentage of time spent on certain activities, while other instruments provide more detail about specific elements of classroom activities.
Theoretical lens
One should also consider whether the instrument is guided by a theory of what constitutes good teaching. Theory-driven assessment is beneficial to instructors who are engaged in observation of their teaching for professional development purposes; they may appreciate having the theoretical framework to guide their teaching practice. However, for other projects, an instrument with a defined theoretical lens can impact instructor buy-in. For example, some instructors may be reluctant to participate in observations for research, even confidential ones, if they have reason to believe they will be judged against a particular standard for good teaching. If instead the instrument simply records student and faculty behaviors, instructors may be more willing to be observed.
What would it take to implement a particular protocol?
Once observation goals have been determined, the practical questions of implementation should be considered. Broadly, these implementation considerations include questions of personnel, time commitment, scalability, and classroom context. Realistically, no matter how well an instrument aligns with goals, a different instrument must be chosen if it cannot be implemented with the available resources. We should also note that goals and implementation are intertwined. For example, a study of prevalence of active learning within a department may require multiple observers and management of inter-rater agreement.
Personnel
Some observation protocols require little or no subject matter expertise by the observer, while others require passing familiarity with the subject, and some require substantially more. These expertise requirements may not be obvious initially in the instrument itself. For example, a novice observer could record that a question was asked but may require some knowledge of the topic to rate the level of question being asked. Thus, users must consider the amount of inference required to accurately implement the instrument (Schlesinger & Jentsch, 2016). Observer training requirements, whether for disciplinary experts or novices, must also be considered.
Time
Time commitments include training time for reliable results, observation time for the class itself, and the scale of the project—that is, how many classes will be observed and across how many sessions. Some studies have shown a single observation is sufficient to characterize classroom management (Schlesinger & Jentsch, 2016), while others indicate a minimum of four observations are needed to fully characterize a classroom because instructors may use different methods on different days (Stains et al., 2018). Answers to these questions will affect personnel considerations, as it will be more difficult to secure trained observers for multiple classes over multiple sessions, especially if subject matter expertise is needed.
Classroom context
Classroom context varies widely, from online courses to small face-to-face seminars, and the kind of data to be reasonably expected from these environments will differ as well. In a large lecture hall, it may be difficult for an observer to record student behaviors on the far side of the class if done in real time. People may also behave differently when they know they are being observed. Because the goal of classroom observation is to get an accurate assessment of a typical class experience, some effort at minimizing the visibility of observers may be warranted, which can impact decisions regarding real-time versus recorded observation.
Observation protocols
With a better understanding of observation goals and process, we can now consider specific observation protocols, including how the data are recorded, their constraints and affordances, and what kinds of questions are addressed with each tool.
Several observation tools are not reviewed in this article because they are too specialized. For example, the first widely used science-specific observation protocol may be the Reformed Teaching Observation Protocol (RTOP; Sawada et al., 2002; MacIsaac & Falconer, 2002). Physics education researchers developed RTOP; a disciplinary orientation is visible in items such as “Students used a variety of means (models, drawings, graphs, concrete materials, manipulatives) to represent phenomena.” Therefore, RTOP may not be appropriate for all undergraduate science teaching contexts. Other science-specific observation tools developed in the 21st century—such as the Classroom Observation Rubric (COR; Turpen & Finkelstein, 2009) for observing clicker use in the classroom, the VaNTH Observation System (VOS; Harris & Cox, 2003) developed to study bioengineering classrooms, and another tool that measures student resistance to active learning (Shekhar et al., 2015)—are highly specialized and have not yet been widely adopted, which is why we do not discuss them in this article. Other STEM-specific observation tools—such as UTeach Observation Protocol (Walkington et al., 2011) and EQUIP (Marshall et al., 2009)—are excluded because they are intended for K–12 observations and rarely used in postsecondary classrooms.
We will focus on four observation protocols—Teaching Dimensions Observation Protocol (TDOP; Hora et al., 2013), Classroom Observation Protocol for Undergraduate STEM (COPUS; Smith et al., 2013), Practical Observation Rubric to Assess Active Learning (PORTAAL; Eddy et al., 2015), and Decibel Analysis for Research in Teaching (DART; Owens et al., 2017)—that have been developed over the past decade, can be used across college science disciplines, and may provide fewer limitations compared to earlier observation tools. After introducing each protocol (summarized in Table 1), we will apply each to a video clip of teaching (Mazur, 2012) and discuss the benefits and limitations.
Teaching Dimensions Observation Protocol (TDOP)
Hora and Ferrare (2013) developed TDOP as a university STEM classroom observation protocol that requires less judgment about the quality of teaching than other methods, such as RTOP. Its dedicated website (tdop.wceruw.org) can be used to collect and analyze data and to automatically check inter-rater agreement.
TDOP was developed as part of the Instructional System of Practice (Hora et al., 2013). Additional aspects include a student survey regarding the influence of the instruction on their learning and a meeting between the observer and the instructor to improve understanding of the teaching-learning context (especially recommended for use in professional development). However, depending on goals, TDOP can be used without these additional data sources.
In the Instructional System of Practice approach, teachers, students, instructional artifacts, and aspects of the tasks are understood to interact with one another over time. Information is gathered around three basic dimensions (instructional practices, student-teacher dialogue, and instructional technology) and three optional dimensions (potential student cognitive engagement, pedagogical strategies, and students’ time-on-task). TDOP can be customized based on the needs of the instructor and observer to include the optional dimensions or exclude codes that are deemed unnecessary for the observation purpose.
In a TDOP observation, the observer may take notes on content or type of questions while coding the total class time in 2-minute intervals (e.g., small-group work under Instructional Practices: Socratic lecture or instructor comprehension question under Student-Teacher Dialogue: student question). The percentage of 2-minute intervals for each behavior can be computed or the occurrence of behaviors can be depicted over time (Figure 1). For professional development, the relative frequency of specific behaviors (such as active- versus passive-learning approaches) can be reported for individual instructors or compared among multiple instructors.
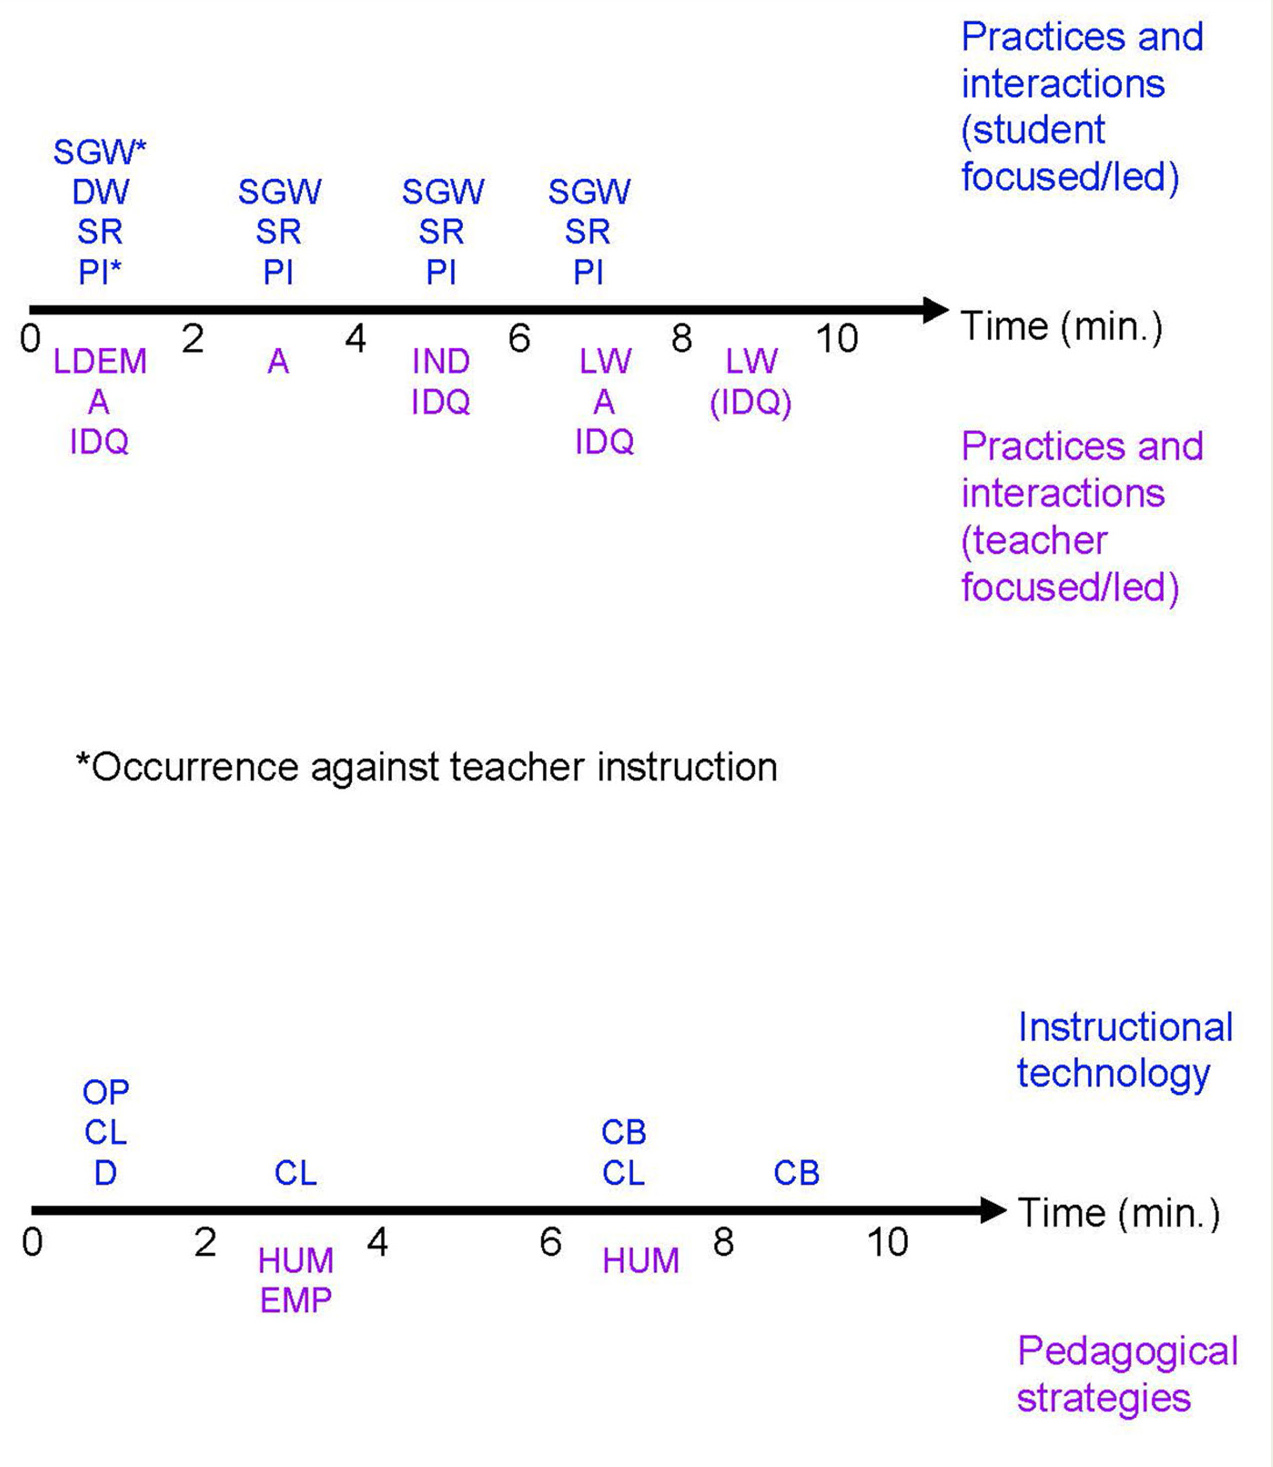
Timeline of TDOP codes observed in a sample course (Mazur, 2012).
Note. A = assessment; CB = chalkboard/whiteboard/SMART Board; CL = clicker response systems; D = demonstration equipment; DW = desk work; EMP = emphasis; HUM = humor; IDQ = instructor display question; IND = individualized instruction; LDEM = lecturing with demonstration of technology; LW = lecturing while writing; OP = overhead projector/transparencies; PI = peer interactions; SGW = small group work/discussion; SR = student response to teacher question.
TDOP has some limitations, including required content knowledge by the observer and significant observer training time of between 3 and 5 days if the optional dimensions are included (Hora et al., 2013). Another limitation is the one-zero sampling approach, wherein a behavior is not recorded (zero) if it does not occur within the 2-minute interval, but it is recorded (one) whether it occurs once, is a continuation from a previous interval, or occurs multiple times. Consequently, TDOP provides an overview of behaviors of interest during a class but does not yield true behavior frequencies or durations, as one-zero sampling overestimates rare behaviors and underestimates common ones.
Classroom Observation Protocol for Undergraduate STEM (COPUS)
Like TDOP, COPUS uses one-zero sampling over 2-minute intervals to record how faculty and students “spend their time” in university STEM classrooms with minimal reliance on observer judgments (Smith et al., 2013). Thus, COPUS has similar advantages and limitations to TDOP, yet COPUS was specifically created to better capture student behaviors and provide a tool that requires less training for observers (1–2 hours) to achieve high inter-rater agreement. Furthermore, because COPUS scoring does not require high-level content knowledge and judgments, undergraduates can serve as observers. An online observation platform—the Generalized Observation and Reflection Platform (GORP; https://cee.ucdavis.edu/GORP)—has been developed to collect and catalog data using COPUS.
In COPUS, an observer documents 12 instructor behaviors and 13 student behaviors in 2-minute intervals, then estimates what percentage of the classroom is engaged, categorizing the student engagement as low (< 20% of class), medium (20%–80%), or high (> 80%; Smith et al., 2013). As COPUS is purely observational and does not include subjective judgments of “good” teaching, faculty may be more comfortable having their classrooms observed. However, this protocol provides limited data to inform the quality of teaching (Reisner et al., 2020). COPUS provides accessible feedback to individual instructors in the form of pie charts or timelines of behaviors (Figure 2), but perhaps the greatest utility of COPUS is that—because it is objective, quantitative, and reliable across observers—it offers the ability to characterize the overall state of STEM teaching across instructors and institutions, with a recommended minimum of four observations per class (Stains et al., 2018).
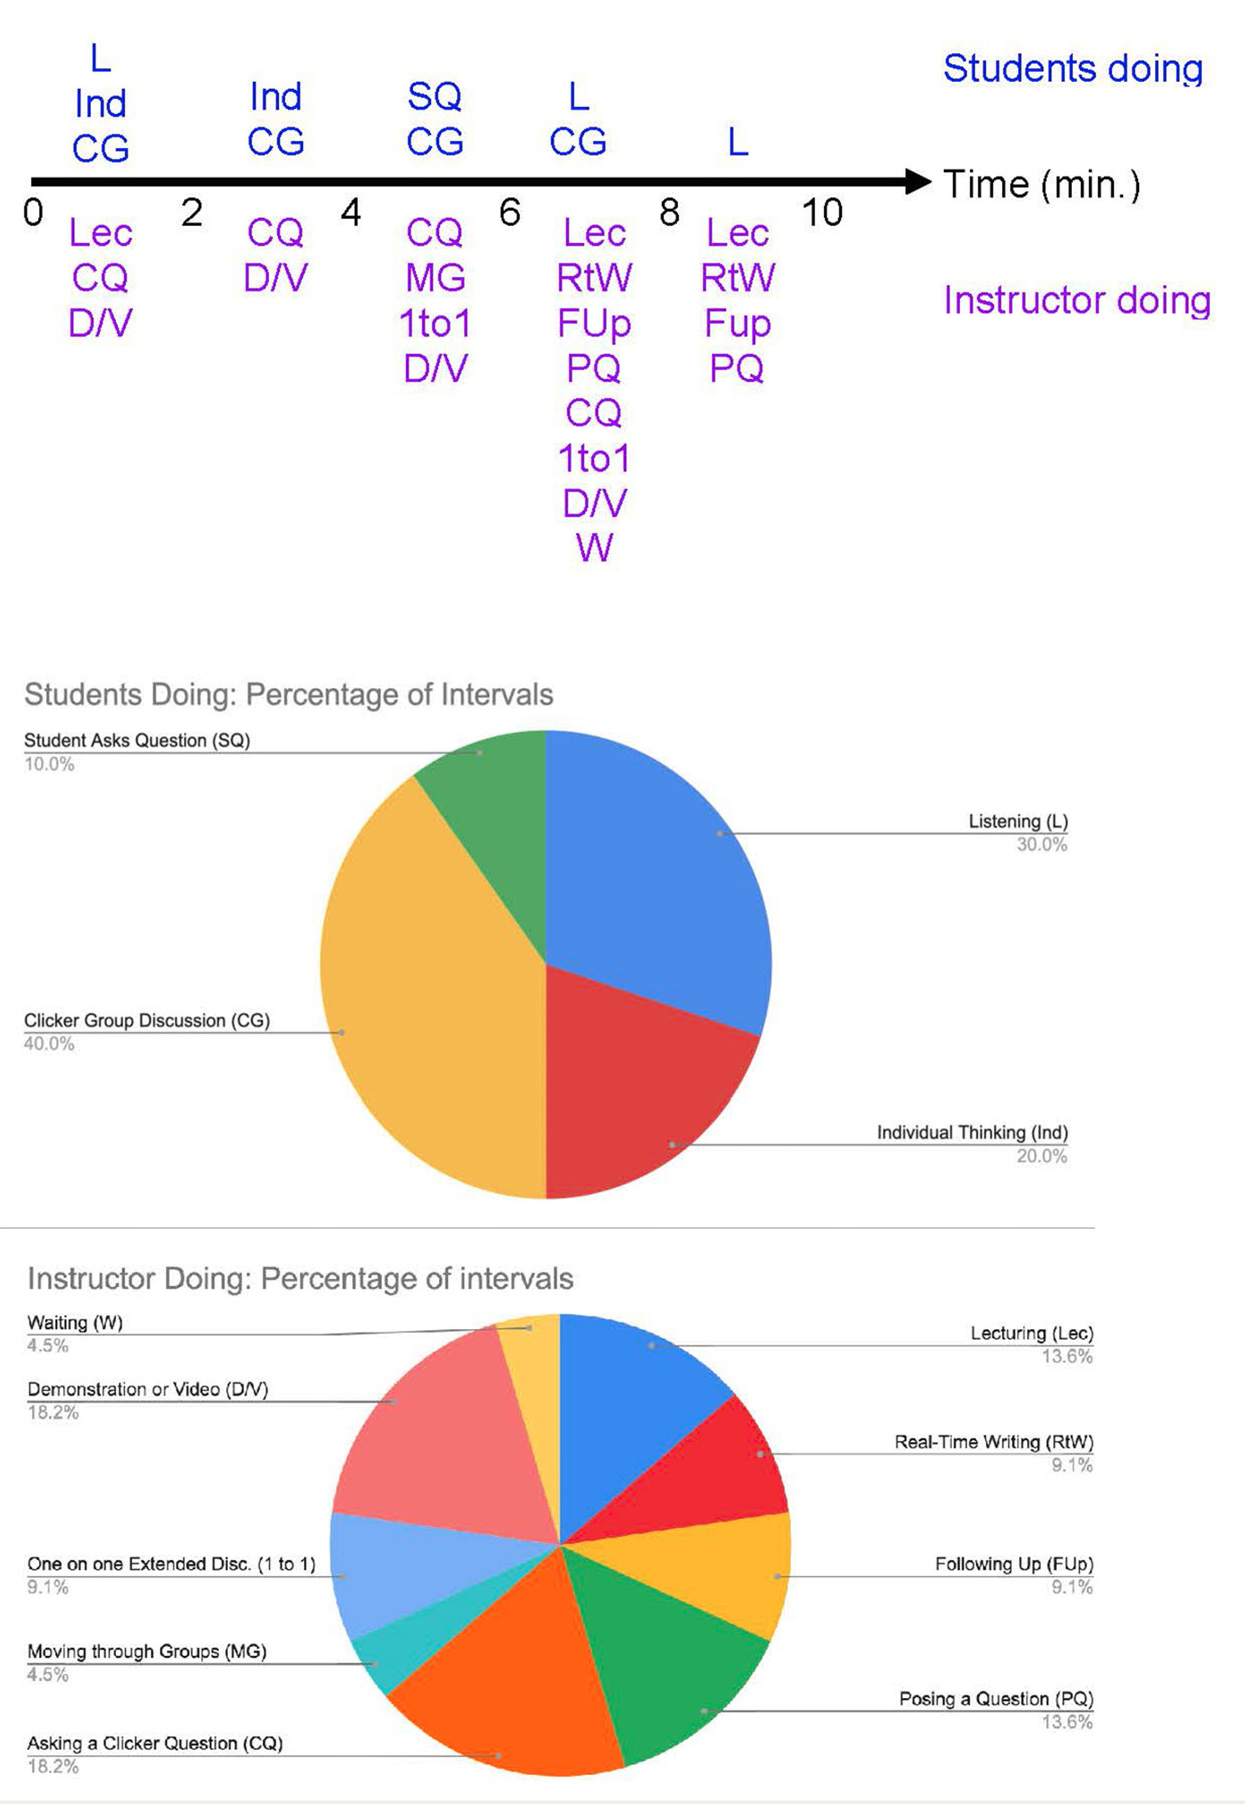
Timeline (top) demonstrating observed COPUS codes during a sample course (Mazur, 2012).
Note. Pie charts summarizing the percentage of 2-minute intervals in which the student (first pie chart) and instructor (second pie chart) behaviors were observed. 1 to 1 = instructor in one-on-one extended discussion; CG = students discuss clicker questions; CQ = instructor poses a clicker question; D/V = instructor demonstration or video; FUp = instructor follows up on a question or activity; Ind = students individually think/solve problems; L = students listen/take notes; Lec = instructor lectures; MG = instructor moves among groups; PQ = instructor poses a non-clicker question; RtW = instructor writes on board; SQ = student asks question; W = waiting.
Researchers have suggested concentrating on a subset of COPUS behaviors that still capture the majority of behaviors within typical classrooms (Lund et al., 2015) or presenting the data as a combined matrix of student and instructor behaviors to facilitate movement toward more active teaching methods (Ludwig & Prins, 2019).
Practical Observation Rubric to Assess Active Learning (PORTAAL)
PORTAAL was originally designed by biology education researchers, but it can be used to record active learning in any discipline (Eddy et al., 2015). Unlike TDOP and COPUS, PORTAAL is not designed to observe lectures but can provide detailed, nuanced information about active-learning activities, particularly from the students’ perspective.
Unlike TDOP or COPUS, PORTAAL documents how classes align with research-supported active-learning methods, measuring practice (the amount and quality of practice during class); logic development (facilitation of higher-order thinking skills); accountability (motivation of student participation); and apprehension reduction (reduction in students’ fear of class participation). This latter dimension distinguishes PORTAAL from other classroom observation protocols that do not typically account for student anxiety.
These four dimensions of active learning in PORTAAL are broken down into elements that can be documented and quantified (Table 2). Most of these elements can be observed in the classroom, but some require additional information. For example, in the element activities worth course points in the dimension accountability, observers analyze point distributions in course syllabi. Similarly, for the element alignment of practice and assessment in the dimension practice, observers use Bloom’s taxonomy (Anderson & Krathwohl, 2001) to analyze the cognitive level of assessment questions.
Pedagogical and content expertise is not required but is helpful for analysis of assessment questions, so as with COPUS, undergraduate students can be trained as observers for PORTAAL. Acceptable inter-rater agreement can be achieved in 5 hours of training using developer-provided materials. Two observers assess three randomly chosen class sessions throughout a term (Eddy et al., 2015).
Observers code each opportunity for students to actively engage with course material (e.g., clicker questions, instructor questions, worksheets) and record the duration of the activity, details about the activity (such as whether students are engaged individually or in small groups), the number of occurrences of certain behaviors (such as the instructor reminding students that errors are natural and useful or encouraging students to use prior knowledge), and the number of students involved in the behavior (such as explaining their logic). The observed behaviors are then converted into percentages of class time or activities in which specific research-based elements occurred, such as the percentage of activities that involve higher-order skills or that required students to explain answers to their peers (Table 2).
Because PORTAAL identifies how well instructors incorporate best practices into their classes, it is a useful tool for guiding instructors toward recommended teaching methods from education research and for instructor feedback relative to documented strategies. Thus, PORTAAL is useful for professional development, though some instructors might feel judged compared to such norms.
Currently, relatively few studies have been published using PORTAAL, though the initial publication examined 25 instructors in introductory biology at a large, public R1 university. Limitations of PORTAAL include an underestimate of certain elements, application to limited class environments, and the need for a video record of the class. For example, an element such as student confirmation may be underestimated because it is measured when an instructor verbally gives praise, but the instructor’s tone of voice or body language could also contribute to instructor confirmation. Additionally, the developers state that PORTAAL is designed for larger-enrollment courses using active learning in which it would be difficult for the instructor to interact individually with most students during class. Lecture-based courses, smaller classes, and those with whole-class or frequent student-to-student interactions would not be suited to this instrument. Lastly, because of the number of different elements measured and the need to note their duration, analysis of videotaped lectures is recommended over live analysis for better inter-rater agreement.
Decibel Analysis for Research in Teaching (DART)
While each of the preceding observation protocols displays unique elements, they do share a common cost: observation by a trained coder. In studies observing large numbers of classes, this can be a considerable drain on resources. To address this disadvantage, Owens and colleagues (2017) developed an automated tool to analyze the volume of sound recordings, as active learning is typically either louder (e.g., discussion) or quieter (e.g., thought activities) than traditional lecture (see output in Figure 3). DART does not require any training or even an observer in the classroom.
In a large sample of nearly 1,500 class sessions, the DART algorithm classified classroom activities as single voice (lecture), multiple voice (pair discussions, small-group activities), or no voice (paper writing, clicker questions) with roughly 90% accuracy (Owens et al., 2017). This tool is web based, free to use, and efficient, requiring only a few minutes of processing time for a 1-hour recording. DART readily allows individual instructors to analyze their own teaching activities over multiple class sessions. It also provides more accurate time data compared to TDOP or COPUS because it is sampled continuously, rather than in intervals. DART can be used in faculty development as empirical evidence of a change in teaching practice over time (Owens et al., 2018). However, DART has not yet been used as widely as COPUS.
The efficiency of the DART method does come with some costs. As the algorithm analyzes only sound waveforms, it does not go beyond categorizing the number of voices speaking. Consequently, it would not yield a clear picture of specific behaviors in the classroom. DART also tends to undercount active learning because a single voice is usually assumed to be an instructor lecturing; however, some of this time could be a student explaining an idea.
Case studies for how to select a tool for specific needs
Consider two scenarios: (a) a research question involving how group work relates to academic performance, and (b) an exploration of active learning and lecture in a course for professional development purposes. In the first case, the researcher must sample and record group work, which could be measured as percentage of time spent engaging in group work, the type of group work, how engaged students are in group work, or how cognitively challenging that group work is. In the second case, one might consider the amount of time lecturing versus type of and time spent in active learning. To understand the affordances and limitations of the different observation tools, consider the classroom clip “Eric Mazur shows interactive learning” (Mazur, 2012), in which the instructor uses a demonstration to introduce a clicker question and applies a think-pair-share method known as Peer Instruction (Mazur, 1997).
The easiest tool to employ, DART, indicates that for 47% of the class, multiple voices are recorded, and this occurs during the middle of the clip (Figure 3). DART signals group work but does not indicate a clicker question was used or how students engaged with it. Furthermore, it does not clarify whether the single voice represents the instructor lecturing or a student asking a question or whether the multiple voices accurately represent time on task. If only knowing the duration of multiple voices or when they occur during class is sufficient to answer the question, then DART would be the simplest tool to use, but if the question needs to clarify any other measure of group work, DART will not suffice.
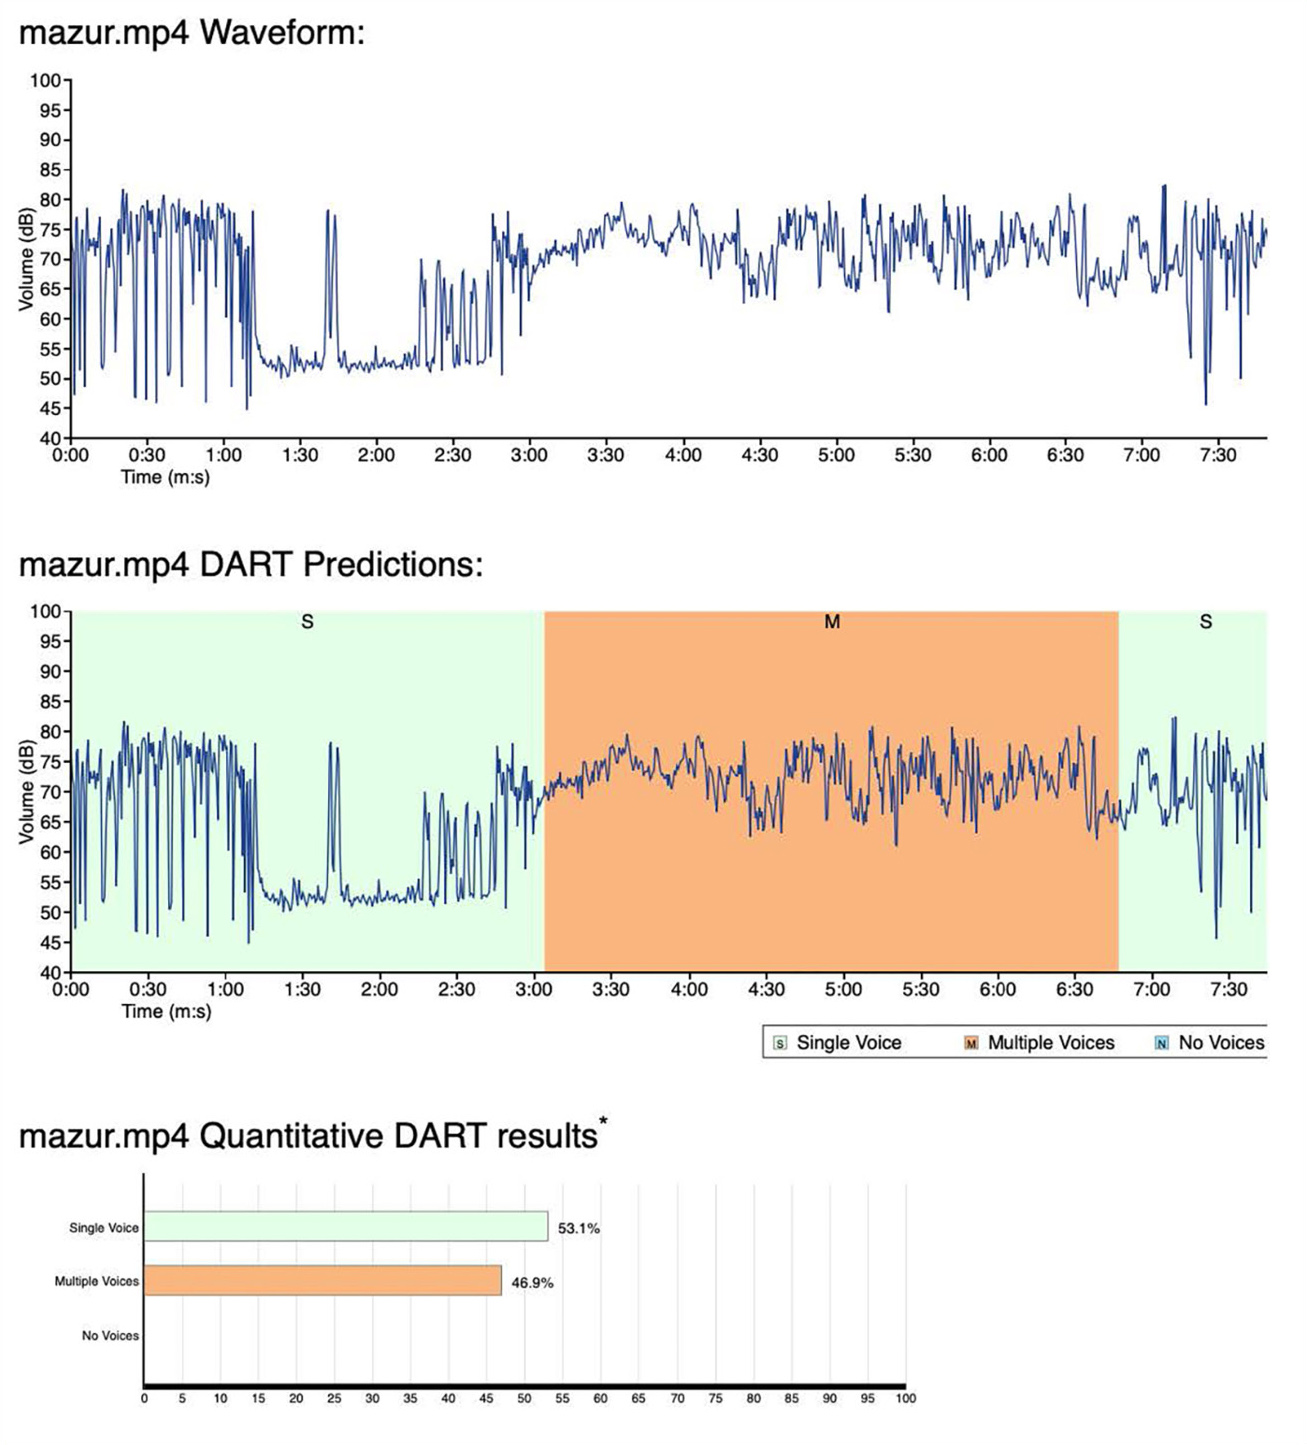
DART output from a sample course (Mazur, 2012).
Note. Timeline of volume level (top and center images) and percentage of class in different voices (bottom image). Note that the timeline is different from that of TDOP and COPUS shown in Figures 1 and 2, due to the continuous recording nature of DART versus the 2-minute interval nature of the other two protocols.
COPUS provides more information about what the instructors and students are doing during the clip (Figure 2). With respect to group work, we see that students were discussing a clicker question during the first four 2-minute intervals as opposed to a worksheet or other group assignment. Meanwhile, the instructor was moving through groups and talking to individual students or small groups, among other behaviors. Thus, two benefits of using COPUS over DART are that an observer could parse specific types of group work versus side conversations among students and could discern whether and how the instructor is interacting with students. With respect to exploring the use of active learning and lecture for professional development purposes, COPUS pie charts clearly demonstrate that the instructor spends 14% of time intervals lecturing while students are listening for 30% of the intervals and the remainder of the time they are engaged in more active behaviors (Figure 2). However, the percentage of time may not be as accurate as is provided by DART because COPUS uses one-zero sampling in 2-minute intervals. Like DART, the quality of group activity is not recorded with COPUS.
TDOP, like COPUS, also indicates how much the instructor uses lecture and active learning throughout the clip. However, TDOP also captures the type of technology (chalkboard, overhead projector, and clicker system) and pedagogical strategies, when optional dimensions are included (humor and emphasis of important ideas; Figure 1). Additionally, TDOP specifically includes a pre- and post-observation form, which may aid in professional development.
With respect to group work, TDOP captures similar data as COPUS, although when using the optional dimensions, TDOP could also describe the type of student cognitive engagement (articulating and problem solving). However, COPUS is superior for determining whether the instructor is interacting with a group of students or an individual because TDOP does not differentiate between these actions.
The remaining tool, PORTAAL, provides the most comprehensive look at group work. Not only could PORTAAL indicate the percentage of continuous time in which students talked through class material, but it also indicates that students discussed questions at a higher order of thinking for 100% of this time (Table 2). Also, the entire active portion of the class included time for students to think individually before discussing in small groups, indicating fidelity to the Peer Instruction method illustrated in the clip.
While PORTAAL is an excellent tool to document active learning, it fails to record any information about lecture, so it is not recommended to compare lecture to group work (Scenario b at the beginning of this section). However, PORTAAL would be suitable for addressing a question about the use of evidence-based practices in active learning by the instructor. Although the instructor uses best practices for the dimensions practice, logic development, and accountability, the instructor does not use any elements of apprehension reduction, which highlights an area for instructor improvement.
Conclusions
Observations can be powerful tools to accurately assess the classroom environment. Practitioners must select the appropriate instrument for achieving the goals they have in mind. A range of quantity and quality of data can be gathered through observations, so we hope this article offers a useful guide for determining which instrument is the best fit for a variety of needs. However, it is necessary to keep in mind that observations are only one piece of teaching and learning assessment, and they should be used with other tools as appropriate for specific goals.
Acknowledgments
The authors wish to thank the National Science Foundation for their support of this work (NSF #1347243).
Joan Esson (jesson@otterbein.edu) is a professor and chair of the Department of Chemistry, Paul Wendel is a professor and co-chair of the Department of Education, Meredith Frey is a professor and chair of the Department of Psychology, and Kathryn Plank is a professor in the Department of Education and the associate provost for curriculum, teaching and learning, and mission, all at Otterbein University in Westerville, Ohio. Anna Young is the director of education engagement at the Living Desert Zoo and Gardens in Palm Desert, California.
Pedagogy STEM Teacher Preparation