
feature
Teaching and Learning About Global Climate Change Online
Journal of College Science Teaching—September/October 2022 (Volume 52, Issue 1)
By Emily van Zee, Elizabeth Gire, Kelby T. Hahn, and Mackenzie Belden
Sessions of our laboratory-based physics course have been “meeting” synchronously online instead of on campus due to the pandemic. Shifting to remote instruction prompted us to create online versions of the course. In the unit on global climate change, for example, we continued engaging students in documenting their initial and evolving ideas; exploring the greenhouse effect; examining evidence of increasing global temperatures, rising sea levels, and melting glaciers; modeling causes of rising sea levels; considering ways individuals, communities, states, nations, and international organizations are taking action; and making connections to education policies such as the Next Generation Science Standards. Key aspects of this course have been creating opportunities for formative assessment and fostering a sense of community.
How does one turn a laboratory-based course into an online “meeting”? Our physics course for prospective elementary and middle school teachers has evolved over many years. Currently, it also serves as a general education science course for nonmajors. Initially, we had funding to design and teach a physics course that emphasizes integrating science and literacy learning (van Zee et al., 2013), and we later chose to add a unit that focuses on global climate change (van Zee et al., 2016). This article describes how we moved this laboratory-based course online during the pandemic and introduces our open-source textbook that was recently published online (van Zee & Gire, 2020).
First, we provide an overview of internet resources available for teaching about global climate change. Next, we characterize the open-ended ways we have taught this course on campus and online. Key aspects of this course have been creating opportunities for formative assessment and fostering a sense of community. For examples, we discuss our evolving approaches to teaching and learning about global climate change in versions of the course recently taught synchronously online. We close with a reflection on the challenges and successes we have experienced in shifting an on-campus, laboratory-based course to remote instruction.
Using online resources about global climate change
Many organizations and government agencies provide high-quality online resources for learning about global climate change. The National Science Teaching Association (NSTA, n.d.), for example, has a website dedicated to providing access to such resources. The National Oceanic and Atmospheric Administration (NOAA, n.d.) website includes a section that focuses on resources teachers can use to address issues relevant to their students’ interests. The National Aeronautics and Space Administration (NASA, n.d.a) offers an extensive website about weather and climate change for children.
NASA (n.d.b) also provides an in-depth website about global climate change for the general public, covering topics such as evidence, causes, effects, scientific consensus, vital signs, and questions and answers. A website by the European Environment Agency (2022) covers topics related to climate change adaptation and mitigation. The Intergovernmental Panel on Climate Change (IPCC, n.d.) website provides detailed reports based on peer-reviewed studies by scientists from all over the world. These agencies provide many resources that demonstrate worldwide interest in and concern about global climate change.
Engaging students in open-ended learning on campus and online
The first author (Emily) initially designed and taught this laboratory-based course on campus. She opened each session by inviting students to explore phenomena together in small groups. During class, she moved from group to group to monitor progress and provide guidance as needed. When the groups seemed ready, she would facilitate a whole-group discussion about ideas students might infer about the phenomena based on evidence from their observations. She typically closed sessions with time for students to write reflections about what they had learned. When the second author (Elizabeth) taught the course, she proceeded in a similar open-ended way, as did the third author (Kelby), the most recent instructor. The fourth author (Mackenzie) was a prospective elementary teacher enrolled in Emily’s spring 2020 remote version of the course.
Such open-ended ways of teaching have been challenging to adapt for remote instruction. Ongoing formative assessment and community building are essential when one teaches in such ways online (Kim et al., 2021). An important aspect of formative assessment is the instructor’s responsive feedback and students’ increased engagement (Gikandi et al., 2011). Respectful interactions among students themselves as well as with the instructor are key to building a sense of community online (Palloff & Pratt, 2013).
For us, ongoing formative assessment means both the instructor and students become aware of students’ initial ideas as they begin an exploration, monitor progress as students work together in their small groups, and ask open-ended questions that elicit what others are thinking and why. Building community means students have many opportunities to share their thinking with one another, work together deepening understandings about a topic, and perceive themselves as welcome and insightful participants in a common enterprise. In this article, we provide some examples of our approach to ongoing formative assessment and community building when teaching the unit on global climate change online.
Documenting students’ initial and evolving ideas
We document students’ initial ideas at the beginning of each unit via diagnostic questions that students answer in class. The students’ responses alert instructors to ideas on which students can build as well as those needing refinement. Responding to such questions also alerts students to topics of focus for the unit as well as their initial ideas about these topics. Near the end of the unit or the course, students respond again to some of the same questions. To answer a homework or exam question, they use the evidence of their initial and current responses to reflect on what and how they learned about a particular topic.
When shifting to remote instruction, we easily moved these formative assessments online via ungraded surveys in our institution’s learning management system, Canvas. The diagnostic questions for the global climate change unit include the following:
How aware are you of the greenhouse effect?
- I have not heard of it.
- I have heard of it.
- I have talked about it.
- I have read about it.
- I have studied it in a course.
What is the greenhouse effect?
What can cause an increase or decrease in sea levels?
In what grades/courses, if any, have you learned about global climate change?
- Elementary school
- Middle school
- High school
- College
- What questions do you have about global climate change?
Initial responses are typically vague, and later responses often demonstrate general understandings. With a quick glance through responses, instructors can identify any aspects they need to address clearly in class. Many students indicate that they have learned about climate change during early schooling, but few provide details. Students typically indicate biology when noting a course at the high school or college level; some mention geology or environmental science. Most students’ initial and later questions indicate interest in learning more about global climate change or express concerns such as “What does it mean for the future of our Earth?”
Exploring the greenhouse effect
A helpful way to assess students’ thinking in progress is to engage them in creating visual displays that represent their developing understandings. By glancing at such creations while briefly checking in on small groups, instructors can gauge issues that need to be addressed. Students also can learn from one another as they share and discuss their work. Access to an official version can guide students toward scientific understandings while they are in the process of actively formulating and refining their ideas.
When teaching on campus, for example, Elizabeth invited students in small groups to share what they already knew about the greenhouse effect by working together on large whiteboards to create diagrams representing their initial understandings (van Zee & Gire, 2020, Figures 4.12–4.14). Next, she brought the small groups together in a circle to present their diagrams and to ask questions and offer suggestions to one another in respectful ways. Then she sent the groups back to their tables to consider how they wanted to enhance their greenhouse effect diagrams based on what they had seen and heard. After several rounds of these collaborative conversations, she engaged the whole group in interpreting a diagram prepared by the IPCC (2007, Frequently Asked Question 1.3) to represent the greenhouse effect.
When teaching the course remotely, Kelby opened a discussion of global climate change with an open-ended question: “What do you think of when you hear ‘climate change’?” The students posted brief phrases representing their thoughts on a digital whiteboard known as a Jamboard so that all students could see the range of ideas expressed. Kelby invited pairs to explore the greenhouse effect via a computer simulation created by the Physics Education Technology Interactive Simulations project (PhET, n.d.) at the University of Colorado Boulder. Each pair then worked together remotely to make a diagram on a Jamboard to explain what they had learned about the greenhouse effect. Pairs became aware of their evolving ideas as they created their visual representations, while the instructor became aware of any ideas needing refinement. Such interaction of partners in pairs as well as with other pairs and the instructor can enhance a sense of community among widely dispersed individuals.
Examining evidence of increasing mean global temperatures, rising sea levels, and melting glaciers
One way to develop a sense of community is to guide students in using a particular process in increasingly complex contexts. Starting in Unit 2, for example, we ask students to interpret line graphs by asking the following questions:
- What does the horizontal axis represent?
- What does the vertical axis represent?
- What do the lines represent?
- What does the shape of the lines imply?
Students first strengthen their skills in interpreting line graphs in an everyday context that is easy to understand: how temperatures change as the students mix various amounts of hot and cold water together.
In Unit 3, students use these questions to interpret line graphs while developing ideas in a more complex context, exploring why sand is hot and water is cool at the beach when both are warmed by the Sun in the same way for the same amount of time. They learn about differences in a property of materials, specific heat, by interpreting differences in slopes of line graphs representing different increases in temperature for equal masses of sand and water.
In Unit 4, students use the same questions to guide interpreting line graphs representing evidence that the average global temperature has been rising for many decades. Using these graphs, they also learn how to interpret “anomalies” that show changes from a relevant value such as the average global temperature between 1951 and 1980 (NASA, n.d.d).
In addition, students use these questions to interpret and compare a series of line graphs presented by the IPCC (2014, Figure SPM.1) in its AR5 Synthesis Report. The first line graph presents globally averaged temperature anomalies versus time during the period from 1850 to 2012. Students can compare this with three related line graphs: globally averaged sea level change versus time, globally averaged greenhouse gas concentrations versus time, and global anthropogenic carbon dioxide emissions versus time.
The students next use the same questions to interpret a line graph that represents past, recent, and predicted global average sea levels (IPCC, 2013, Figure 13.27). They then apply what they have learned to interpret line graphs for the complex context of cumulative mass changes in melting glaciers versus time in a line graph produced by the World Glacier Monitoring Service (2022, Figure 3) for reference glaciers all over the world. For students who often perceive themselves negatively as users of mathematics and knowers of science, successfully interpreting these graphs together can be an affirming, community-enhancing experience.
Modeling causes of rising sea levels
Exploring phenomena with everyday materials and sharing findings also can affirm a sense of community. In learning about the causes for rising sea levels, for example, students explore the question “What happens when light from the Sun shines on snow and ice on glaciers on land or on icebergs in the ocean?” When we had to move the course online, students were able to use everyday materials at home to compare melting phenomena in two identical low trays (usually frozen dinner trays): In one, ice cubes melted on a flat rock; in the other, the same number of ice cubes melted in liquid water. The students initially filled both trays to the brim; after the ice cubes melted, only the tray that started with ice cubes on the rock overflowed.
As shown in Figure 1, Mackenzie drew three ice cubes sitting on a rock in the tray on the left and three ice cubes already in liquid water in the tray without a rock on the right. Her initial drawings also showed the outline of the trays, their initial water levels, and the dishes underneath the trays. Her final drawings showed “melted, overflowing water” from the tray with the rock on the left; in the tray without the rock, on the right, the water level stayed the same, without overflowing.
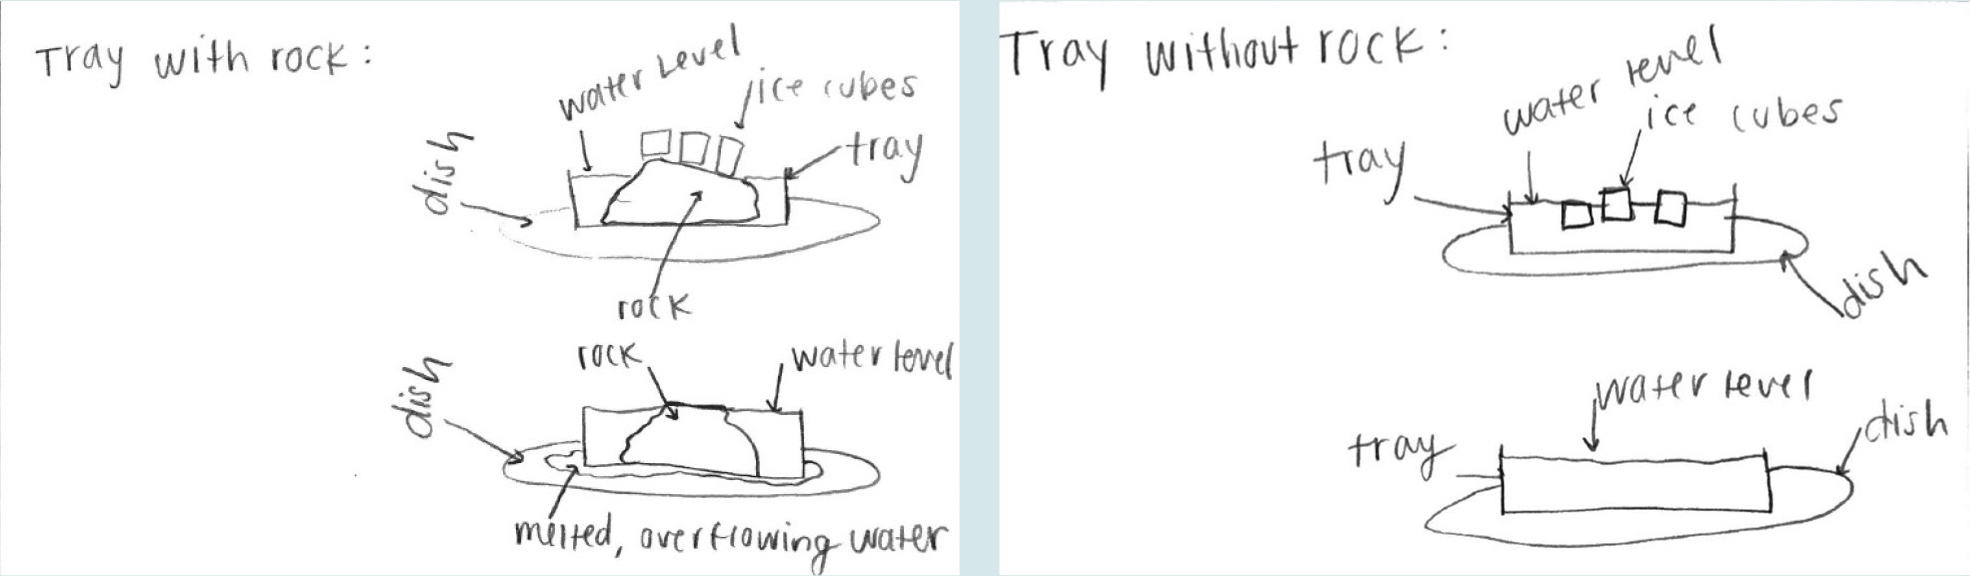
Drawings of the melting ice experiment.
Mackenzie observed, “After … the ice had completely melted in both of the trays, I noticed that the tray with the rock had overflowed. … The water in the tray without the rock had not spilled out and remained at the lip of the tray. For melting ice on land, the water melts and goes into the ocean … and this is what is causing sea levels to rise. … In conclusion, melting ice on land causes an increase in sea levels but melting sea ice does not.”
In Kelby’s remote course, students posted their observations on a Jamboard. They also had a small lab kit that included ball and tube thermometers for their earlier thermal explorations. When they held the balls, they could watch the red liquids rise in the tubes as their hands warmed the thermometers. Satellite data indicate that thermal expansion accounts for about one third of global sea level rise since 2004 (NASA, n.d.c).
Considering ways to take action
An important aspect of teaching about global climate change is engaging students in learning about positive actions that they and others can and are taking to address related issues. During the spring 2021 course, for example, Kelby engaged students in a Padlet activity online in which they looked at various actions being taken, discussed the actions, organized them, and then voted (thumbs-up or thumbs-down) on each other’s boards to start a discussion about climate adaptation and mitigation strategies.
We also invite small groups to share and discuss ways that individuals, communities, states, nations, and international organizations are taking action (van Zee & Gire, 2020, Unit 4.VIII). Students particularly seem to appreciate activities that engage them in estimating their carbon footprints and teaching friends or family members about what they have been learning. Mackenzie, for example, wrote the following reflection:
I talked to my dad about the rising sea levels/melting glaciers and ways to take action after he helped me complete our carbon footprint because we were very surprised by the results. … I enjoyed talking to him about the experiment we did in class with the ice and rock and plastic dishes. I learned that evidence for any topic is a good component to have when you are teaching because it gets people talking and asking questions.
These types of assignments typically provide opportunities for the students to gain confidence as science teachers in supportive contexts. This assignment also conveys information to the public about global climate change and ways to address related issues (van Zee & Crowl, in press).
Making connections to education policies
Many state departments of education have adopted the Next Generation Science Standards (NGSS Lead States, 2013) for guiding science teaching in their public schools. These standards include three dimensions: science and engineering practices, crosscutting concepts, and disciplinary core ideas. In both on-campus and online versions of the course, we close each unit by asking students to make connections between what they have learned in the unit and aspects of these standards. The NGSS explicitly include global climate change among the disciplinary core ideas that students should learn (Earth and Space Sciences 3.D; Appendix E; NGSS Lead States, 2013).
Reflecting on challenges and successes
Like Kim et al. (2021), we consider ongoing formative assessments to be essential for teaching online. Some are well documented, such as responses to the diagnostic questions that open a unit, as well as visual displays that small groups create together. Others occur orally in class as students work with one another in small groups and share their developing understandings during whole-group discussions. Like Palloff and Pratt (2013), we find that such ongoing interactions help build a sense of community as both students and instructor move the thinking forward. Developing common processes with which students can succeed in complex contexts also helps build community, as does having shared experiences exploring phenomena with everyday materials.
Shifting a laboratory-based course to remote meetings was an intense experience for Emily, who taught the course remotely with little advance warning in spring 2020. Challenges included understanding how to run a Zoom meeting (particularly how to use breakout rooms), how to substitute for some equipment only available on campus, and how to create the sense of community that she previously had enjoyed through many conversations with students before, during, and after class.
During the remote version of the course in spring 2021, Kelby enhanced the students’ experiences with a variety of technologies. These included cell phone apps and PhET simulations for exploring phenomena, Google sheets for creating line graphs, Jamboards for sharing ideas, Perusall for critiquing aspects of the open-source textbook, a Canvas discussion board to exchange comments about a topic, and Padlet for collaboratively organizing a discussion. All of these tools enhanced students’ opportunities for interaction and contributed to building a sense of community.
Near the end of each remote “meeting,” the students responded individually in Canvas to ungraded surveys asking the following questions: What was most interesting about what you learned today? What are you still wondering? Their responses provided immediate evidence that some of the intended learning experiences were in fact occurring. These responses also provided an effective way for the instructor to clarify immediately for everyone any confusion about what had just occurred in class or what was expected on the homework. The direct communication from and to individual students via such “exit tickets” has been important for responding to students’ needs and interests.
One positive outcome of moving this course online is that we have developed the resources and confidence to do so intentionally in the future. The students’ responses on an end-of-course questionnaire have been a welcome surprise. Mackenzie, for example, wrote, “This course has made me excited to teach and learn more about science as I become a teacher because I enjoy learning why things happen around me in the world.” From our perspective, increasing prospective teachers’ enthusiasm about science and the exploration process is as important as increasing their understanding of the physics content.
Acknowledgment
Development of the physics course was partially supported by National Science Foundation Grant No. 0633752-DUE. The opinions expressed are those of the authors and do not necessarily represent those of the granting agency.
Emily van Zee (Emily.vanZee@oregonstate.edu) is an associate professor of science education, and Elizabeth Gire is an associate professor of physics, both in the Department of Physics in the College of Science at Oregon State University in Corvallis, Oregon; Kelby T. Hahn is an assistant professor (lecturer) in the Department of Physics and Astronomy at the University of Utah in Salt Lake City; and Mackenzie Belden assists special education students at Point Quest in Folsom, California.
Climate Change Distance Learning Earth & Space Science Teaching Strategies Technology