
Teaching with technology (revisited)
By Mary Bigelow
Posted on 2011-07-25
 In case you haven’t seen it yet, the July issue of Science Scope is themed around technology. We seem to think that technology means new cool tools, but I heard a social studies teacher define it as “the application of scientific knowledge for practical purposes” and “tools and strategies that people use to solve problems.” He was teaching a unit on inventions, comparing the industrial revolution to the digital one. His students compared the telegraph and Morse code to the technology of texting and the “code” used to communicate.
Recently, on Twitter I saw a link to A Tale of Two Worlds: Old School, New School This infographic lists tools used in classrooms over the years from overhead projectors to smart phones.
Although it would be fun to nostalgically stroll down memory lane (I could add 16mm projectors, filmstrips, record players, and mimeograph machines to the list of extinct technologies that I used), it’s more important to reflect on the “practical purposes” that these technologies serve and which comes first—the purpose or the tool?
Do we invent tools to serve a need (doing things better), as in replacing overhead projectors with interactive boards for teacher presentations? Or do we invent a practical use for a new cool tool (doing better things)? I’m thinking of how in a short time iPads and smart phones have found a a place in the classroom as communication tools, as substitutes for other media, and for applications that didn’t exist a few years (or months) ago.
The laptops of today will eventually join the museum, along with floppy disks and VCRs. There is one item on the list that I hope never exists—the robot teacher. Although, if a teacher can be replaced by a robot, perhaps he or she should be! It’s interesting to see the percentage of teachers who have embraced social networking for professional learning and communications—applying a tool to a purpose.
Speaking of social networking, join in on Tuesday evenings (8–9 pm Eastern) to #scichat on Twitter. Last week’s online tweetchat was an amazingly focused conversation on project-based learning in science with many educators sharing their experience and expertise (and links to relevant online resources). #nstachat occurs on a less frequent basis, but the conversations also focus on a specific topic. It’s interesting how these social networking sites have morphed from “here’s what I had for dinner” to highly engaging opportunities for professional communications.
In case you haven’t seen it yet, the July issue of Science Scope is themed around technology.
Assessing inquiry learning
By Mary Bigelow
Posted on 2011-07-22

Table of Contents
This is the latest issue in a well-designed and informative series on inquiry learning. I would encourage secondary teachers to read these issues of Science and Children, especially if you’re new to the idea of inquiry learning or want to see what younger students are capable of. Many of the ideas can be adapted for older students.
Assessment is often an afterthought or something that happens at the end of a unit. As the editor suggests, every assignment can provide evidence of what (and how) students are learning. A formal “test” is not the only tool in your assessment toolkit, and none of the articles here describe how to improve standardized test scores. Rather, they focus on authentic observations, using feedback to choose instructional strategies, and providing useful and appropriate feedback to students. (For example, see Formative Assessment Probes: With a Purpose to differentiate between assessment of learning and assessment for learning.)
As the guest editorial The Changing Landscape of Assessment suggests, “Children, even before kindergarten, are more capable than we ever thought—capable when accessible contexts are used and the classroom environment is geared toward the critique and communication of ideas and information.” What may appear to be play could actually be children’s attempts to explore the world around them. Measuring Learning includes an activity for younger students to explore temperature changes [SciLinks: Systems of Measurement, How Can Heat Be Measured? How Can Matter Be Measured?]
You may have read that traditional “cookbook” labs can be revised into inquiry-based ones. Shifting to an Inquiry-Based Experience provides some suggestions for how to do this, along with a sample investigation in electricity. The authors note that the steps can be implemented gradually as students (and the teacher) become more familiar with inquiry. What causes a charge to move from one substance to another? provides background information for teachers. [SciLinks: Electric Current, Current Electricity, Static Electricity] Whooo Knew? shows how a commonly used activity such as dissecting owl pellets can become an interesting, differentiated project. [SciLinks: Food Chains, Food Webs, Predator/Prey]
Teachers of young children will identify with the author of Capitalizing on Curiosity. He describes his experiences in using what he thought was “chaos” (and haven’t we all had that feeling) to realize that learning was still going on—just not exactly what he thought would happen. By reflecting on the “feedback” from observing and talking with students he gained a better understanding of how they can be involved in inquiry. (Young children seem eager to explore “what would happen if …” I wonder what happens as they get older?) [SciLinks: Buoyancy]
Scientists on a Mission illustrates how studying isopods (aka pillbugs) can be kicked up a few inquiry notches to engage students in making observations, posing questions, and designing an investigation. This could be a good introduction at the beginning of the year to assess students’ previous experiences with inquiry. If the closest your students come to lobsters is at a restaurant, you may have to think of other topics for research as your read The Case of Lobster Shell Disease. The authors provide examples of how they worked on projects with students to investigate a topic of local interest, and they share their tools, rubrics, and advice, including “Assessment of student progress is essential throughout the course of the project, not only to determine what methods work best and ensure that students grasped the concepts but also to continually incorporate student inquiries into the lesson material. [SciLinks: Arthropods]
Don’t be mislead by the title of the article Museum Connections. Although the author is a museum educator, the “connections” she’s making relate to how classroom design can facilitate inquiry learning, curiosity, and independence in young students. The self-assessment checklist (see the Connections) can be used to assess how inquiry-friendly your classroom is. (I’m already thinking of how it could be adapted for classrooms in secondary schools.) The article also describes how several teachers used the checklists to redesign their classroom spaces to accommodate various types of learning experiences
Feed Up, Feedback, Feed Forward may sound confusing, but all three processes were used in a kindergarten lesson on conservation, with a focus on composting. The authors define and describe the terms. Feed up—what’s our purpose? Feedback—how are we doing? Feed forward—where do we go from here. The sample rubric is very student-friendly and could be adapted to other projects [SciLinks: What Is Conservation, Composting, Decomposers]
And check out more Connections for this issue (July 2011). Even if the article does not quite fit with your lesson agenda, there are ideas for handouts, background information sheets, data sheets, rubrics, and other resources.
Be sure to follow S&C on Facebook and NSTA on Twitter @NSTA.
Table of Contents
Scientifically creative
By Mary Bigelow
Posted on 2011-07-18
 I’ve been reading about the revised Bloom’s taxonomy, with “creating” now being at the top. The examples I saw for this level included things such as posters, puppet shows, songs and dances, or skits. These may be enjoyable for younger students, but I can’t really see my high school chemistry students spending time on these. How can older students be creative in science?
—Joseph, Des Moines, Iowa
First, a little background—Bloom’s Taxonomy was an attempt to describe and classify thinking behaviors into levels of complexity. The cognitive domain taxonomy became part of the common language of teaching: knowledge, comprehension, application, analysis, synthesis, and evaluation. A lesson’s learning goals, objectives, and activities could be matched up with the levels, with the latter three being considered “higher-order” thinking
The taxonomy was revised a few years ago to reflect changes in what is known about learning and thinking. Comparing the two versions side-by-side, there are a few differences. The levels are verbs rather than nouns to signify the learner’s activity and synthesis in the original taxonomy has evolved into creating in the revised one. (See the list of references for more discussion).
In this taxonomy, creating goes beyond the traditional fine and performing arts. Some of the actions associated with creating include assembling, constructing, composing, inventing, reorganizing, revising, designing, developing, formulating. The products could include presentations, experiments, inventions, projects, written documents, videos, or the performances that you mentioned in your question. With that interpretation, it’s easier to see how creativity and science can be connected.
Problem solving is a form of creativity, especially if a new solution requires innovative thinking. When you ask students to design an investigation, they are creating. If students come up with a novel solution to a task, they are demonstrating their creativity. If students ask “what if…” or make imaginative connections to other topics or subject areas, they are thinking creatively. But don’t write off things like skits, songs, or videos—your students may enjoy composing these, especially if they can share them with others. You can provide guidance so the science content is emphasized. I once observed a biology class in a high school for the arts. The students amazed me with how they connected their artistic interests to their learning in science.
Technology has added more ways for students to address Bloom’s levels of thinking—from remembering to applying to creating. In the article, “More Than Just the Technology,” in the July 2011 issue of Science Scope, Kimberly Lightle poses the question “How do we provide meaningful learning experiences for students using tools that are intrinsically motivating?” She looks at each level of the taxonomy and how digital tools can enhance thinking and learning.
Even if students are using these tools, are we encouraging creativity if students are required to produce an identical product or come up with the same answers? I’ve found students accustomed to being told exactly what to do or given a template for every assignment may have some initial concerns when the directions are minimal. They may be unsure of whether they’ll be “right” or if their ideas will be acceptable. You’ll need to model creative processes and encourage academic risk-taking. Some of the most creative students I had were not necessarily the “top” students in the class. Students focused on grades seemed to be more hesitant about trying something different or open-ended. I revised my project rubric, leaving the “A” level blank. To earn an A, students needed to explain what they did to personalize the project beyond the required components. It took a while for them to catch on, but it paid off when a student said, “I’d like to try a different way. What do you think?” I thought so much of his way, I integrated it into my graduate thesis.
Additional resources:
Graphic: http://edorigami.wikispaces.com/Bloom%27s+Digital+Taxonomy
I’ve been reading about the revised Bloom’s taxonomy, with “creating” now being at the top. The examples I saw for this level included things such as posters, puppet shows, songs and dances, or skits. These may be enjoyable for younger students, but I can’t really see my high school chemistry students spending time on these. How can older students be creative in science?
Teaching with technology
By Mary Bigelow
Posted on 2011-07-15
 Back in the 1990s, when I was a technology director, a school board member asked me “What technology should our students use to prepare them for the workforce?” I responded that what our current elementary students would use in college or the workforce had not yet been invented. The best way to prepare students for the 21st century (we still hear that term, but the century is now 10% over!) is not to train them in specific applications but to ensure that students have (and use) basic literacy and mathematical skills, opportunities for collaboration and communication, strategies for self-directed lifelong learning, and opportunities for problem-solving and creativity–in a variety of contexts, including science, with teachers modeling the skills themselves.
In a response in NSTA’s biology listserve, Andrew J Petto suggested that although students might be digital natives, in many cases they are also digitally naïve end-users–believing everything they read online, for example—and need guidance to channel their skills into critical thinking and creativity. (and perhaps courtesy? See eEtiquette) for “guidelines for the digital world.”)
The articles in this issue demonstrate that teaching with technology is different from teaching about technology from data collection to assessment to communication to A Field Trip Without Buses. For example, Using Technology in the Classroom describes a teacher’s adventures in incorporating technology into her lessons, taking advantage of simulations, podcasts, animations, and communication tools. She notes that she started by infusing technology into a familiar lesson, rather than trying to do everything new at once—smart advice.
An authentic way of incorporating technology into science investigations is through the many citizen-science projects. In these regional and nationwide projects, participants record observations in their own communities and upload data to a project database. Students get to see “their” data used as part of a larger project and are encouraged to pose their own research questions and communicate with other data-collectors and researchers.
- Who knew that cloud-gazing could be a research project? Cloud Study Investigators describes how NASA’s Students’ Cloud Observations On-Line (S’COOL) project can be used as an ongoing classroom research project. The project uses online resources and engages students in real-time data collection and analysis that is shared with NASA. [SciLinks: Clouds]
- The authors of No matter the weather, we’ll measure together use local data to engage students in weather studies, incorporating classroom technology for collecting, analyzing, and presenting data. They make the point that students may need guidance and modeling to come up with questions and with data collection strategies. [SciLinks: Collecting Weather Data, Forecasting the Weather, or use weather as search term for more concepts].
- Engaging Middle School Students with Technology explores the instructional value of real-time data collected by and accessible through online technology. The authors describe a stream-monitor project and provide a list of sources for real-time and archived data. [SciLinks: Water Quality]
- NOAA has been a real advocate in terms of making authentic data available in a student- and teacher-friendly manner. The article Exploring Seafloor Volcanoes in Cyberspace shares how NOAA’s Ocean Explorer website can link students and scientists. [SciLinks: Ocean Floor] I must admit that the resources from NOAA are a personal favorite, including the Data in the Classroom project that guides teachers and students through “levels of scaled interaction.” In other words, each module has five levels of lessons ranging from teacher-presented ones through letting students explore the data to full-blown problem solving and invention. Each module shows the associated data in a variety of formats and guides the users through how to interpret it. There are “checkup” questions throughout, and teachers can download the materials. The topics include El Nino, Water Quality, Sea Level, and Ocean Acidification.
- Other projects involve students and teachers in authentic research. The Cornell Laboratory of Ornithology has several ongoing projects related to birds. The article Using Citizen Scientists to Measure the Effects of Ozone Damage on Native Wildflowers in the April 2010 issue of Science Scope describes an air quality monitoring project. In Project BudBurst and MonarchWatch participants chart their observations and share with a community of researchers. Wouldn’t it be wonderful if every year students were involved in one of these ongoing projects?
Twenty Ways to Assess Students Using Technology suggests some online tools as alternatives to paper-and-pencil assessments. The list looks a little overwhelming, but many of these tools are quite simple (and many have a free version). The full table in Connections has the URLs. I suspect that students could figure them out quickly and help others (including teachers) to learn. The teacher could provide suggestions for applying the tool to the learning goals.
Speaking of creativity, what do you do the first few days of school? In addition to going over class rules, discussing our grading systems, and handing out textbooks, many teachers also engage students right away in a hands-on investigation. This gives the teacher an opportunity to assess students’ levels of inquiry skills and their ability to work together. An activity such as It’s (zipped) in bag could be used or adapted for this. The 5E investigation uses simple materials (zip-lock bags) as a springboard for inquiry and engineering principles.
Check out the Connections for this issue (July 2011). Even if the article does not quite fit with your lesson agenda, this resource has ideas for handouts, background information sheets, data sheets, rubrics, etc.
And be sure to follow Science Scope on Facebook and Twitter @NSTA
Back in the 1990s, when I was a technology director, a school board member asked me “What technology should our students use to prepare them for the workforce?” I responded that what our current elementary students would use in college or the workforce had not yet been invented.
Five reasons we love science
By Claire Reinburg
Posted on 2011-07-14
Summer can be a time of rest and renewal and an opportunity for teachers to fit in professional pursuits like reading that new book, taking a workshop, or conducting an in-depth study. In the July 2011 issue of NSTA’s Book Beat, we invite readers to take a step back to reflect and reconnect with a few of the many reasons to love science and science teaching. Click over to read the full July issue, where you can also download this month’s free lessons and chapters.
1. Science Has Stories
Stories can be wonderful teaching tools, and science has stories galore—from children’s books about science to case studies by scientists. Children’s trade books linked to science have the power to draw students in to explore, question, discuss, and investigate. Karen Ansberry and Emily Morgan’s Picture-Perfect Science Lessons (grades 3–6) presents powerful strategies for connecting reading and science in a natural way in the elementary classroom. “Dr. Xargle’s Book of Earthlets” engages students through reading a children’s book that has memorable and sometimes hilarious examples of inferences versus observations. Students then practice those skills through several hands-on activities. For grades K–8, Richard Konicek-Moran’s Everyday Science Mysteries presents students with stories about a mystery from everyday life that science can help them solve. “The Little Tent That Cried” helps students see the water cycle in a natural situation and then suggests activities to give them a deeper understanding of evaporation, condensation, and humidity. Start With a Story: The Case Study Method of Teaching College Science, edited by Clyde Herreid, is chock full of case stories that will engross college students, including “Of Mammoths and Men: A Case Study in Extinction.”
2. Science Has Mysteries
Students of science often start delving into a topic after encountering a puzzling or confusing event. Everyday Science Mysteries books use perplexing everyday events to engage students and invite them to investigate what’s going on in the “story.” The baffling and the unfamiliar can intrigue students and spur them to take on the role of investigators. In “Exploring the Mysteries of Fingerprints” from John Eichinger’s Activities Linking Science With Math, K–4, students use investigative techniques to identify and classify their fingerprints based on shape before they collect and classify fingerprints from classroom surfaces after predicting likely locations. A biology mystery from Thomas O’Brien’s Even More Brain-Powered Science titled “Resurrection Plant: Making Science Come Alive!” has students observing and studying a “resurrection plant” to investigate why these dry-looking, fernlike plants appear to come back to life when placed in water. The discrepant events in all three books of the Brain-Powered Science Series are sure to motivate the sleuths in your class.
3. Science Can Make Us Laugh
Using humor in science teaching can be a good way to lighten up the classroom atmosphere while still keeping the focus on learning goals. Take a cue from NSTA Press author Bill Robertson, who artfully weaves humor and serious science content in his Stop Faking It! Series. You’re always in for a treat with a Stop Faking It! book, and now there are nine to choose from. From Robertson’s irreverent humor interspersed among the solid science explanations and activities to clever cartoons by illustrator Brian Diskin, you can laugh your way to better understanding of physics from Force and Motion to Chemistry Basics. Check out “Round and Round and Round in the Circle Game” from Force and Motion: Stop Faking It! for text and illustrations sure to give you a chuckle or two. Or explore the ingenious “Metaphysical Illustrations” by award-winning artist Tomas Bunk in Quantoons (grades 9–12), by Arthur Eisenkraft, and Larry Kirkpatrick. The book combines challenging physics questions with intricate drawings in a collection of problems that ran in Quantum magazine. Feast your eyes on the clever text and art in “Fun With Liquid Nitrogen” and “Laser Levitation.” It’s good to laugh while you learn!
4. Science Challenges Us
Science teachers love the challenge that studying science brings, from exploring a nearby stream to pondering the significance of the latest fossil finds from Colorado or China. Crafting just the right lesson for the group of students in your classroom is another challenge that science teachers take on every day. For an inspirational read on how one talented teacher approaches this challenge, read Cary Sneider’s chapter on “Examining Students’ Work” from J Myron Atkin and Janet Coffey’s Everyday Assessment in the Science Classroom. You’ll come away from this thoughtful piece with new insights about course adjustments you could make that will enhance you and your students’ learning experiences.
5. Science Is Everywhere
In her classic teacher resource Ten-Minute Field Trips, Helen Ross Russell writes that “youngsters who learn to ask questions, observe, set up possible answers, experiment, keep records, and think independently will grow up finding life challenging and worthwhile. They will also have the ability to adapt to a changing world.” Science teachers help children see that science is all around them and that even the smallest patch of grass or pavement can reveal volumes about their world. To reconnect with your inner explorer and consider new ways to use the school grounds as a teaching laboratory for young scientists, read Russell’s chapter “Of the Value of Saying ‘I Don’t Know.’” Check out the free sample chapters of Schoolyard Science, Inside-Out, and Outdoor Science for more practical ways you could incorporate brief outdoor treks into your science lessons.
Summer can be a time of rest and renewal and an opportunity for teachers to fit in professional pursuits like reading that new book, taking a workshop, or conducting an in-depth study. In the July 2011 issue of NSTA’s Book Beat, we invite readers to take a step back to reflect and reconnect with a few of the many reasons to love science and science teaching.
Connecting with families over the summer
By Peggy Ashbrook
Posted on 2011-07-12
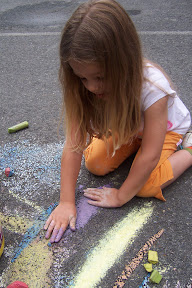 At the end of the school year I gave each preschool student’s family (about 58 of them) a note and a self-addressed stamped envelope in the hopes that they would write to me to let me know about any explorations their child experiences over the summer. Any exploration—deconstructing chalk on the driveway, blowing bubbles on the back step, discovering an anthill in the park, or digging for “fossils” at a museum—because the information will be useful to other families, and a record of what young children can do and learn about human-made and natural places in the world.
By asking them to fill out the following information and mail it to me, I hoped to inspire the parents to talk with their children, and have the children reflect on their experiences.
Summer Exploration Passport Page by _____________________________
Where did you go? List the name, address and website for this location, or just let your child describe it.
What did you see, hear, smell and touch? Write and draw about your experience.
Is there anything you would like to know? I would like to find out….________________.
I put the pages in a notebook for all families at this parent-run cooperative preschool. It’s a way of collecting family natural science experiences as told by young children to share with, and inspire, others.
So here it is, a month later, and I have two entries:
One child (dictated to a parent) said that she went to a Market in the city and saw cool hats and sunglasses, lots of dogs, held her nose when she went by the “really bad smelling fish”, saw pretty flowers and ate good hot dogs. She advised that one should wear a hat because it gets hot.
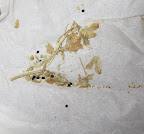 The other sent a flower, wrapped up in tissue, for me to help her identify. Unfortunately the flower body had dried and crumbled. Other than looking very pale in color I had no clue. Fortunately, there were seeds. So I planted them, wrote back suggesting that she check a flower identification book at the library to see if she can find her flower, and that I would let her know if anything grows.
I wonder if any other families will send me a page describing their explorations. Do you think an email letter halfway through the summer would get more responses? Should I send an email with a photo of something interesting I’ve seen this summer and ask adults to share it with their children?
Peggy
At the end of the school year I gave each preschool student’s family (about 58 of them) a note and a self-addressed stamped envelope in the hopes that they would write to me to let me know about any explorations their child
Bell-to-bell learning
By Mary Bigelow
Posted on 2011-07-10
 I was recently at a workshop where the presenter used the term “bell-to-bell teaching.” As a student teacher, I was embarrassed to ask what this means.
—Cory, Mobile, Alabama
Teachers can’t control the length of the class periods, but they can control how they use the time they have. The goal should be to maximize the learning time, from the beginning of the class period to the end (bell-to-bell). When I first heard of bell-to-bell teaching, I worried some teachers and administrators might infer teachers should “perform” or take center stage for the entire class period. This seems at odds with the idea that class activities should focus more on what the students are doing. (It also sounds exhausting.) As I reflected on this, bell-to-bell learning made more sense to me.
All class activities should relate to the learning goals of the lesson and ultimately to the theme or big idea of the unit of study. Consider how time can be diverted away from learning:
- At the beginning of each class period, the teacher takes attendance, returns papers, and collects assignments. He expects the students to wait quietly in their seats until he has finished, sometimes taking as long as 10 minutes.
- In the middle of a class period in which students are engaged in a science activity, the principal announces the winners of a school contest or election via the school’s public address system. It takes the teacher a few minutes to get the students’ attention focused back on the activity.
- The teacher returns a test. She reads each question and provides the correct answer with no discussion. She then announces there is not enough time left in the period to start the next unit, so she tells students to use remaining 20 minutes as a study hall.
Teachers can help students take responsibility for using class time purposefully to meet the learning goals through guidance and modeling. One method I found effective was to post an agenda. When the students came into the lab, they knew what the learning goals were, what activities they were going to work on in class, what needed to be turned in, and what materials they needed (pencil, science notebook, paper, textbook, etc.).
Bell-ringers are brief activities used at the beginning or end of the class period to engage the students and focus their thinking. For example, at the beginning of the class when students enter the room, they could answer a question about the previous lesson, read a brief description of the upcoming activity, or use their notebooks to respond to a visual prompt or current news item. This gives the teacher time for taking attendance or checking homework. During the last few minutes of class, students could write a summary or a brief response to a question for the teacher to check for understanding. This also gives the teacher time to scan the room to make sure lab materials are cleaned up and put away. These exit activities get students to focus and reflect, instead of dashing from the end of one class to another without “packing up” their thinking. For more examples of bell-ringers, see my blog post, Activities Get Students Focused
Transitions between activities can also be a source of down time. Class routines can help students to stay on task. For example, students should have routines for cleaning up after a lab activity, turning in assignments, and moving between group work and large-group activities.
Interruptions and distractions are also obstacles to bell-to-bell learning. Cell phones or other devices should be turned off, unless they are being used as part of the lesson. Teachers often can’t do much about school-wide announcements, but you and the administrative staff could discuss how to communicate without unnecessary interruptions.
The day before a long break can be a challenge, too. Rather than a study hall or video, students might enjoy vocabulary games, a discussion of current events, or a lab activity.
When we complain our curriculum has too much to “cover,” why would we give up valuable class time for study halls, videos unrelated to the curriculum, coloring pages, or other busywork? Let’s make every minute count for learning, from the first bell to the last.
Photo: http://www.flickr.com/photos/ms_sarahbgibson/1266617074/
I was recently at a workshop where the presenter used the term “bell-to-bell teaching.” As a student teacher, I was embarrassed to ask what this means.
—Cory, Mobile, Alabama
Science on a shoestring
By Mary Bigelow
Posted on 2011-07-07

Click here for the Table of Contents
Many of us can appreciate the theme of this issue. As a science teacher, I often wondered what it would be like to have a substantial budget for science equipment and materials. But as the authors of these articles show, science isn’t just about how much “stuff” students use, but rather how they think using whatever is available.
I was reading this issue at the beach, so when I came to the article A Scientific World in a Grain of Sand I had a laboratory right at my feet! The article has some great suggestions for getting started on investigations of this material that is found just about everywhere, incorporating concepts from geology, physics, and chemistry. The website Sand from Pasadena City College has more ideas. If you want to see how an interest in sand turned into a long-term classroom project and lifelong hobby, see the website Communities of Sand. Perhaps you have a sample to include? If you start your own collection, try putting a small sample on a piece of clear contact paper and seal the sample with another piece. Students can examine the samples with hand lenses, sort them, or do other activities without spilling the sand into the crevices of your desks or lab tables!
On another beach/pool thread, Chromonoodles demonstrates how simple materials can be used in making models to help students with difficult concepts. The photographs are very helpful, too. (SciLinks: Chromosomes/Chromatids)
The article It’s Elemental describes an interactive periodic table and activities to guide students through exploring elements and their properties, using 3-D graphics. This would be a terrific resource for students to use on laptops or other devices, as an alternative to print-based periodic tables. (SciLinks: The Periodic Table. You can also search SciLinks for information on individual elements by name.)
In keeping with the theme of this issue, the authors of Simulating Science show how authentic science can be learned using simple materials (a list is provided) and microscale techniques. With these activities, the title could also be “Stimulating” Science. (SciLinks: Diabetes, Kidneys, Kidney Disease, Pathogens)
By the time students get to high school, they may have already done cookbook activities related to making slime. But Hydrogel Beads: The New Slime Lab shows how to extend the activity into an inquiry-based one in which students explore the properties of the material, which I learned has very practical uses. (SciLinks: Polymers)
The “Headline Science” department is not included in the online version of TST, but there are several topics this month that have related topics in SciLinks:
- High-Protein Breakfast (SciLinks: Nutrition)
- Giant Kelp (SciLinks: Kelp Beds, Kelp Forests, Algae)
- New Class of Planets (SciLinks: Tenth Planet, Planets, Galaxies)
- A Better Mouse Model (SciLinks: Depression)
- Gene Packaging (SciLinks: Chromosome, DNA)
- Frozen Helium (SciLinks:Helium, States of Matter)
Be sure to look at the Connections for this issue (July 2011). Even if the article does not quite fit with your lesson agenda, this resource has ideas for handouts, background information sheets, data sheets, rubrics, etc.
And follow TST on Facebook and Twitter @NSTA
Click here for the Table of Contents
EOY activities
By Mary Bigelow
Posted on 2011-07-02
 What can I do on the last few days of school? This year (my first as a teacher), my exams were over, projects were completed, and my grades were turned in. But after that it was hard to keep the students focused.
—Angie, Salt Lake City, Utah.
Time is a precious commodity. It’s hard to understand why some teachers stop their class activities several days before the last day. Everything is packed up and put away, the bulletin boards are down, and students sit around in “study halls,” even though they don’t have anything to study. (Although sometimes packing up before the last day is necessary. When we were changing buildings for a renovation project, we had to have things packed up by the last week for the maintenance staff to move). It’s hard to justify to parents and students why students should come to school on the last days of the year, if all the students do is watch movies, do busywork, talk to each other, or roam the halls.
Here are some learning-related alternatives:
- You could ask them to work in groups to come up with a “guide” for next year’s class—something like The Top 10 Things You Need to Know About Chemistry Class or Physics Class FAQs (and Answers). You could make this open-ended or assign different topics to the groups (e.g., lab safety, study skills, lab procedures, difficult topics, or how to use a science notebook). You may need to model a few appropriate ideas before they start. The groups could share and debrief with each other. This could also be an informal evaluation survey, since you’ll get to see what they thought was essential or important enough to share. And be sure to share a composite list with your students next year on a bulletin board or via your website or blog.
- Try out a new technology tool with the students. For example, lino is a web-based communication system mimicking sticky-notes on a bulletin board. The instructor creates a board and shares the URL with students who can post notes on it. Students work in teams using a computer, and can see what others are posting in real time. Then you debrief as a class or in larger groups, with all of the notes visible on screen. TodaysMeet is a Twitter-like application that captures what people are thinking during an event (the backchannel). If you show a video, for example, students can add their questions and comments (140 characters) as they watch. Of course, you can monitor these conversations to follow along and to add your own ideas. Both have a basic free version that requires instructors to log in. I’m sure that students would catch on quickly, and you could decide if this is worth using next year.
- Vocabulary games, such as variations on Jeopardy or Pictionary. Some take a while to create, but a card sort or word splash is easy to put together. In charades, each team creates a pantomime of a vocabulary term or science process (it’s amazing what they can do with mitosis or Newton’s laws). Have a few prizes if you feel the need.
- Lab activities or online simulations you wanted to do during the year but didn’t have time.
- Some teachers give an end of year survey to students and debrief on the results.
Be cautious about having students assist with lab cleanup. You’ll have to supervise both those who are helping you and those who are not.
Keep the last day in mind as you start next year. Take photos or videos of activities and equipment during each unit, and have students write the captions at the end of the year. Prepare surveys and vocabulary activities in advance.
If grades are turned in, it may be hard to get students to participate especially if the whole year focused on points that “counted” for every activity. But I suspect that most students would rather have some sort of planned activity (even though they might grumble about it). In my school, the last day was a half-day to give out report cards and tie up loose ends. So I found the next-to-the last day was the more challenging one.
Photo: http://www.flickr.com/photos/educationsector/4035552050/sizes/m/in/photostream/
What can I do on the last few days of school? This year (my first as a teacher), my exams were over, projects were completed, and my grades were turned in. But after that it was hard to keep the students focused.
—Angie, Salt Lake City, Utah.
Find support and share resources at the Learning Center
By Peggy Ashbrook
Posted on 2011-06-30
As I was packing up materials and readying the classrooms for summer storage I reflected back over the year and thought about the next. Developing an on-going inquiry (or overlapping inquiries because more than one class uses the space at this school) is foremost in my mind. I want to find some resources to share with the classroom teachers (who are with the classes for the entire day) so we can plan together.
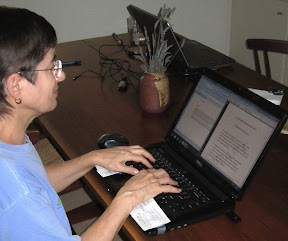 Have you had time to use any of the free resources available from the National Science Teachers Association? I like being a member of NSTA because I get one in-print journal in the mail, and all the archived journals, as well as getting discounts on the books and conference registrations. For those who are not yet members, there is still free access to the NSTA Learning Center (click here) where many of the resources are available at no cost after free registration. The teacher-to-teacher forums are a comfortable place to ask questions and offer answers to questions.
The elementary section includes preK as the youngest end of the preK-to-Grade 2 continuum of early childhood. There you can find new lessons, discuss classroom management issues in science, learn how others develop inquiry in their classrooms, find out about new resources to help you teach science and improve student achievement. Online advisors are available to help you navigate and become familiar with the Learning Center. You do NOT need to be a NSTA member to use many of the resources of the Learning Center including the discussion forums. The NSTA Learning Center is a good place to start preparing for the fall—look for reading material to be ready to teach particular topics and share strategies which worked well for you this past year.
To support your use of online professional development, let your administrators know about research firm Edvantia’s study on online professional development experiences offered by the NSTA Learning Center showing significant gains in teacher content knowledge and student learning among participants from the Houston Independent School District. Results show that the use of SciPacks—interactive web-based modules developed by NSTA and offered through its online Learning Center—significantly increased teacher content knowledge of Earth science and force and motion over the course of the study and gave teachers greater confidence in their ability to teach science.
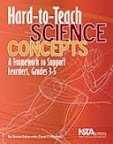 I’m joining the book group started by Kathy Renfrew, Elementary Math & Science Assessment Coordinator at the Vermont Department of Education, to discuss Hard to Teach Science Concepts: A framework to support learners, Grades 3-5 by Susan Koba with Carol T. Mitchell (2011, NSTA Press). (Yes, a little out of my normal range of preK-2 but I see it as a chance to learn what experiences my students in preK should have as groundwork.) I’m especially interested in the chapter, “Understanding Changes in Motion” by Rand Harrington with Susan Koba.
Kathy also began an on-going discussion of teaching physical science to kindergarteners. I’m curious—what has your experience been? Post your ideas or respond to any of the others at at the Force and Motion with Kindergarten thread in Elementary Science forum.
Peggy
As I was packing up materials and readying the classrooms for summer storage I reflected back over the year and thought about the next. Developing an on-going inquiry (or overlapping inquiries because more than one class uses the space at this school) is foremost in my mind. I want to find some resources to share with the classroom teachers (who are with the classes for the entire day) so we can plan together.