
feature
Modeling Energy
Stations to support fourth-grade students’ learning of energy concepts
Science and Children—January/February 2023 (Volume 60, Issue 3)
By Delaney Carone, Ashley Perkins, and Catherine Scott
There is no doubt that science has a reputation for being a fun but challenging subject to teach. Science requires abstract and critical thinking skills that students may not have developed. Naturally, students are concrete thinkers and often have a hard time understanding concepts that they cannot physically see. Due to this, teachers have had to come up with effective ways to teach science concepts. Arguably the most effective way to teach science would be to incorporate modeling into lessons. According to the Framework, “Scientists use models to represent their current understanding of a system (or parts of a system) under study, to aid in the development of questions and explanations, and to communicate ideas to others” (NRC 2012, p. 57). Modeling is a way for students to demonstrate their learning through creation. Models help students visualize and observe concepts.
Energy: Speed, Potential, and Kinetic Energy
This lesson focuses specifically on teaching concepts of speed and its impact on energy, as well as providing a basic introduction to potential and kinetic energy to fourth-grade students. Next Generation Science Standards 4-PS3-1 states that students should be able “to use evidence to construct an explanation relating the speed of an object to the energy of that object” (NGSS Lead States 2013). Our lesson connects to the NGSS crosscutting concept energy and matter, which states that the transfer of energy can be tracked as energy flows through a designed or natural system.
Energy comes in many forms, including motion, light, sound, electricity, magnetic fields, and heat (thermal energy). In this lesson, we chose to focus on motion, or kinetic energy. Kinetic energy is the energy of motion; before that motion occurs, the energy is stored as potential energy (Just Energy 2022). The faster an object moves, the greater the level of kinetic energy held by the object. For example, in a standard spring, potential energy is increased the more the spring is compressed (squeezed together). Once a person lets go of the spring, the potential energy is transformed to kinetic energy when the spring moves. The tighter the compressions (force), the faster the spring goes, and the greater the level of kinetic energy.
This lesson starts off with an introduction and discussion to get students thinking about energy. Starting with discussion questions can also help students build from their prior knowledge and connect personal experiences to their learning. Questions we started with included, “What is energy?” “Can we see energy?” and “How do we know that energy exists if we cannot see it?” These types of questions can also be answered with multiple answers, and they allow the teacher to see a student’s thought process and what they understand or need help with. Students may say that when they have energy, they move. Another common answer that students at this age may give is listing things that have energy such as cars, batteries, and people. Students may present misconceptions where they believe that energy is a magical element that forms from air or electrical currents. It is easy to come up with real-life examples where energy is demonstrated; however, people cannot see energy and students may have a hard time comprehending it.
Engage
For this lesson, we are looking at speed, potential energy, and kinetic energy in real-life scenarios. To start the lesson, we asked students to imagine that they were learning to skateboard or ride a bike (interests of our students). We then showed them two “hills” drawn on the board, one with a slow decline, and the other with a steep decline. We asked the students which hill they would prefer to learn on, and why. Many of the students were adamant that the hill with a slower decline would be the best hill to learn on, “so you don’t get going too fast and get hurt!” We asked them how they knew that someone would get hurt on a steeper hill. The students explained that the faster they go, the harder they fall, and the more likely they to be injured. Some shared comparative examples from playing with their toy cars or video games, where the faster the vehicle, the greater the impact of a collision. We asked the students to consider the relationship between the speed of the object and the amount of energy it possesses. The students shared that they thought that the faster the object, the more energy it would have. We asked the students how they thought they could test their ideas and explained that they would have the opportunity to do so in our stations.
Explore
To explore their ideas, the students were divided into groups of four or five to work in four stations. Before starting, students were given a data collection sheet (see Supplementary Resources) to complete at each station. Students were expected to experiment with how force and speed influence the movement of an object (the amount of kinetic energy). Students spent approximately five to seven minutes at each station, testing their ideas to increase the speed of each object, thus allowing them to use the models at each station to examine cause and effect between speed and energy. At each station, the students drew a diagram of the activity, labeled where they thought the energy was shown at the station, and explained how they manipulated the station to adjust the speed of the object.
The first station was a balloon release. Students were reminded to wear safety goggles as a precaution, and the teacher verified that none of the students had any latex allergies. Students filled the balloon with air with a small pump and held it so that the air did not come out. Students then released the balloon (pointing away from other students). They were encouraged to determine a way they could adjust the speed that the balloon had as it let go of the air (e.g., slowly opening the balloon, filling the balloon with more or less air).
The second station included a toy bow and arrow, as well as a target. Students again donned safety goggles as a precautionary measure and were again instructed to only point the arrow at the target. This station was done just outside the classroom door, in the schoolyard with supervision to ensure student safety, and with a toy bow and arrow with a blunt tip. Students aimed the bow toward a target and released the arrow. As students worked with the toy bow and arrow, they were able to play around with the speed and to test their ideas for how to increase the speed of the arrow. Students in one group noticed that the more they drew back the bow, the farther and faster it would go. Another group decided to test pulling the bow back with their dominant versus non-dominant hand, to see what impact it would have on how far the bow traveled (and found that using the dominant hand resulted in farther travel, as it was easier to pull back the bow).
The third station consisted of a ball on a hill created from a foam insulation tube for plumbing and a marble (Figure 1). Students placed the marble on top of the “hill” and then released it down the track. Students tested the slope of the track to determine how they could increase the speed. They found that as they made the track steeper, the marble went faster, just like the bike riding example shared at the start of the lesson. Another group noticed that if they pushed the marble harder, the speed would also increase.
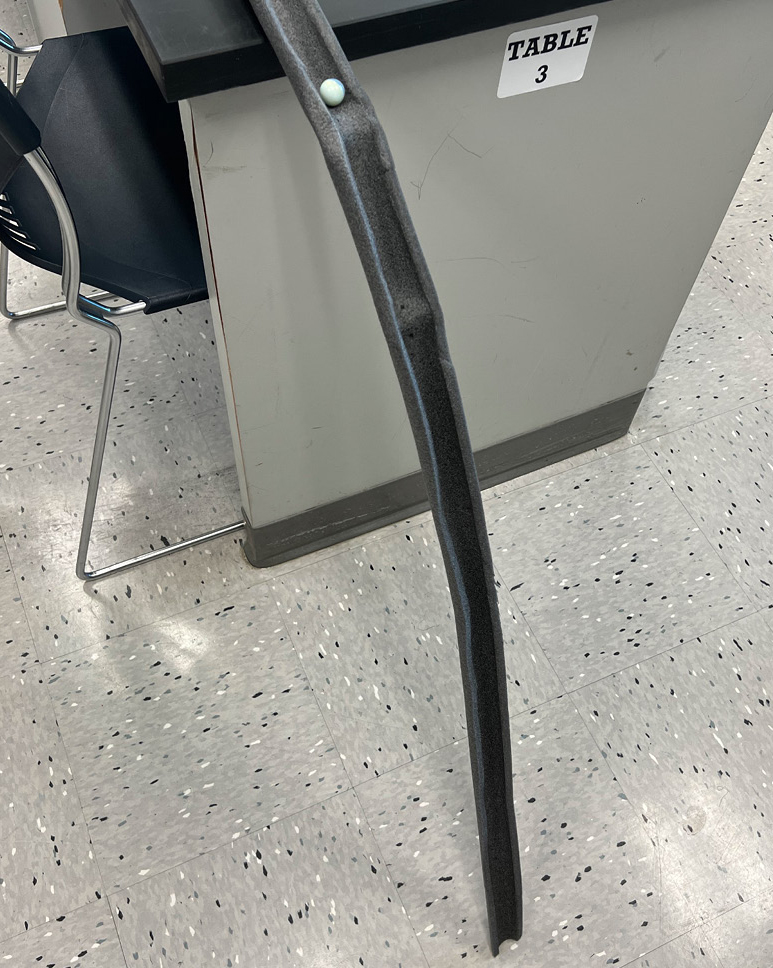
Station 3 setup.
The fourth station was a swinging pendulum (Figure 2). Students created the pendulum with a meter stick, tape, string, and a small weight. The meter stick was taped down between two desks. The string was tied to the meter stick on one end and to the weight on the other. Students pulled the weight toward them and released it, watching the weight swing back and forth. The students were encouraged to test the pendulum to determine how they could increase or decrease the energy. Students tried lowering the weight higher and lower and comparing the two, as well as using more force to push down on the weight, to see how it changed the swing of the pendulum.
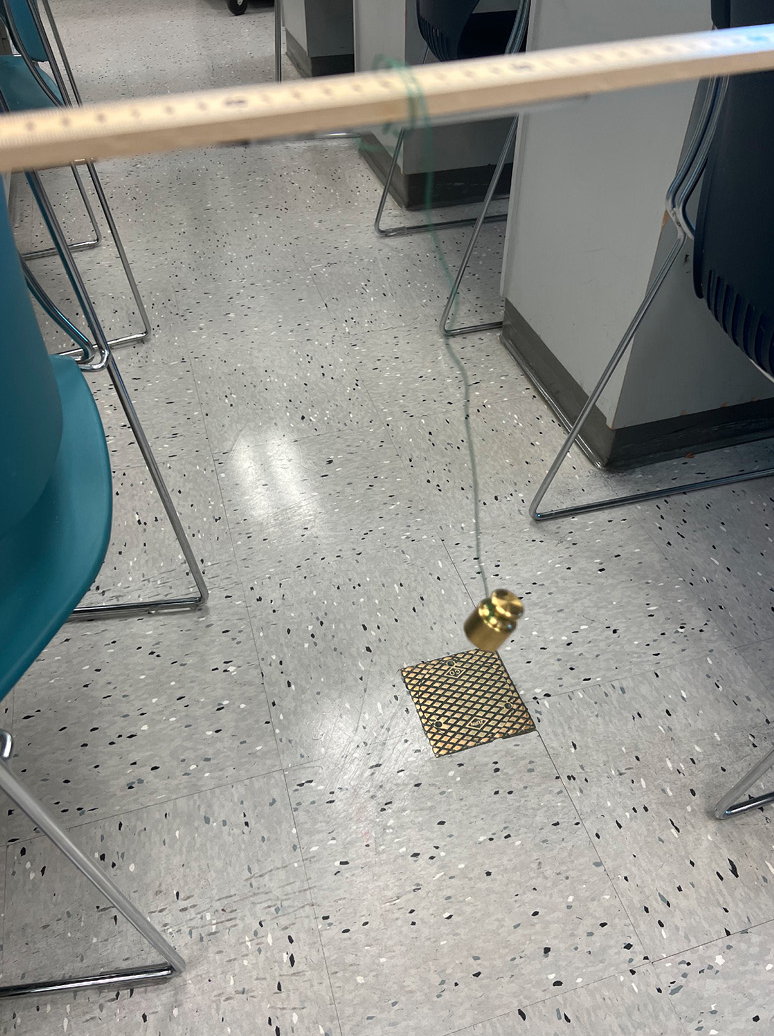
Station 4 setup.
Explain
Once students completed the workstations, we came together as a class to share our findings. Each group was asked to share their observations and the ways in which each group was able to adjust the speed of the objects at the workstations. As groups shared, we informally assessed their abilities to correctly identify the ways in which they could manipulate the objects to affect speed.
We explained to the students that potential energy is energy that is stored, while kinetic energy is energy in motion. We asked them to consider where they were seeing potential and kinetic energy in each workstation. Students explained that when holding the balloon filled with air, it had potential energy, and then when they let it go, it had kinetic energy. With the bow and arrow, potential energy could be found when the bow was pulled back, and kinetic energy was found as it released and moved through the air. For the hill station, when the marble is at the top of the hill, it has potential energy, and when the marble is released, it has kinetic energy. Students explained that when holding the weight, it has potential energy and when they release it, it will have kinetic energy.
Next, we asked the students to consider the relationship between energy and their attempts to adjust the speed of the objects at each station. For example, the students shared that when the balloon was completely full of air before they let it go, it moved faster than when it was only partially filled. Recognizing that the movement was where kinetic energy occurred, the students were able to make the connection that speed increases the [kinetic] energy. Another group explained how in the second workstation, with the bow and arrow, the amount of speed influenced how much kinetic energy the object would possess. They were able to conclude that objects with more energy have more power—the further they could draw the arrow back, the faster and farther it would go, and thus the more energy it had. Another group noted that while they were at the third station, the ball on the hill, they were able to see that the steeper the hill, the faster the marble would roll down, which increased the kinetic energy in the marble, and if they flattened the hill more, the marble would go slower, thus not having as much kinetic energy. Finally, students explained that when the pendulum is released from a grander height, it will have more speed, and therefore energy, than it would from a lower height.
Elaborate
After students had the opportunity to examine energy using the stations, we took students outside to find more real-life examples in one of their favorite locations—the playground! Students were asked to identify as many places as they could see potential and kinetic energy and to record their findings on the second page of their data collection sheet. Students noted locations such as the swings, the slide, and where kids were playing four-square. Additionally, students were required to take pictures of one site through multiple stages—for example, a student at the top of the slide (potential energy), going down the slide (kinetic energy), and sliding quickly and slowly. The students were encouraged to see how speed affected energy levels. For example, when students pushed the ball harder, it moved faster toward their opponent in the four-square game. After collecting their data, students brought it back inside to work on a poster demonstrating their understanding of energy. Students were provided posterboard, markers, and other art supplies such as glue and stickers to create their posters.
Evaluate
To assess student learning, the student posters were graded using a rubric (see Supplementary Resources). On this poster, students were required to include pictures that they took from the outdoor activity (their model) and to explain how energy and speed were used in the model selected from the playground. They also were expected to include definitions of kinetic and potential energy. For example, the group that looked at motion on the slide explained that potential energy occurred at the top of the slide, before a group member slid down, and that kinetic energy happened as the students was sliding. They included their photos of the student at the top of the slide and midway down the slide, labeling each (potential, kinetic, and potential, respectively). The students’ poster noted that the faster their peer went down the slide, the more energy that the student had. They also chose to add some “helpful recommendations,” such as sharing that they thought it was better to have more energy and go quicky down the slide on a hot day, so as not to be too uncomfortable!
While working, students were provided with copies of the assessment rubric so that they would know exactly what is expected of them. Our class worked on this project for three days. They researched and started making a poster or model one day and finished it the next two days. However, you can adapt the project requirements and length to your own classroom.
Conclusion
The experience students will get out of this lesson and its many components will allow them to fully process and understand the differences between kinetic and potential energy as well as the transfer of energies. This lesson hones in on the importance of using a model, in this case familiar experiences and playground equipment, as a way for students to explain a scientific principal and diagram the phenomena. Students are given an introduction and brief directions before they are sent to the stations where they are creating and manipulating materials to help them visualize and observe scientific concepts. Modeling is a powerful method for teaching science concepts to children, and in this lesson on energy, it has proven to be very effective in supporting student success.
Supplementary Resources
Download the data collection sheet and rubric at https://bit.ly/3HyWZDe.
Delaney Carone is an elementary education candidate at Coastal Carolina University in Conway, South Carolina. Ashley Perkins is an elementary education candidate at Coastal Carolina University in Conway, South Carolina. Catherine Scott (cscott1@coastal.edu) is an associate professor at Coastal Carolina University in Conway, South Carolina.
Instructional Materials NGSS Physical Science Three-Dimensional Learning Elementary Grade 4