
start with phenomena
Observing the Unobservable
Using multiple representations to shine light on Earth science phenomena
Science and Children—November/December 2022 (Volume 60, Issue 2)
By Jessica McClain, Celeste Nicholas, Katherine Zimmermann, Edward Pierce, Joshua Danish, and Qiu Zhong

Scientists and engineers use evidence to explain and predict phenomena—observable events that occur in nature. The Next Generation Science Standards (NGSS) recommend that the focus of science instruction shifts from learning about topics to learning to explain phenomena (NGSS Lead States 2013). However, phenomena-centered approaches can be challenging to implement. Some aspects of phenomena are complex and not directly observable in the real world. For instance, Earth science phenomena may occur at scales larger and longer than students can observe. The NGSS recommend that teachers support students in interacting with phenomena indirectly, through representations such as physical models, diagrams, gestures/embodiment, or simulations. One representation is rarely sufficient to promote deep understanding of phenomena; students need to use multiple representations and consider the relationships among them (Ainsworth 2006).
In this article, we describe a sequence of lessons incorporating multiple representations within a fifth-grade unit of study on Earth’s place in the universe. This unit occurred in a state that had not adopted the NGSS. However, state content standards aligned closely with the NGSS fifth-grade disciplinary core idea (DCI) about observable patterns in the Earth space system and their causes. Because the DCI requires that students construct explanations on multiple levels, we incorporated representations to target each level and move students toward deeper understanding (Windschitl, Thompson, and Braaten 2018). To support “what” and “how” explanations, we engaged students in observing and explaining patterns, including changes in shadows, day and night, and the position of objects in the sky. To support “why” explanations, students explored the causal mechanism of these patterns: Earth’s rotation.
This unit was developed through a professional development research program funded by the James S. McDonnell Foundation. The Representations for Teachers as Learners (RepTaL) project supports teachers in incorporating multiple representations into science lessons to explain phenomena to understand how teachers think and learn about these instructional approaches. This unit was implemented with 70 students in a combined science class. For each lesson, one teacher took the “lead,” with another in a supporting role. Herein we describe the major activities in each lesson, focusing on overall patterns in students’ sensemaking as they worked with representations.
Preassessment: Introducing the Phenomena (30 min)
The goal of this lesson was to elicit students’ initial ideas about the relationship between Earth and the position of objects in the sky. We contextualized the phenomena in a fictional scenario in which students were “lost” and needed to navigate back to school using objects in the sky: “The class is on a field trip at a wildlife rescue center located a 45-minute drive from school. You are with a group of students who wander off. Before you know it, you are lost and your cell phone is out of battery. You must use objects in the sky to navigate back.”
Students were then asked to represent their initial ideas about the problem in a drawing (Figure 1). For about 50% of students, initial drawings were “what” explanations. Students represented the Sun and stars without reference to observable patterns. Another 50% of responses exhibited “how” reasoning, with students attempting to explain how observable patterns of objects in the sky might be used for navigation. However, we realized that students had limited understanding of cardinal directions, which made it difficult for them to apply that knowledge to the navigation scenario. Those who knew that the Sun rose in the east and set in the west did not necessarily know which direction was east or west on a map. At this point, no students explained these observations in terms of the underlying “why” mechanism: Earth’s rotation.
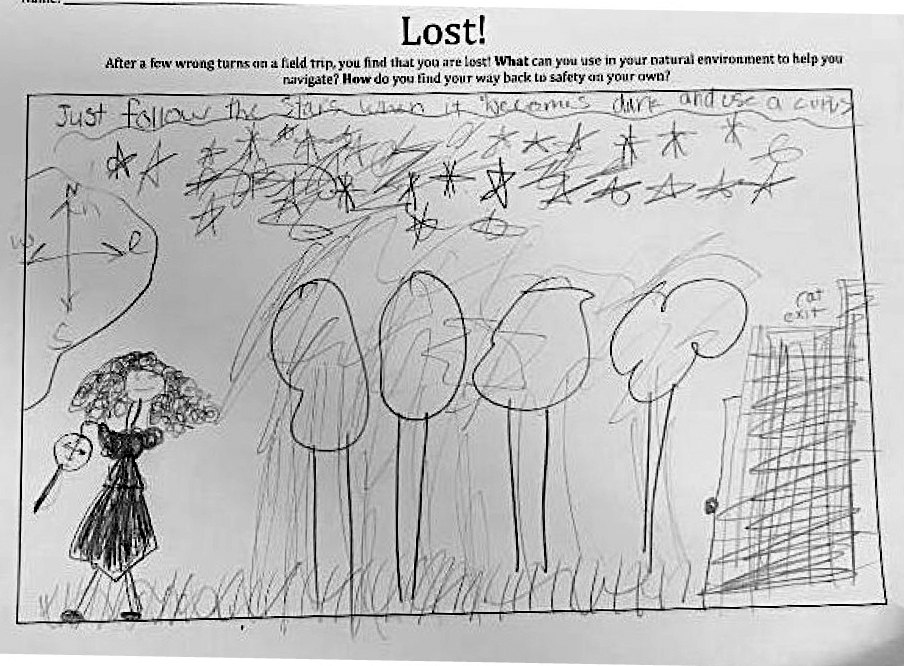
Initial student model.
Representation 1: Physical Model of Shadows (30 min)
The goal of this lesson was for students to investigate the relationship between the position and length of shadows at varying times of day. Although they had a sense that the Sun could help them navigate, students had not included shadows in their initial drawings. In pairs, students were given a piece of paper, a toy “person,” and the lights on their tablets to model the position of shadows at various times of day (Figure 2). To ensure that students could create explanations about shadow position, the teacher introduced the compass rose as a tool for determining cardinal directions. As a safety precaution, the teacher cautioned students about shining the lights in others’ eyes.
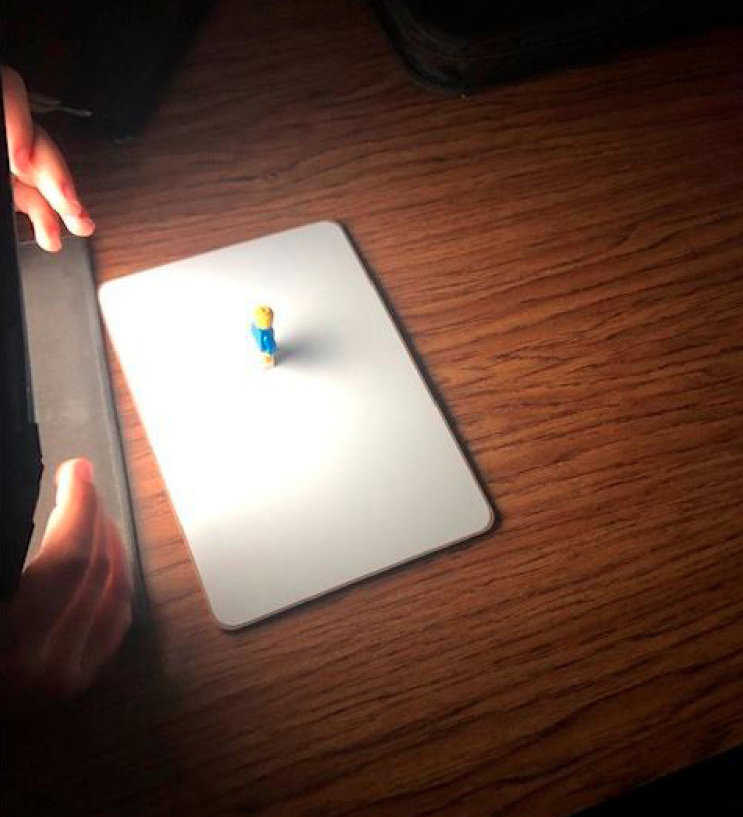
Shadows model.
As students were investigating, they were asked, “Can you explain how you were able to create a shadow?” Students demonstrated how to make shadows of various lengths by moving their tablet lights. When asked, “How can you model a shadow at noon compared to evening?” students could demonstrate both conditions but could not apply this knowledge to how the Sun creates shadows of varying lengths throughout the day.
At the end of this lesson, students applied their knowledge using a summary table (Figure 3). This table scaffolded students in relating each activity with representation(s) to navigation. In this lesson, we looked for responses about how shadows could be used to determine direction and time of day. Throughout the unit, we used the summary table as a formative assessment tool (Windschitl, Thompson, and Braaten 2008).
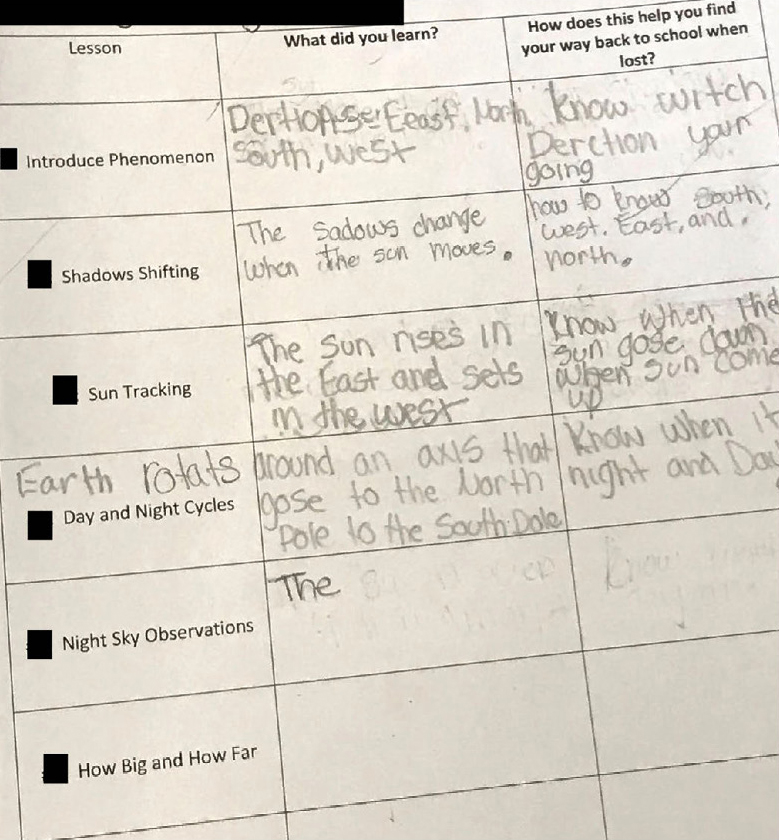
Summary table.
Representation 2: Computer Simulation of Shadows (30 min)
Based on responses in discussion and in the summary table, most students could describe the relationship between a shadow and the Sun’s position (time of day) but struggled with how to use that information to navigate. We sought a representation that would give students further opportunity to explore these connections. We introduced a shadow simulation (Figure 4; see FOSS Shadow Tracker or National Schools Observatoryin Online Resources). The simulation allowed the teachers to adjust the time of day/Sun’s position and display the length of shadow of a 1-meter post. The simulation also allowed us to better represent the relationship among shadow length, direction, and the Sun’s position compared to the physical model. The teacher began by asking students “how” questions about the relationship between shadow length and time of day—similar to those asked about the physical model.
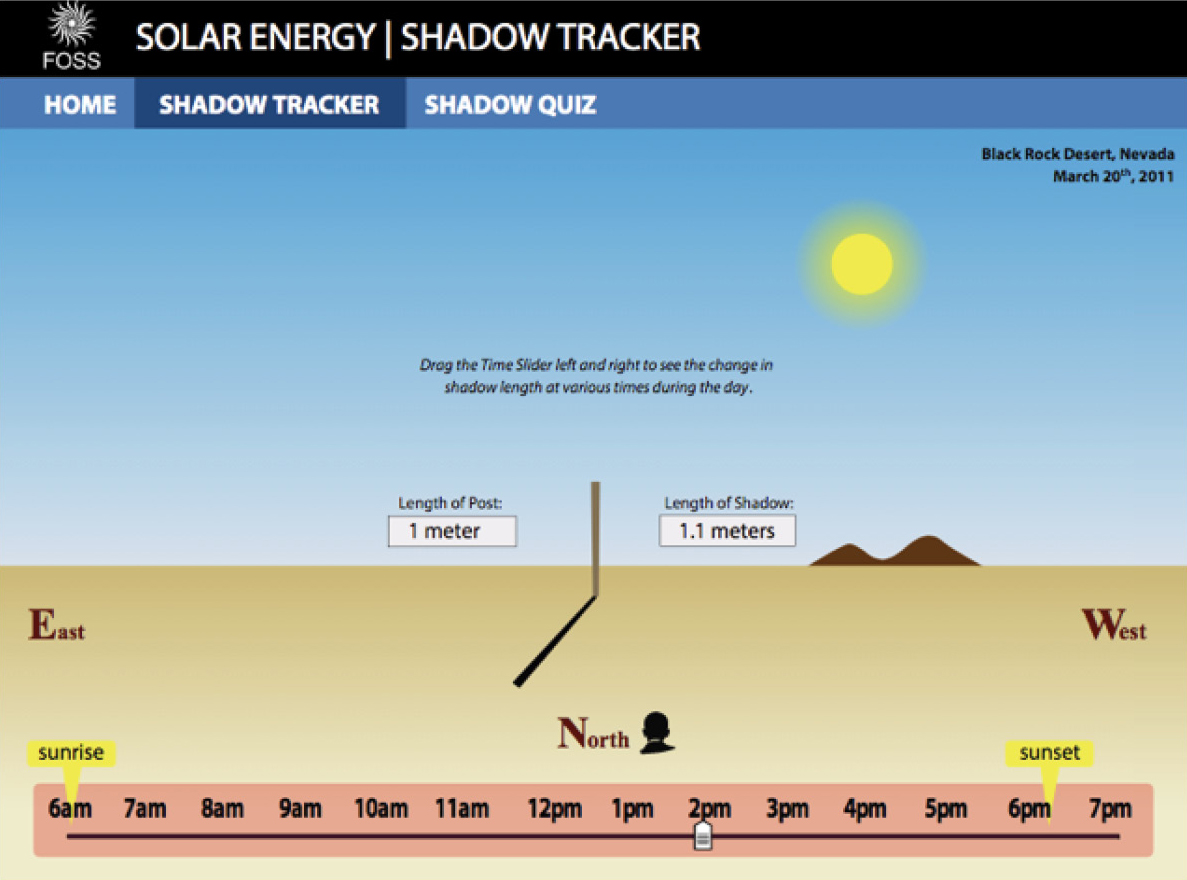
Shadow tracker.
The teacher then supported students in connecting this representation to the navigation scenario. She reminded students that to get back to school, they needed to travel east and asked, “At sunset, you see a shadow. How can you use a shadow to help you get back to school?” The teachers pressed students to justify their thinking as they discussed the question in small groups. For instance, a student explained, “I know the Sun sets in the west, so the shadow has to be east. To get back to school, I need to travel the same way the shadow is pointing.” Students also pointed out that they could navigate using the Sun. As one student said, “To go home, we need to go in the opposite direction of the setting Sun. Because the Sun sets in the west and we need to go east.”
Representation 3: Student Embodiment of Earth (10 min)
To this point, our instruction explicitly focused on building “what” and “how” explanations. Based on class discussions and individual reflections on the summary table, 85% of students were now on the “how” explanation level. Even when “why” explanations were attempted (15%), many students identified the movement of the Sun, rather than Earth, as the cause of shadows and day and night cycles. This was not surprising, as students commonly assume that motion of the objects in the sky, rather than Earth, is the cause of observable patterns.
To target “why” explanations, the teacher introduced an “embodied” representation of the Earth-Sun system. She invited a student to act as a model rotating Earth. She asked students to imagine a north-south axis in the center of the student, with the student’s eyes representing their location on Earth (Figure 5). She explained that she would use a flashlight to represent the Sun and reminded students that although the Sun appears to be moving in the sky, it was actually Earth that was rotating.
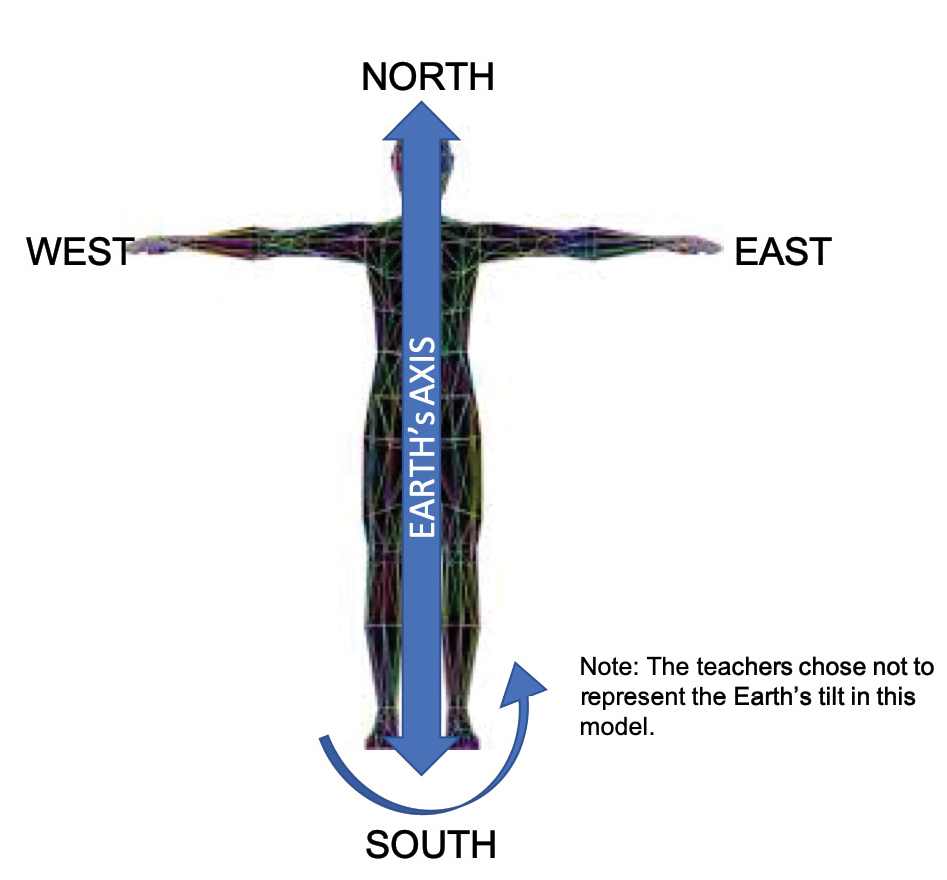
“Embodied Earth” model.
The teacher then led the class in sensemaking about how the movement of Earth could cause observable patterns in the movement of objects in the sky. She first asked, “Where would Earth’s east and west be?” Students identified Earth’s right hand as west and left hand as east. They explained that they knew this because the student’s head represented north. She then asked the student to turn around (looking in the opposite direction of the flashlight) and asked students what time of day this represented. They explained that this position was like midnight. The teacher then asked them to direct “Earth” to move to represent various times of day (e.g., noon, sunrise, sunset). For instance, she asked, “How would Earth move to represent noon?” Students directed “Earth” to rotate counterclockwise a half turn to directly face the “Sun.” Students added to their summary tables based on this activity. Although we did not include this in our lessons, we felt this was a place where students could clarify their thinking about the relationship between the Sun and Earth by writing an explanation of what causes day and night.
Representation 4: Virtual Planetarium
Later in the lesson, we used the free Stellarium planetarium simulation to further support “why” explanations. The simulation models patterns in the position of sky objects at faster time scales than would be directly observable. Users can speed up or slow down time, set a location, change perspectives, and determine which sky objects are visible.
The teacher displayed dynamic and still Stellarium images and supported students in noticing and documenting the patterns in the position of sky objects. She set the simulation to the school’s location, oriented it to face south, and set it to display the Sun and stars. She then set the speed (~1.3 hrs/sec) to allow students to view patterns in the movements of sky objects for several day and night cycles. As the simulation ran, she asked the students what they noticed about the movement of the stars in the night sky. Students noticed that the stars seemed to be moving from east to west. When asked what that reminded them of, they were able to connect that to the westward movement of the Sun they observed in the Sun tracking and shadow shifting activities. Students also noticed they could see the Sun rising in the east and setting in the west in the daytime sky in the simulation.
The teacher pressed students for “why” explanations of these patterns. She asked, “What causes the Sun and stars to change position from our perspective?” Students explained that Earth’s rotation is the cause of all these changes. She then invited another volunteer student to act as an embodied Earth. This time, the teacher stood next to the student holding a “star” wand. She asked how the student Earth should move to represent our view of stars at various times of day. For instance, at midnight, the class directed the student to rotate counterclockwise (e.g., west) to directly face the star. To determine if students had an understanding of why the stars appear to move in the night sky, the teachers added an individual student writing task.
At the end of the lesson, the teachers drew students’ attention to a star that did not appear to move in the simulation, the North Star (Polaris). Students noticed that it remained in the northern part of the simulated sky, while other stars appeared to be moving. As a teacher asked, “Why does the North Star appear to stay in the same place?” another moved her star wand over the student Earth’s head and had the student rotate on an “axis.” Students explained that it doesn’t appear to move because of its position compared to ours on Earth. The teacher emphasized that because of this, the North Star is used to navigate by people in the Northern Hemisphere: it acts like a compass pointing north in the night sky.
Summative Assessment: “How do I get back?”
Students were provided with a series of clues that required them to apply their knowledge from the unit to the scenario of needing to navigate using sky objects. Each student was given a graphic organizer with a map, a compass rose, and instructions. Some clues targeted “what” and “how” explanations, such as, “You look down and see your shadow. Based on its length and direction, you know it’s late in the evening. Travel three squares in the opposite direction.” Other clues required “why” explanations. For example, “While lost, you noticed objects in the sky appear to be changing position, depending on the time of day. These objects appear to be moving because_____.”
Successful students solved all the clues and found their way back. When we looked at this assessment, about 60% of students were able to answer both “why” questions, with the remaining students at the “how” level. Our state standards do not require mechanistic “why” explanations for this grade level; however, we believed it was important to support our students in reasoning at higher levels wherever possible.
Conclusion
We recognize many ways multiple representations supported students’ explanations about Earth’s rotation and the observable patterns caused by it. First, multiple representations made abstract, unobservable concepts more tangible for students. The representations allowed us to support students in moving from “what” and “how” explanations to deeper “why” explanations. We found it important to have a “bank” of representations at various explanation levels that could be implemented flexibly based on ongoing assessments of student thinking. Second, multiple representations served as multiple opportunities for students to engage deeply with the phenomena and made challenging science ideas more accessible. The summary table formative assessment tool supported students in relating each representation to the phenomena and allowed us to assess and respond to students’ evolving understandings. In the future, we plan to further incorporate individual students’ ideas, captured in the tables, as launching points for larger discussions.
We recognize that not all students reached the “why” explanation level, despite us including targeted representations. In response, we plan to have students take a more central role in using and creating representations. Groups of students could decide how to embody components of the Earth and space system and compare models across groups.
Supplemental Resources
Download the Sequence Plan, Summary Table Formative Assessment Tool, CER templates, and “Lost” assessment at https://bit.ly/3ejykjf.
Online Resources
California Academy of Sciences Kinesthetic Astronomy: https://www.calacademy.org/educators/lesson-plans/kinesthetic-astronomy-earths-rotation
Full Option Science System (FOSS) Shadow Tracker: https://www.fossweb.com/studentmoduledetail?dDocName=G3906488
National Schools Observatory - Daytime Shadows: https://www.schoolsobservatory.org/learn/astro/esm/daynight/shadows
Solar System Scope, Night Sky View: https://www.solarsystemscope.com
Space Science Institute, Kinesthetic Astronomy: https://www.spacescience.org/eduresources/kinesthetic.php
Stellarium Astronomy Software: https://stellarium.org
Jessica McClain (mcclaijr@iu.edu) is a doctoral student in science education at Indiana University Bloomington. Celeste Nicholas is a research data analyst in social and behavioral sciences at Indiana University – Purdue University Indianapolis. Katherine Zimmermann and Edward Pierce are STEM teachers at Grandview Elementary School in Bloomington, Indiana. Joshua Danish is a professor of the learning sciences, and Qiu Zhong is a doctoral student in science education, both at Indiana University Bloomington.
Astronomy Earth & Space Science Phenomena Physical Science