
teaching teachers
When Can We See Makali‘i?
Place-based storylines focused on modeling how Earth’s motion causes patterns we see in the sky
Science and Children—November/December 2022 (Volume 60, Issue 2)
By Lori Andersen
We all have our favorite astronomy activities, such as making cookie Moon phase models and marshmallow constellation models. However, the Next Generation Science Standards (NGSS) call for three-dimensional learning that engages students in figuring out how and why phenomena happen, yet many models do not explain the cause(s) of phenomena. Although cookie Moons and marshmallow constellations provide fun, hands-on experiences, they do not help students understand the causes of the patterns students see in the night sky. The NGSS show how fifth graders need to reason about how Earth’s motions cause the patterns in the night sky to be ready for middle school content, such as explaining lunar phases, eclipses, and seasons. In this article, we demonstrate a professional learning experience using a lesson that focuses on the cause of seasonal night sky patterns.
Recently, we partnered with a research and development consortium that includes 20 charter and public charter schools to build a network of schools, educators, scientists, and industry experts that could support and expand the engagement of students of all grade levels in experiential, culturally relevant learning and in conservation action to strengthen their sense of stewardship, understanding of conservation ecology, and relationship to place. Together, we are collaborating to facilitate the development of culturally relevant science curriculum resources, as recommended by the National Academies of Science, Engineering, and Medicine (2021). The activity described in this article was used to help teachers better understand NGSS-aligned storylines.
Patterns in the Sky
Elementary students are fascinated by stars and stories about constellations, but prior to the NGSS, elementary astronomy activities were mainly descriptive and one-dimensional. Students learned about which constellations they can see at different times of year and listened to the stories behind the constellation’s shapes and names. However, those kinds of astronomy lessons do not support students in understanding the causes of those patterns, a grade 5 disciplinary core idea. In grade 5, students use the motion of Earth to explain the patterns they observe, such as the daily and monthly changes in positions of the stars. Students visualize how movements they observe from Earth are explained by the motions and relative positions of the Earth and other celestial objects (Plummer 2017). For example, they see the apparent rising and setting of a constellation from an Earth-based perspective, but to explain it they need to visualize how Earth’s rotation can cause them to see stars appear to move when they are actually moving themselves. In this article, we share a lesson that focuses on students developing their own models to explain how Earth’s motion causes changing patterns in the sky. We used the first lesson from the unit to introduce teachers to some key features of storyline instruction. The professional development activity takes about 90 minutes, and the student-facing version takes about three lessons. Resources for this lesson are in a shared Google Drive folder (see Supplemental Resources).
The Storyline Unit
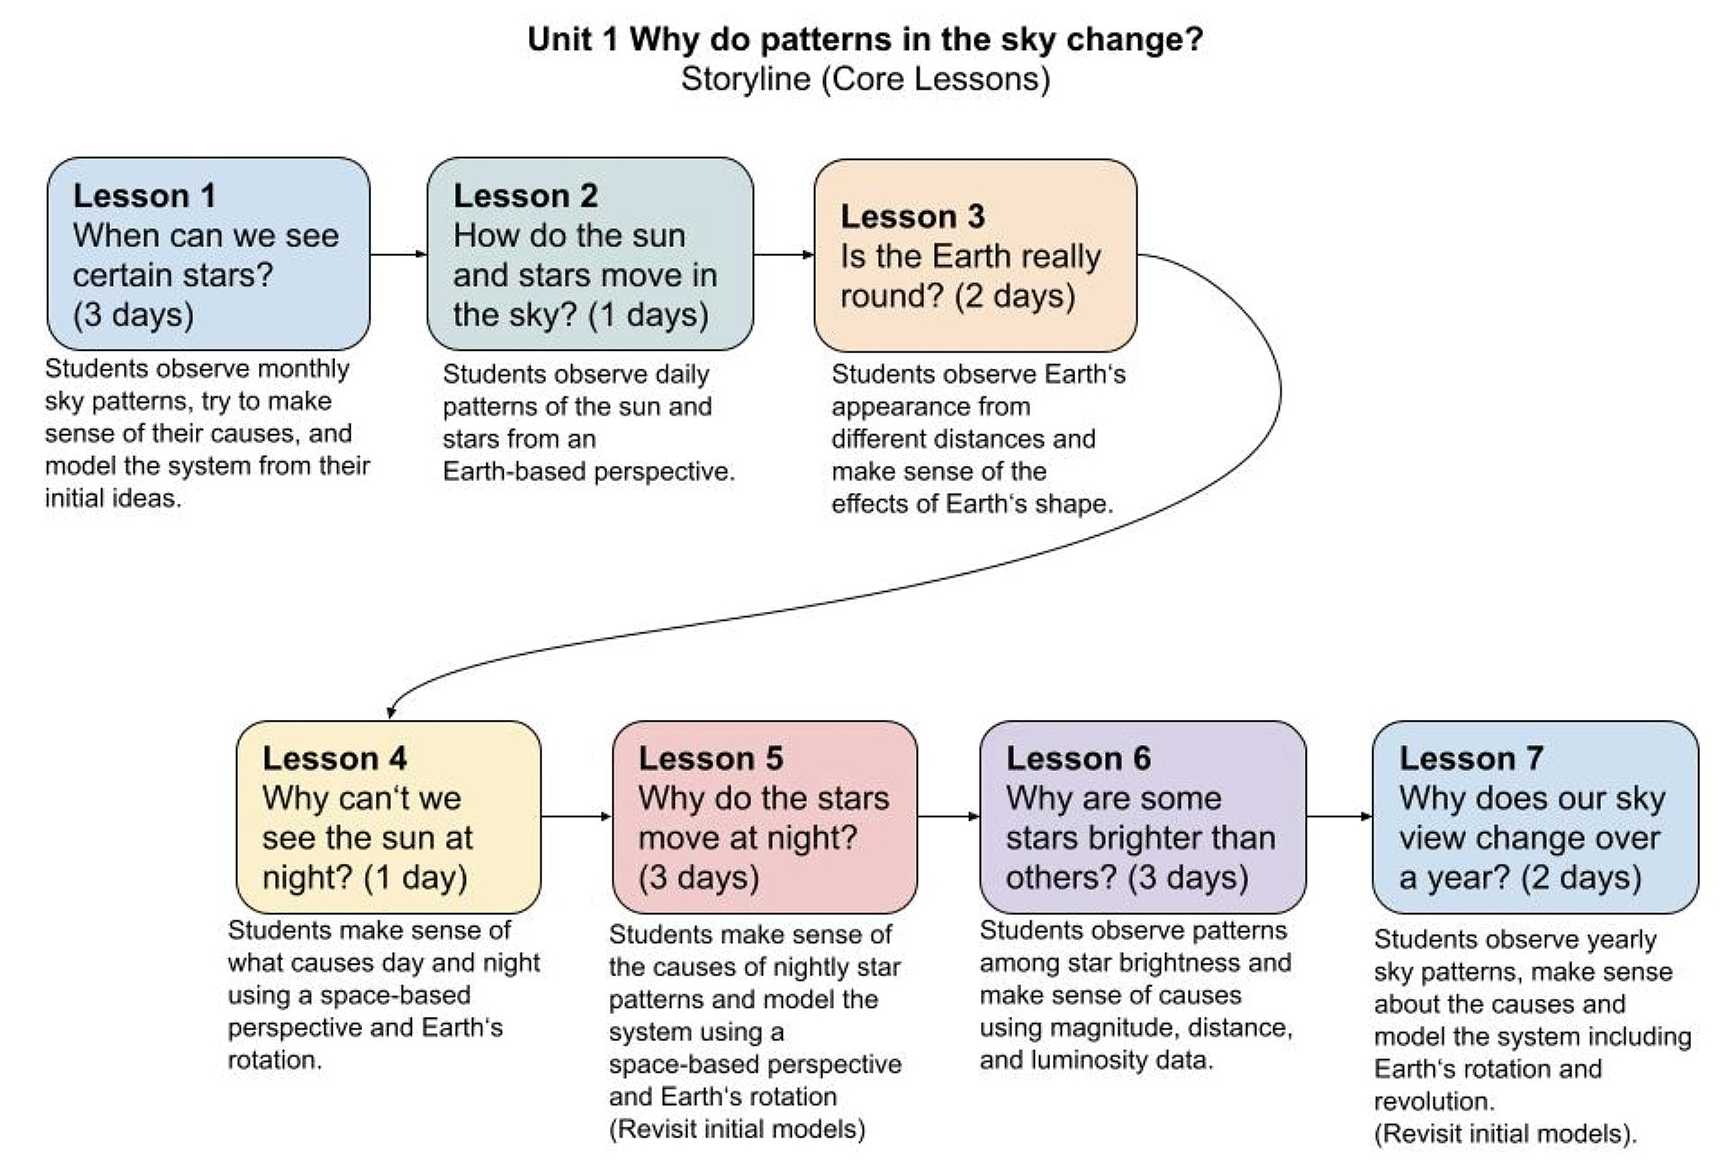
The storyline has seven lessons (Figure 1). First, students share a common experience of the anchoring phenomenon. Next, they figure out how Earth’s daily rotation causes the apparent motion of the Sun and stars. Students examine the relationships among distance, apparent brightness, and the light energy each star emits. Last, they figure out how Earth’s motion causes changes in the stars we see from month to month. In this way, the storyline develops the knowledge that students need to explain the anchoring phenomenon.
Core lessons.
Lesson 1, Day 1: Introducing the Phenomenon (~45 minutes)
We begin by sharing that the main goal of the activity is to better understand the NGSS and more specifically, storylines, so teachers can move their practice toward the vision of the NGSS. The activity introduces the anchoring phenomenon for a larger storyline that we share after the lesson 1 experience to provide context and show how the first lesson sets up the storyline.
To connect to participants’ cultures, we contextualize the phenomenon in a locally important event—the Hawaiian New Year, called Makahiki. We begin by asking participants, “What is Makahiki and why is it important?” We engage in a brief discussion about their knowledge and experiences. We highlight the important knowledge that the learners contribute to the discussion, such as that the timing of Makahiki is related to seeing Makali‘i (the Pleiades) on the horizon at sunset. The Pleiades is an open star cluster that is in the constellation Taurus. We share a video clip that shows Makali‘i rising to provide a common experience and that to “rise” means to come up over the horizon (https://youtu.be/xMTWXIZlc78). We ask, “When can we see Makali‘i rise at sunset?” After talking about our initial ideas, we examine some sky charts.
Participants compare sky charts for three different months of the year—November, December, and June (https://imiloahawaii.org/sky-charts). These sky charts show the entire night sky. Stars at the center are directly overhead. Stars at the edge are low in the sky. We tell participants that we are going to explain the science and engineering practice of analyzing and interpreting data and why we use it: “Scientists represent data in displays to reveal patterns that indicate relationships. Sky charts are a source of data. They show the star patterns that can be seen in the sky during each month. We will analyze and interpret the data on these star charts” (NGSS Lead States 2013). We show the participants how to read the sky charts. Participants work in groups of four to compare the sky charts, recording the names of the constellations in a table and marking which months they can be seen. We introduce some procedural vocabulary, such as constellation. We intentionally wait to introduce the crosscutting concept of patterns to model for participants the teaching practice of allowing students to demonstrate what they already know using their everyday language and funds of knowledge before vocabulary is introduced (Haas et al. 2021).
After the groups have identified similarities and differences among the sky charts, we come together for a whole-class discussion. Participants contribute their findings, and we make a list using a t-chart. Participants notice that from one month to the next, most of the same constellations can be seen, but the constellations are very different six months later. They also notice that the North Star is visible in all three months.
At this point, the participants have recorded what they wonder about the stars. We gather those questions on a class question board (Figure 2). The facilitator reads several questions and praises the class for asking such great questions. We tell the participants that we will answer many of these questions during our science unit. Questions typically include “What causes the stars we see in the sky to change?” We will use the participants’ questions to identify the driving question for the unit on day 3 of the lesson.
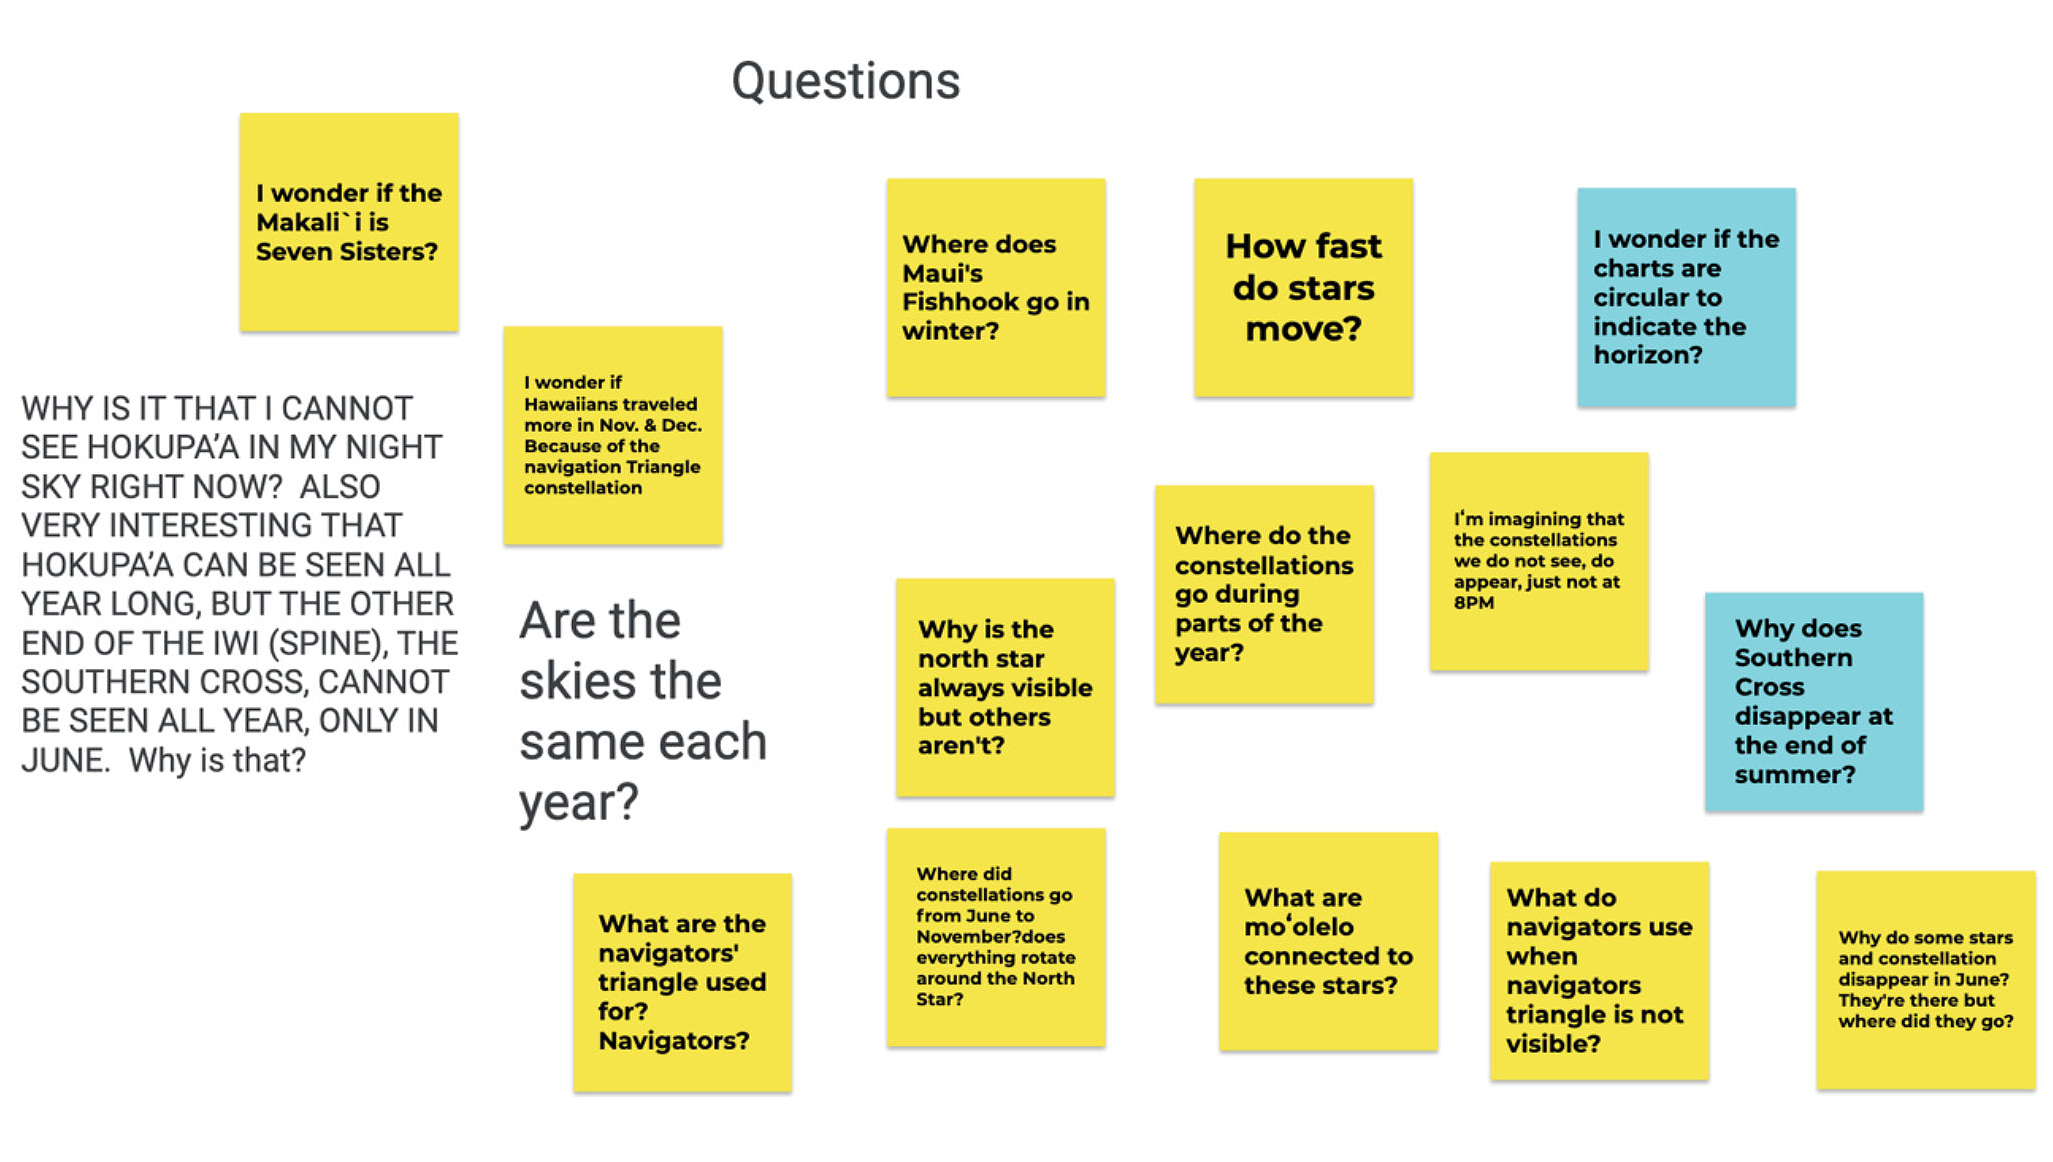
Question board.
At the end of this period, we summarize what we did, what we observed, what we learned, and how it helps us understand the phenomenon using a summary table (Table 1). This establishes a practice of tracking learning that will help participants later refine their models of the anchoring phenomenon. Then we introduce the crosscutting concept of patterns: “In this lesson, we used a science thinking tool called patterns, which is a crosscutting concept. Crosscutting concepts are thinking tools that we can use in science. Patterns help us describe what happens during a phenomenon. We used similarities and differences in sky charts to determine how what we see in the sky changes over a year.” We explicitly note which crosscutting concept we are using, how we are using it, and why we are using it to build participants’ metacognitive skill for using the crosscutting concept.
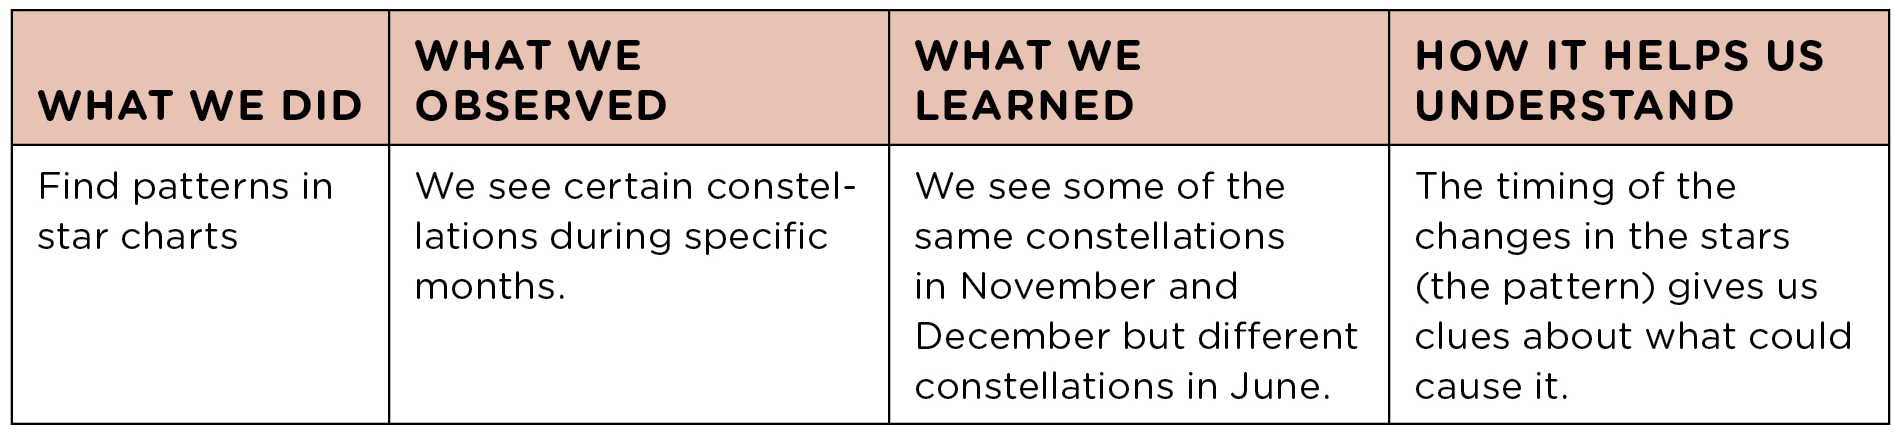
Example class summary table entry.
Lesson 1, Day 2: Developing
During this phase of the lesson, learners use their initial ideas to explain why they think that they see different constellations in December and June. We introduce the science and engineering practice of developing and using models: “Scientists use models to represent systems. Models can include drawings, diagrams, words, and numbers. We use models to show how things we cannot see cause what we can see.” Students use the patterns they noticed in the sky charts as evidence” (NGSS Lead States 2013). The practice of developing initial ideas allows students to self-differentiate by taking different pathways to access the science content. The use of visual representations makes the task more accessible to emerging multilingual students or students who need writing supports. We also introduce the crosscutting concept of systems and system models: “A system is a group of related parts that make up a whole and can carry out functions that its individual parts cannot. Scientists describe systems in terms of their components and their interactions. Scientists use system models to understand systems. Models should show the key parts of the system and how the parts work together. Models also show how things we cannot see explain what we can see. In this way, models include causes” (NGSS Lead States 2013).
We ask participants, “What are the important parts of the system that can explain why we see certain stars in certain months?” We identify Earth, the Sun, stars, and the observer as important parts. We provide some explicit guidance for how students will use the crosscutting concept: “Like scientists, we will label the parts of the system in our models (e.g., Earth, the Sun, the observer).” We give students five minutes to model their own explanation using a scaffold (Figure 3). The scaffold is a template that has two frames, one for June and another for November, to prompt participants to model changes over time. We have done this task in face-to-face and in virtual settings. In a virtual setting, participants use a Google Jamboard to develop their models. They drag the Sun, Earth, stars, and the observer to show their relative positions and add annotations to explain why they can see Makali‘i in November but not in June. In face-to-face settings, participants draw their models on paper. First, participants work on modeling individually. As they work, the facilitator circulates through the room to see where participants’ understandings are. Facilitator talk moves include pressing or focusing questions or prompts. The goal is for participants’ initial ideas to be clearly recorded in their models about why they think the star patterns change over time. To help participants construct their models, the facilitator prompts thinking about the crosscutting concepts by asking questions like
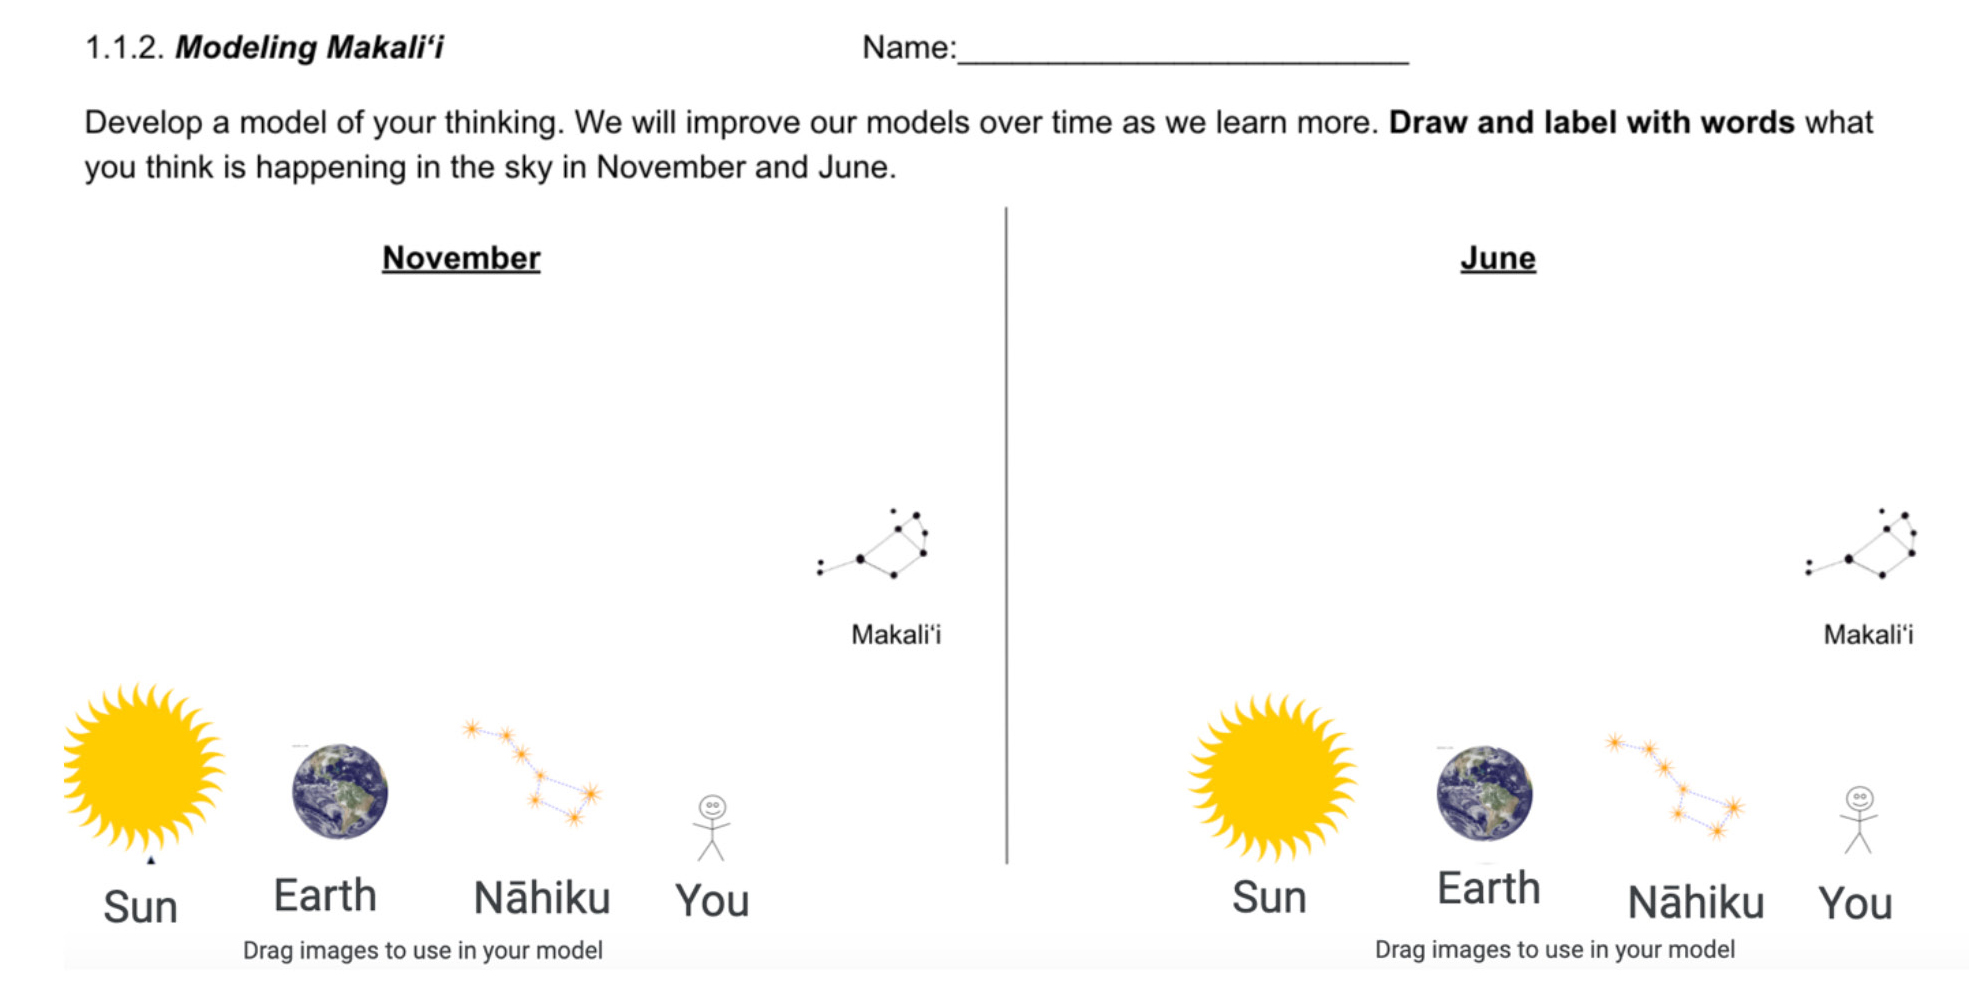
Model template.
Next, they share their models with a small group. Each group member explains their model. Participants are encouraged to revise their models based on what they learn from one another. This activity culminates with developing a class model. The facilitator selects one model as an example to share with the class. Participants are asked to point out important features of the model and for other ideas to contribute to the model that are not in the example. This process continues until many participants’ ideas are discussed. We emphasize that the goal is to gather all the different ideas in the class that we have right now. We tell participants that we will revisit this model during the unit and revise it as we learn more about the phenomenon. (See Supplemental Resources for example models and key.)
Lesson 1, Day 3: Developing a Driving Question (~30 minutes)
During the last phase of the lesson, we ask participants what they are wondering about, which might be the same thing they were wondering about when viewing the sky charts in their groups earlier in the lesson. Participants record their wonderings on sticky notes and place them on the question board. We ask the participants to think of one large question that describes what we want to find out. After some discussion, we settle on something like “Why does our view of the sky change over a year?”
We close the lesson with a recap of the three thinking tools (crosscutting concepts) that we used in this lesson: patterns, cause and effect, and systems and system models: “Scientists use system models to understand and predict the behavior of systems, such as the Earth-Sun-stars system. System models can explain the cause of the patterns we observe.” We use a graphic organizer to show how these crosscutting concept thinking tools are related to one another (Figure 4): “Scientists use similarities and differences in patterns to analyze change. Patterns lead to questions about what causes those patterns. Scientists use cause and effect relationships to explain change. In this way, scientists often begin by noticing patterns, then figure out the cause, and then communicate their explanation with a model.” We explain to the participants that these are important thinking tools that we will use often in science.
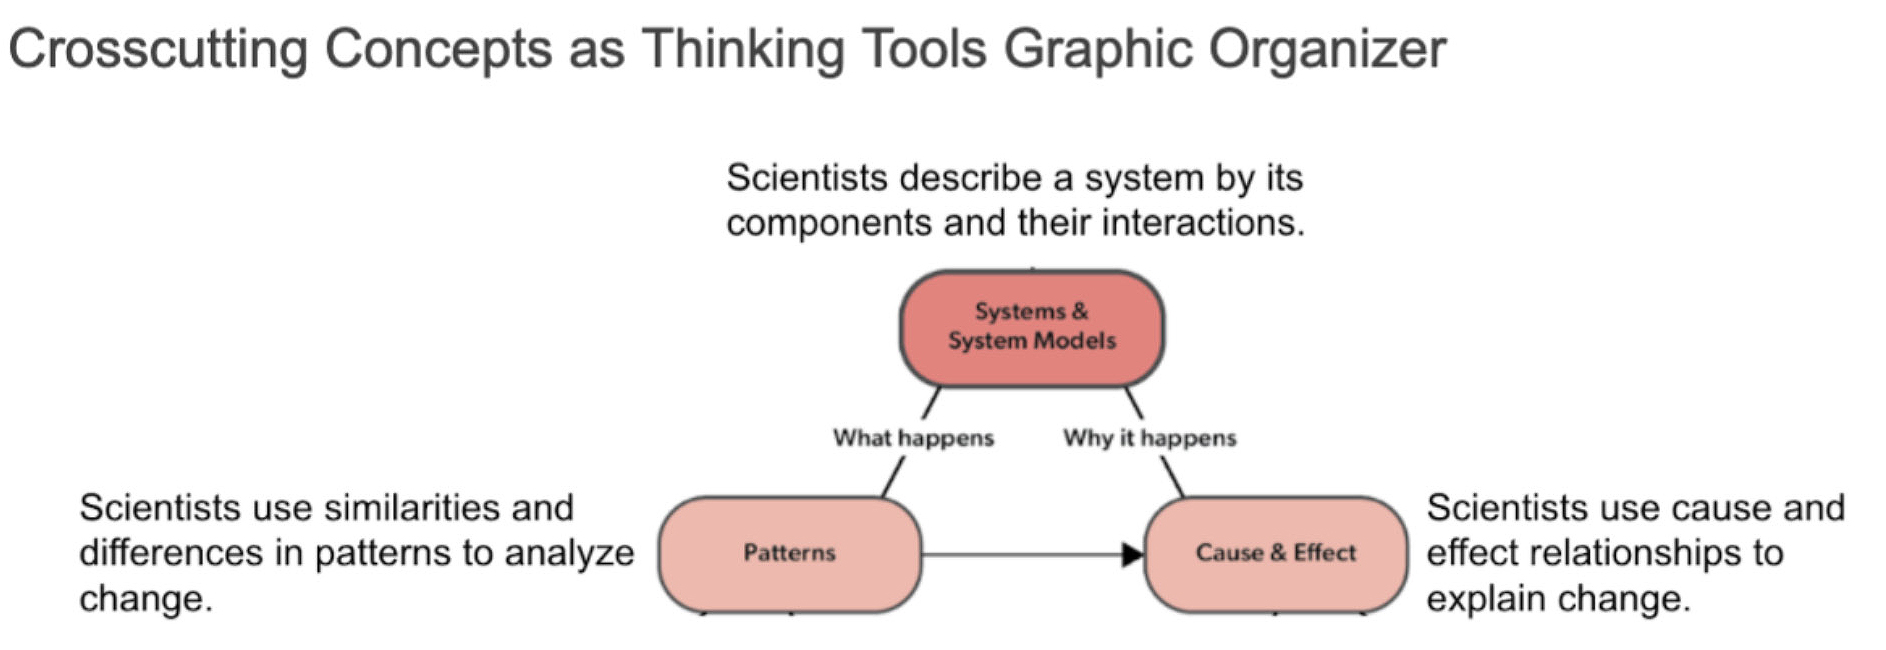
Graphic organizer.
Participants Debrief
This activity engaged teachers in developing models of the Earth-Sun-stars system to describe movements and patterns. Participants engaged in sensemaking about the changing positions of Earth, the Sun, and stars throughout a year. After experiencing the first lesson of the unit from the student perspective, participants examine the sequence of learning activities that facilitates participants’ figuring out the cause of the patterns in the night sky. These experiences and the accompanying materials provide resources for teachers to support fifth graders in sensemaking experiences that can be built upon in later grades for explaining the reason for Earth’s seasons.
Conclusion
The elements of this professional learning experience provided an opportunity for participants to experience an anchoring phenomenon and the launch of a storyline unit. Anchoring phenomena are critical to NGSS-aligned instruction, and teachers need experiences and support to transform their instruction to be phenomenon-driven, which is a new approach for most teachers. Participants used three crosscutting concepts and two science and engineering practices with one disciplinary core idea during the lesson to develop their initial ideas about what they can see in the sky and why.
This lesson is one example of how an anchoring phenomenon can launch a storyline unit and be used in materials that fit the vision of the NGSS. Storyline instruction situates students as the builders of knowledge rather than as receivers of information (Reiser et al., 2021). This lesson also shows how we created an engaging storyline around a culturally relevant phenomenon. This storyline can be made more relevant for other cultural contexts by modifying the anchoring phenomenon to be about the timing of New Year celebrations. Students can share when their families celebrate the New Year. Different cultures base their celebration dates on a variety of celestial events, such as Moon phases, rising stars, and the equinoxes, which can lead to interesting class discussions of the timing of celestial events. For example, the Lunar New Year occurs on the second full moon after the winter equinox and the Maori New Year occurs when they see the Pleiades rise in July. We encourage teachers to use these ideas as they create their own curriculum resources based on culturally relevant phenomena to better reflect equitable three-dimensional learning. However, we recommend teachers start their storyline designs with short units of about two to four weeks to prevent getting overwhelmed.
Supplemental Resources
https://drive.google.com/drive/folders/1pf1YR3b3meEIhbLzFoTj-6kg_ChWcPU-?usp=sharing
Lori Andersen (landersen@vernier.com) is a Senior Instructional Designer at Vernier Science Education.
Astronomy Earth & Space Science Pedagogy Teacher Preparation Elementary