
feature
Visualizing Habitats
Using visual data to help kindergarteners model relationships between living things and the places they live
Visual data—or visual sources of information—are a crucial part of helping students understand STEM concepts, improve their reading skills, and engage in science and engineering practices (Finson and Pedersen 2011). Indeed, many science and engineering practices require students to make meaning from visual data. When students are developing and using models; analyzing and interpreting data; or obtaining, evaluating, and communicating information, they are often working with visual data.
Although students in the early grades often receive a great deal of instruction on literacy skills, much less time is devoted to teaching students the skills necessary to understand visual data that often accompanies text (McTigue and Coleman 2013). Yet, visual data is critical for students to deeply understand science content—particularly for English language learners (ELL). To support students’ science and literacy development in the early grades, teachers can design their instruction to promote students making sense of visual data. For example, lessons can be structured to begin with more concrete representations of visual data (Figure 1). Teachers can then scaffold students toward more abstract, generalizable representations and have students apply their knowledge through another concrete representation (Olson 2013). Research-based teaching models such as the 5E follow a concrete-abstract-concrete representation lesson structure that puts experiences first—before helping students understand and apply the science concepts behind the experience. This lesson sequence is partially useful for young children and ELL students because they have more concrete experiences to help them understand a concept even as they are developing language skills (Olson et al. 2009).
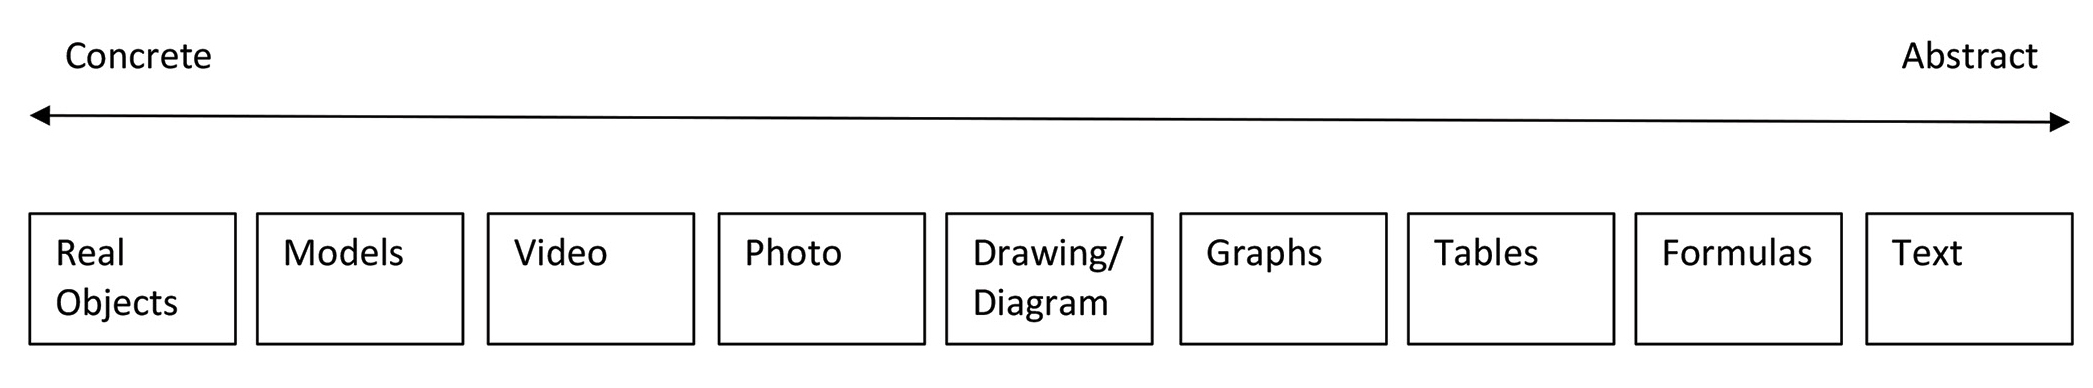
Visual science representation continuum (Olson 2013).
In this article we describe a kindergarten 5E lesson (partially addressing K-ESS3-1) where we scaffold students using visual data to build understanding and model relationships between living things and the places they live. This 5E is part of a bigger unit about plants, animals, and the environment. Prior to this 5E lesson, students have learned about the difference between living and nonliving as well as plants and animal needs. With this background knowledge, our students were ready to learn about living things and habitats.
Engaging Students With Habitats (30 minutes)
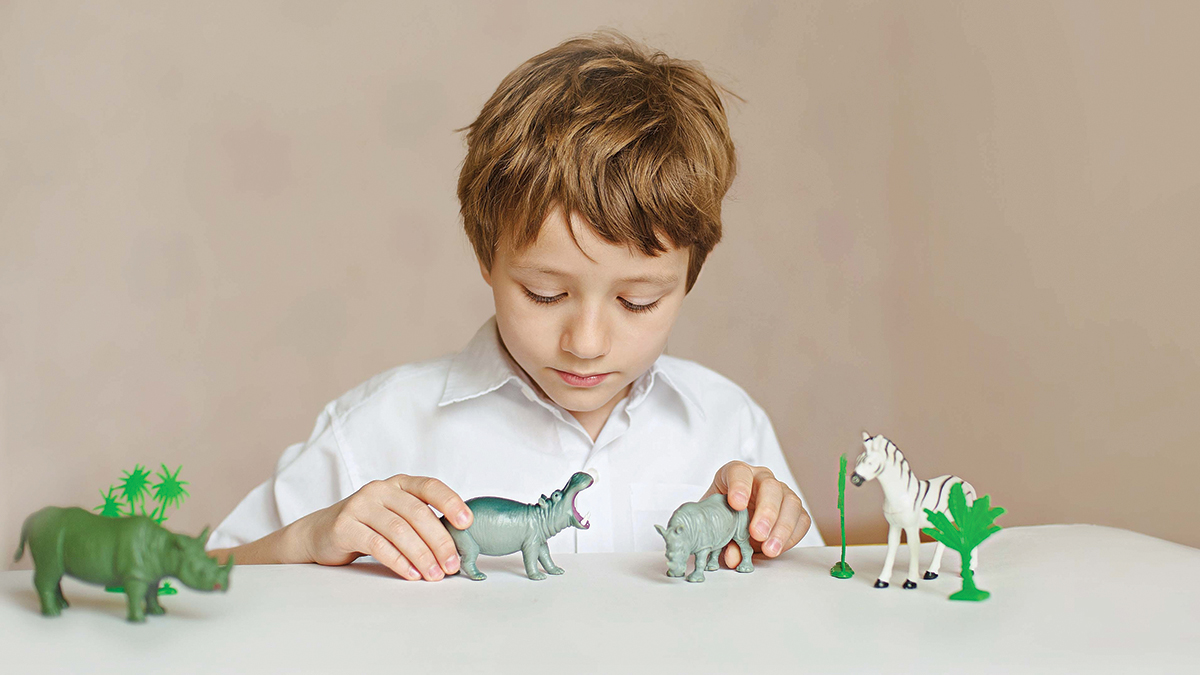
We begin by sharing that we are going to investigate the question: “Why do plants and animals live where they live?” We start the investigation by showing students short videos of different habitats (grassland, polar, desert, ocean, and rainforest) with different plants and animals (Figure 2). As students watch each video, we ask them questions about the habitat to help them process the visual data and provide opportunities for students to be successful with oral language (Olson et al. 2009). These questions include:
- What types of animals do you see living here?
- What do the plants look like in this picture?
- How would you describe the habitat?
Students often respond with, “I see lots of birds and deer,” “The plants look pokey and green,” and “It looks really dry.” We label each habitat and record students’ observations on the board as we go through each one.
Resources for learning about habitats.
Videos and Slideshows:
- Planet Earth and/or Planet Earth 2 Documentary
- National Geographic Destination World Videos
- Our Planet Documentary
- Life Documentary
- Kids National Geographic Habitat Slideshows
- YouTube
- “Rainforest Habitat”
- “Ocean at a Glance”
- “Deserts 101- National Geographic”
Books
- Books by Sheila Anderson such as What Can Live in a Grassland? and What Can Live in a Desert?
Models
- Nature Toob and Wild Republic Mini-animal Figurines
Photographs
- Open source pictures
Exploring Through Visual Data (60 minutes)
After students have interacted with the habitat videos, we have them explore each habitat in small groups. Students are given a series of pictures, one from each of five selected habitats (Table 1). They are also given a variety of plant and animal models that correspond with each of the habitats. We begin by having students observe the pictures. Then, students take the plant and animal model and set it on top of the habitat picture where they believe the plant or animal lives. While students are sorting their items, we walk around and formatively assess their thinking by listening to their ideas and observing where they are putting the items. As students are placing the plants and animals, we provide vocabulary support if needed and also ask what their reasoning is behind the grouping. These questions include:
- What do you notice about this landscape?
- Why do you think this animal/plant lives here?
Students typically respond with answers such as, “The picture has a lot of sand and looks hot,” “This animal has fur so it can live in this cold place,” or “I saw those plants in this place before.”
Now that students have engaged with the individual habitats, we want to expand on that knowledge and explain the reasoning behind their placements and thoughts. The students are split into small groups of around four to create five groups, one for each of the habitats. The small groups are each given a variety of photographs, picture books, illustrations, and other visual data that belong to one of the habitats from earlier. This multimodal approach helps students make connections between the concrete representations and the needs of plants and animals. As students are investigating, we walk around the room, listen to their conversations, redirect, and differentiate for the groups when necessary. To help students explore the visual data more closely, we ask, “What are you noticing in this picture?” “How do the words connect to the pictures?” and “What is the same between this (pointing to visual data source) and the real world?”
After students have investigated one habitat for 5–10 minutes, they rotate as a whole group to another habitat. We demonstrate the order of the stations by walking to each one to ensure students understand and to help us manage the activity. We then have students repeat the process of observing the various books and explanations for the new habitat. We typically break up this investigation into two days.
Explaining Relationships (30 minutes)
After student groups have interacted with each of the habitats, we come back together as a whole group. We ask for student volunteers to raise their hands and share something they have learned or noticed about that habitat. To help students understand the relationship between living things and where they live, we draw students’ attention to the visual data described above and ask questions such as:
- “How much water is in this habitat?” or “How much do you think it rains?”
- “What do you think the temperature is like in this habitat?”
- “What plants and animals did you find that live in this habitat?”
- “Why do you think _____ live in this habitat?”
- “Why do you think _____ doesn’t live in this habitat?”
As students share, we ask follow-up questions and use students’ thinking to scaffold them toward understanding the disciplinary core idea. For example, when discussing grasslands, our students often say: “We saw lots of grass and deer.” From here, we ask students, “If you notice lots of deer and grass, how do you think they go together?” Students often explain the deer eat the grass to live.
As an assessment, students return to the original habitat boxes and re-sort the models onto the pictures. We walk around and observe students’ work. Often, we do this habitat sort as a part of a center so we can interact with students in smaller groups. The small groups work helps us to differentiate more easily and assess science and literacy standards. Specifically, we look for:
- The extent to which students are discussing how plants and animals get their needs from the habitat (K-ESS3-1).
- Participation in collaborative conversations with diverse partners about habitats with peers and adults in small groups (CCSS.ELA-LITERACY.SL.K.1).
- The extent to which students can ask and answer questions in order to seek help, get information, or clarify something that is not understood (CCSS.ELA-LITERACY.SL.K.3).
In our experience, students have great conversations and are much more accurate in matching plants and animals to the habitats. However, students frequently confuse where birds and snakes live because species of these organisms can live in a variety of habitats. We often talk about any issues we noticed during the assessment as a whole group once we’ve finished the assessment.
Elaborating Through Building Habitats (60–90 minutes)
By now, students have explored a variety of habitats and organisms that live within those habitats, and the relationship between those habitats and organisms. We now have them apply this new information by creating their own diorama to model a habitat of their choosing. We start by explaining to students that they will be creating their own habitat. By using an example habitat diorama, we show students what type of project they will be creating. Students can see the diorama box, which helps them visualize what they will be creating, including the appropriate number of animals and plants to place inside.
To begin, we have students brainstorm and research ideas as to what organisms and details they will be putting into their dioramas to make it accurate (about 30 minutes). Students draw a picture of what they want their habitat to look like. We work to have them use their knowledge from our previous lessons as well as look through the books and media we have already used during our investigations. As students begin to form their ideas, we walk around the room and ask them to explain why they chose the habitat that they did as well as what types of organisms they will be putting into their boxes. We want to make sure the students are using their knowledge from the previous discussions and choosing appropriate organisms before they begin to create their boxes.
Once the groups have drawn a picture and explained what they plan to do, they begin working on creating their habitat dioramas (Figure 3). We typically have students work on creating their dioramas over two days or a total of about 60 minutes. Prior to beginning, we discuss potential safety issues (e.g., working with scissors). As students are working on their dioramas, we typically are busy helping students cut fabric, glue and tape pictures, and think through their designs. When we are helping students, we often engage them and differentiate through questions. We ask questions such as, “Why does it make sense you are putting ______ in this habitat?” Students often make connections between the plant or animal and the habitat such as, “Polar bears have lots of fur to help them stay warm,” “Snakes like to live where it’s warm. The desert is warm,” and “Trees need water. The rainforest has lots of water.” In our experience, most of the students are now readily making connections between the plants and animals and the places they live.
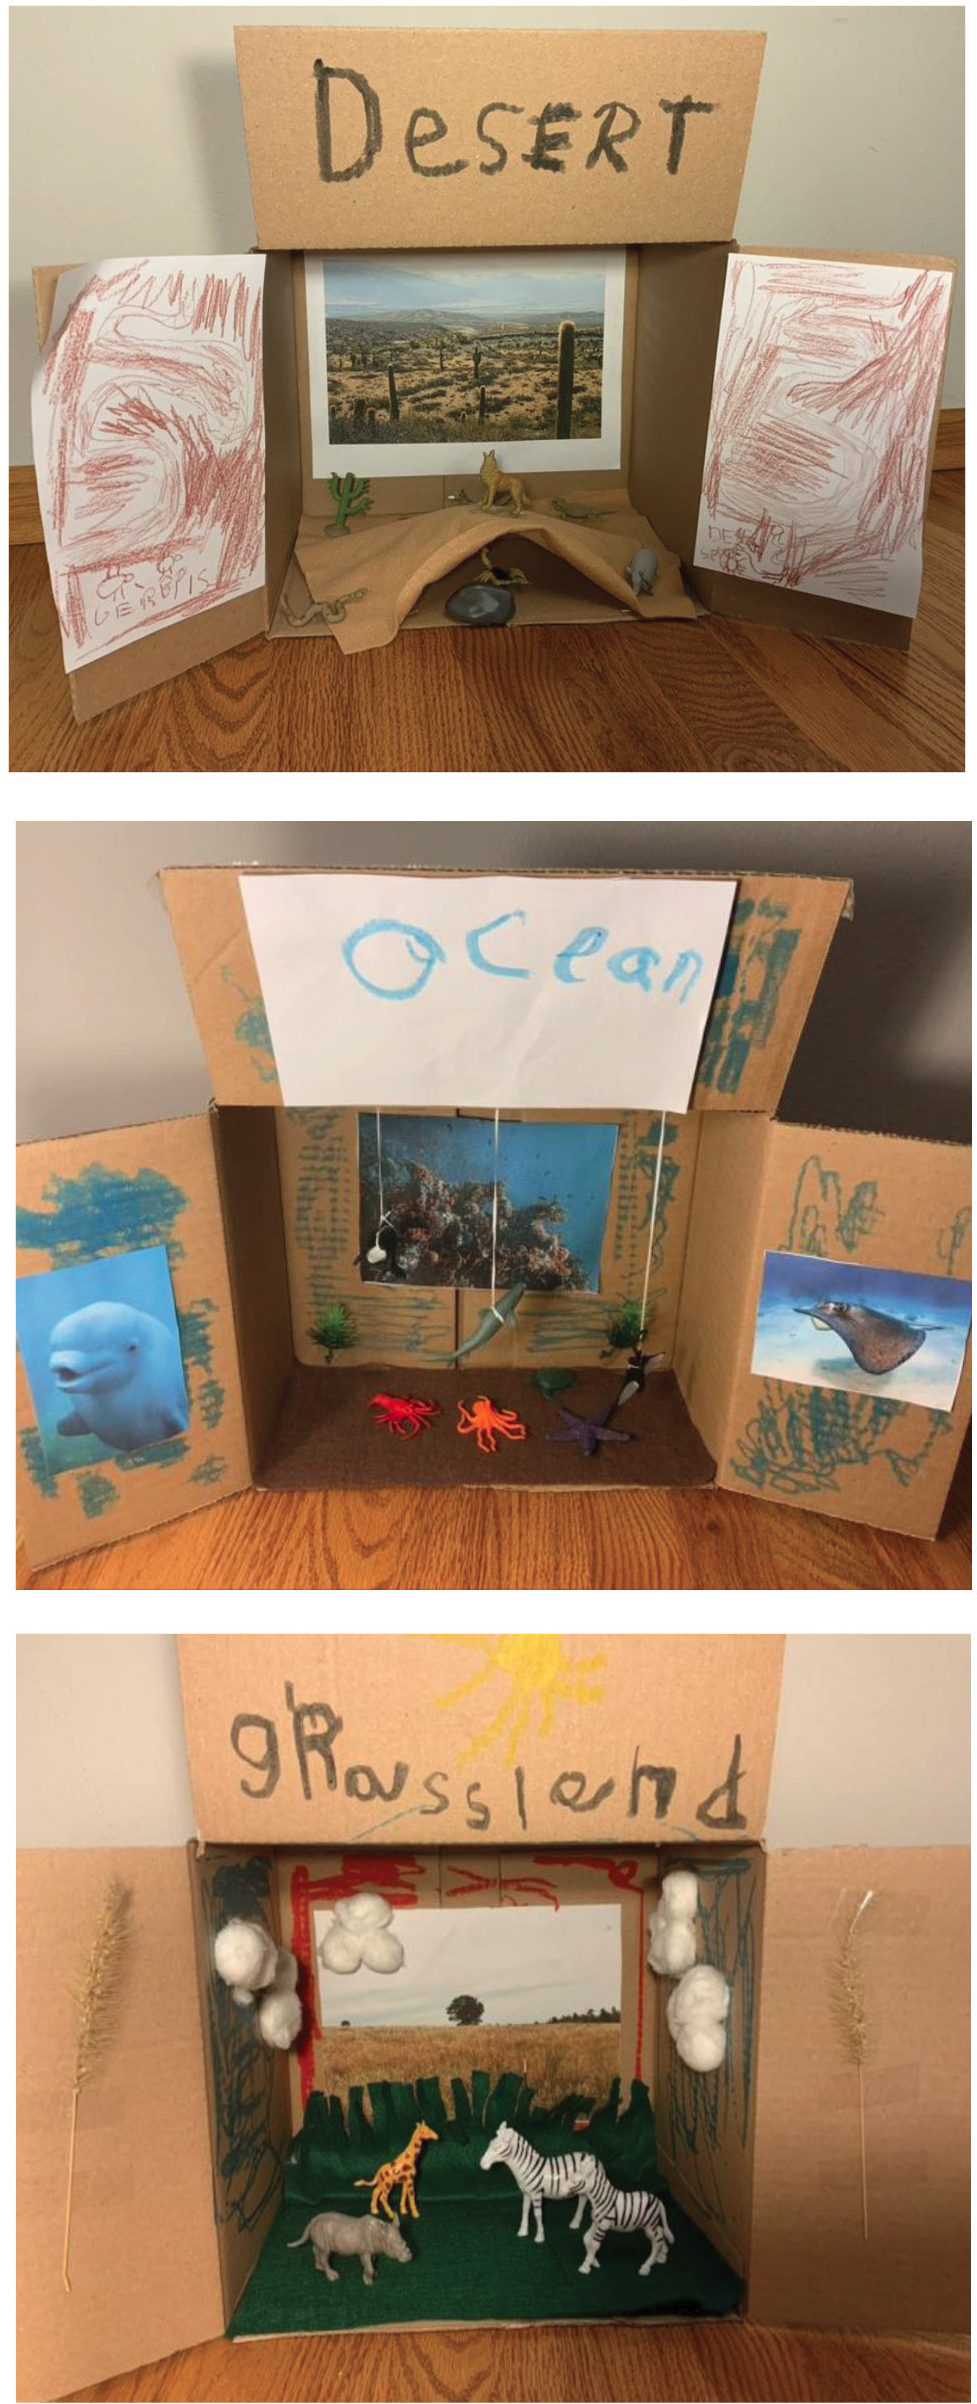
Student dioramas of habitats.
Evaluating Habitats (30 minutes)
Finally, we have students evaluate the other dioramas that their fellow classmates have created. We begin by discussing as a whole group what the expectations are during the presentation of the dioramas. Prior to students presenting, we help students understand how to present their dioramas as well as what types of questions and conversations should occur during the presentations. We model how we would present a diorama using a habitat a student created the year before. We ask students what they noticed about our presentation. They typically say things like, “You talked about what you know about the habitat” and “You told us about the plants and animals that live there.” Then, we work with students to generate questions they could ask the presenter. We scaffold students to ensure they ask questions related to our central question: “Why do the plants and animals live where they live?” Students often generate questions such as:
- What do you like about your habitat?
- Why did you choose the animals you did?
- What plants live there?
- Why do those plants live in that habitat?
- Why do those animals live in that habitat?
For assessment purposes, as students are sharing their ideas and presenting their habitats, we walk around the room and listen to the different groups. Specifically, we assess how students are using the diorama as visual data to describe their habitats (science and engineering practices) as well as the connections they make to plant and animal needs (disciplinary core idea). We also talk with students to assess to what extent students are seeing habitats, plants, and animals as a system (crosscutting concept). Additionally, we assess how effectively students are asking and answering questions and are engaging with each other (literacy standards). We typically also have the students present their habitats to their parents during parent/teacher conferences.
Conclusion
Thoughtful inclusion of visual data throughout a 5E lesson can help children deeply understand science concepts. When students experience multiple types of visual data, they are more likely to create more robust mental models—particularly when the lesson sequences visual data effectively (Finson and Farland-Smith 2013). With our 5E on habitats, our lesson sequence began with concrete visual representations, moved to more abstract visual representations, and scaffolded back to concrete visual representations (Figure 4). Given our culture is increasingly using visual data, helping students develop the tools and the means to make sense of it is time well spent. ●
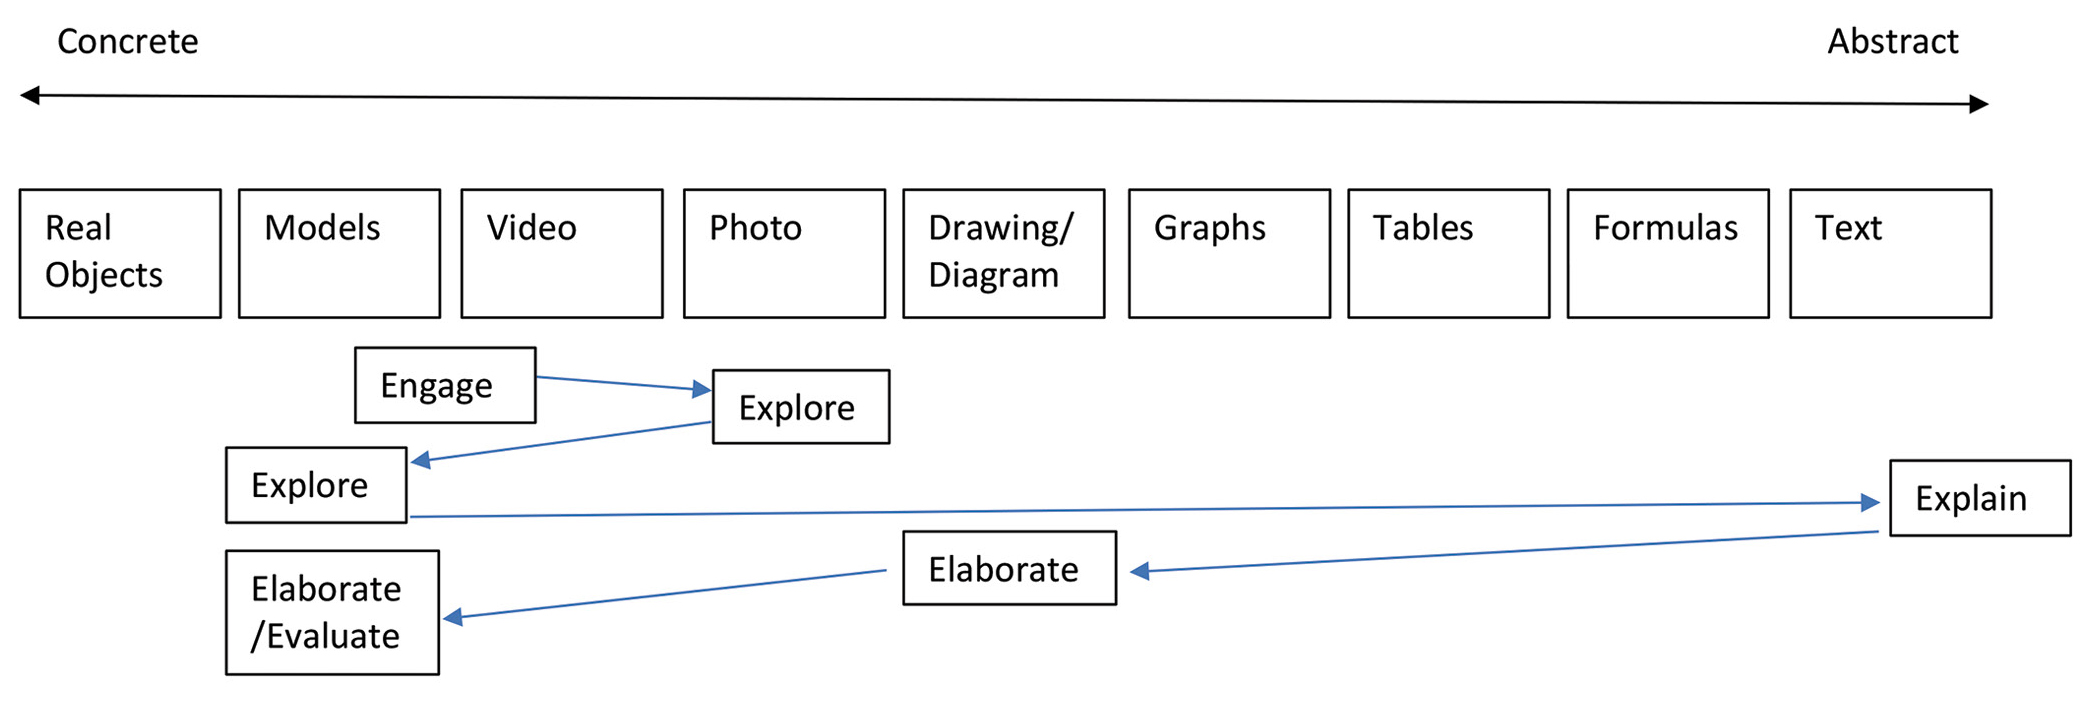
Scaffolding along the representation continuum within the habitats 5E.
Jesse Wilcox (jesse.wilcox@uni.edu) is an assistant professor of biology and science education at the University of Northern Iowa in Cedar Falls, Iowa. Abby Rose is a fourth-grade teacher at Wright Elementary in Des Moines, Iowa.
Biology Instructional Materials NGSS Elementary