
feature
Going Viral
Using Technology in the Classroom to Show the Spreading of Viruses
CONTENT AREA Life science
GRADE LEVEL 5–8
BIG IDEA/UNIT Viral transmissions
ESSENTIAL PRE-EXISTING KNOWLEDGE All living things are made up of one or more cells.
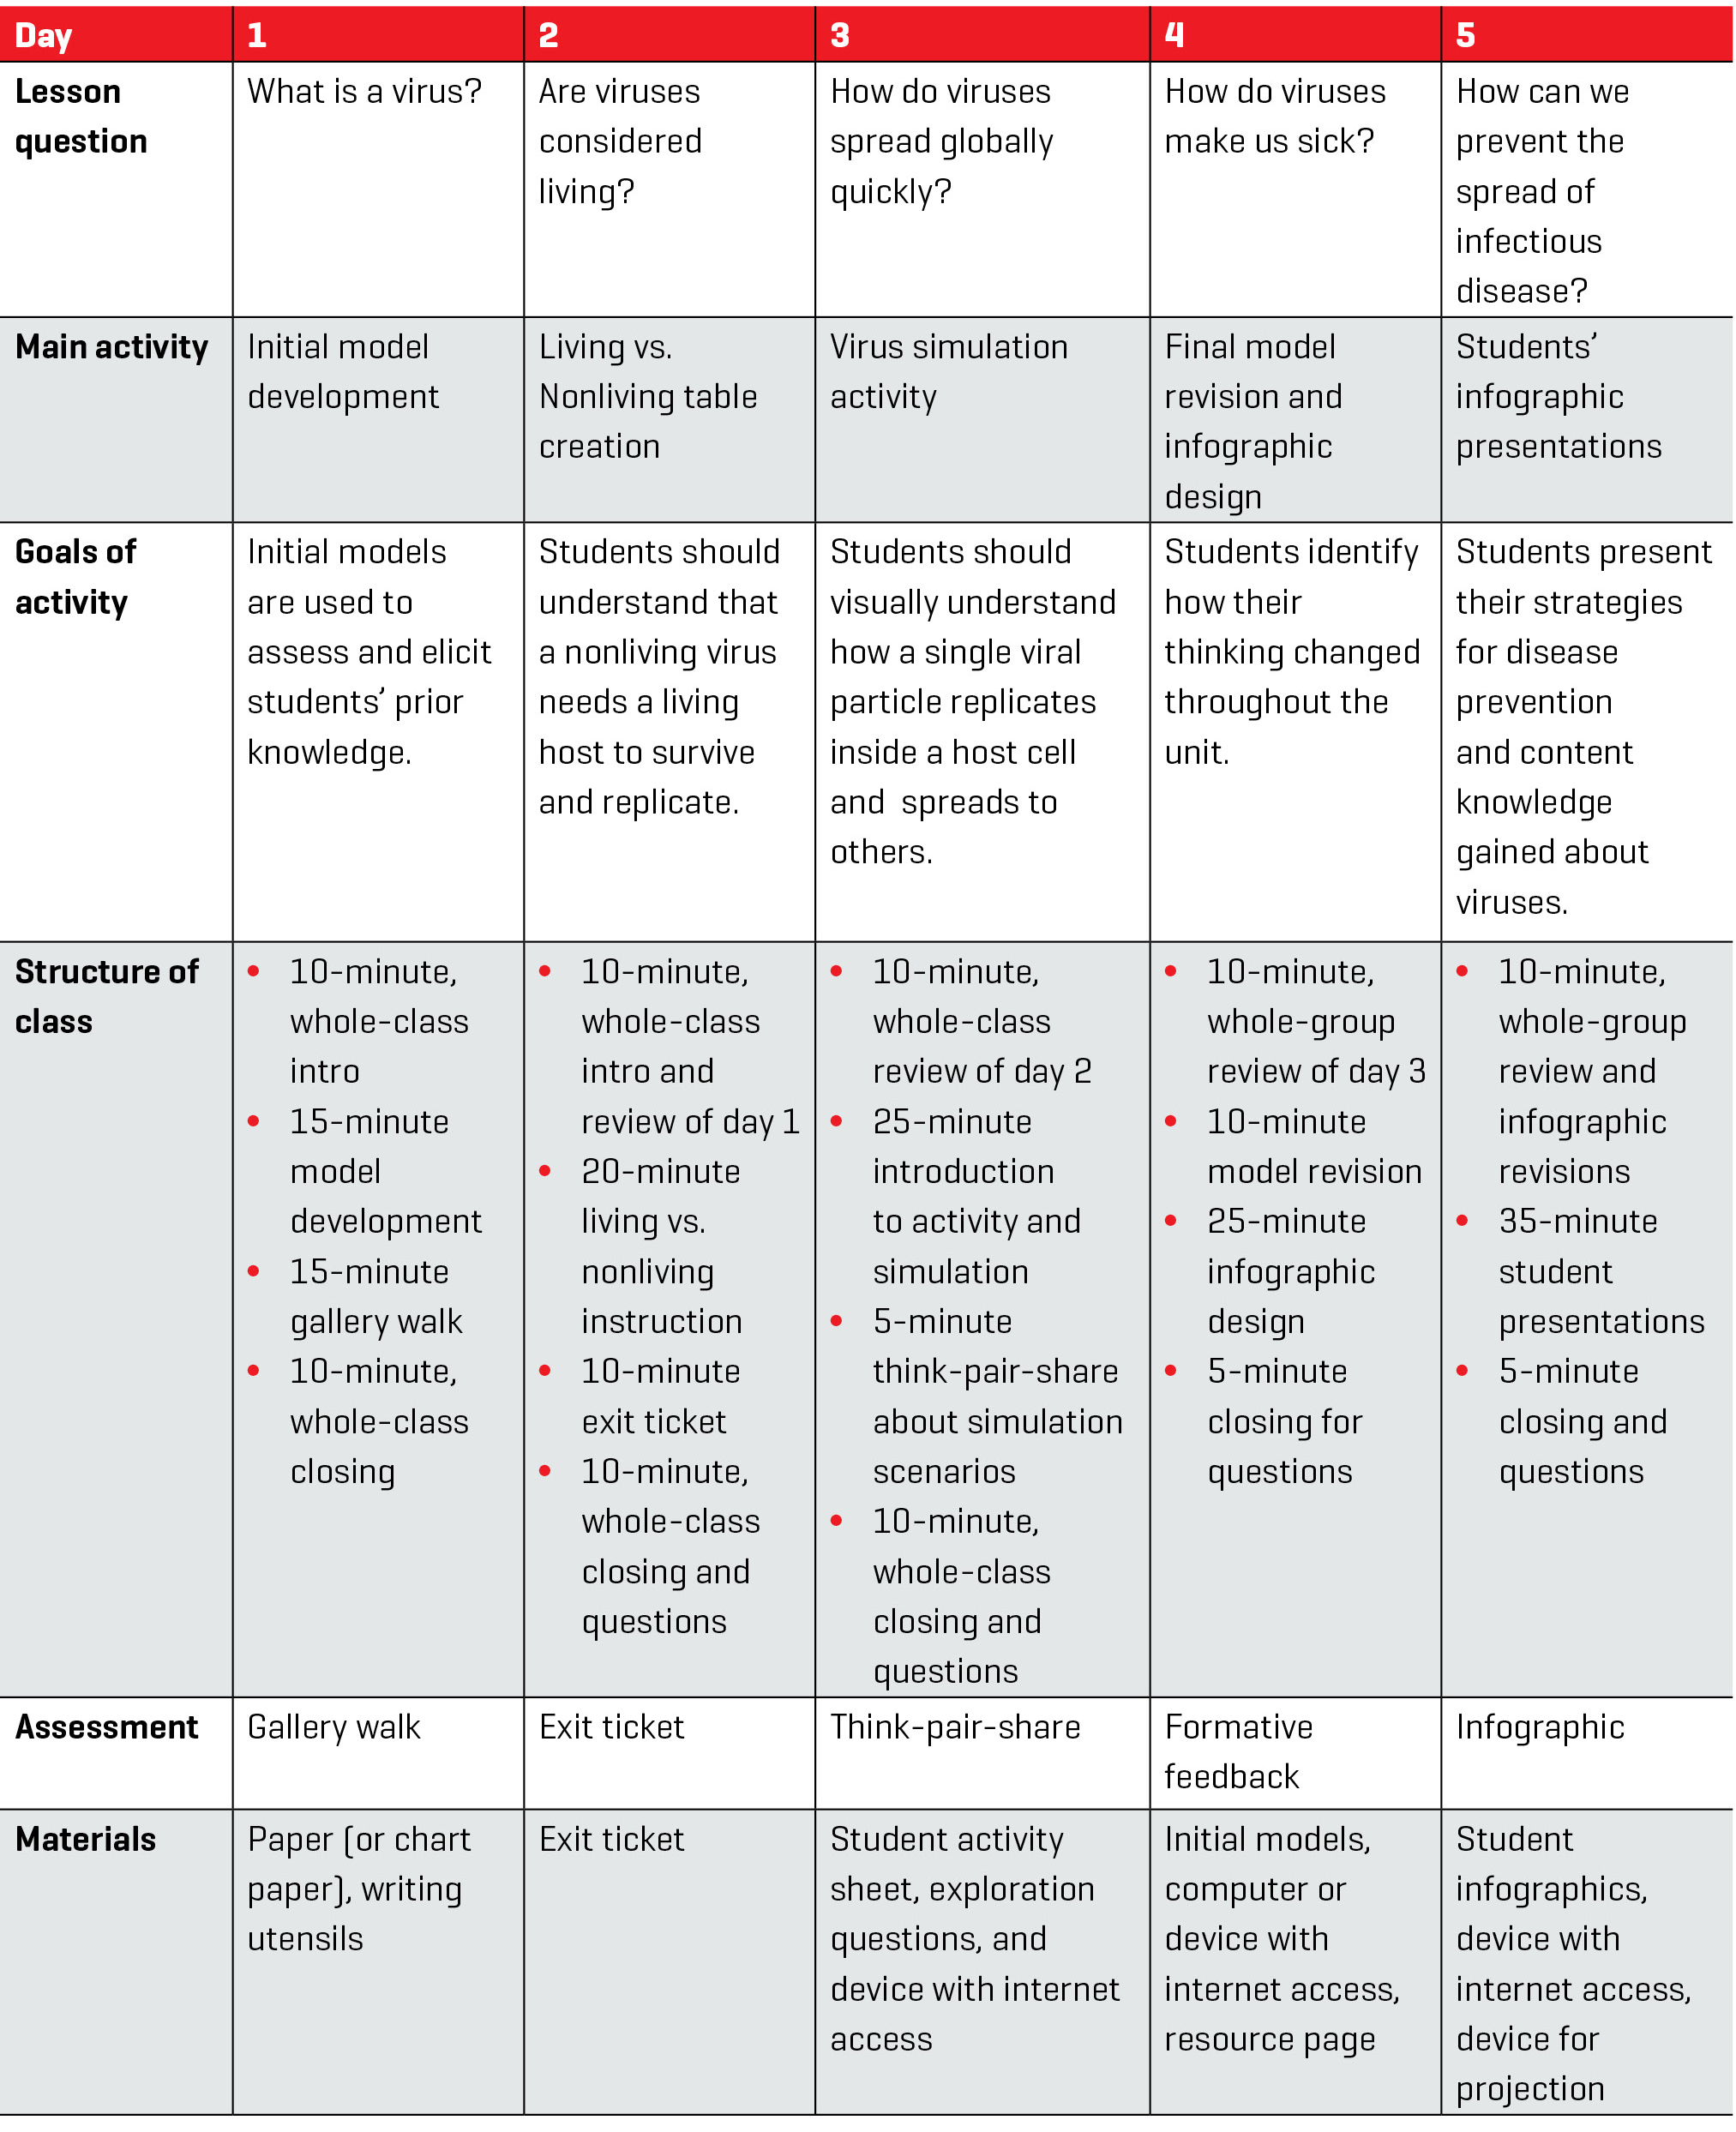
TIME REQUIRED 5 days
COST Online simulations are free except for Gizmos Lytic Cycle; prices vary depending on number of students and teachers. Simulation is free for 5 minutes a day.
SAFETY Supervise internet use.
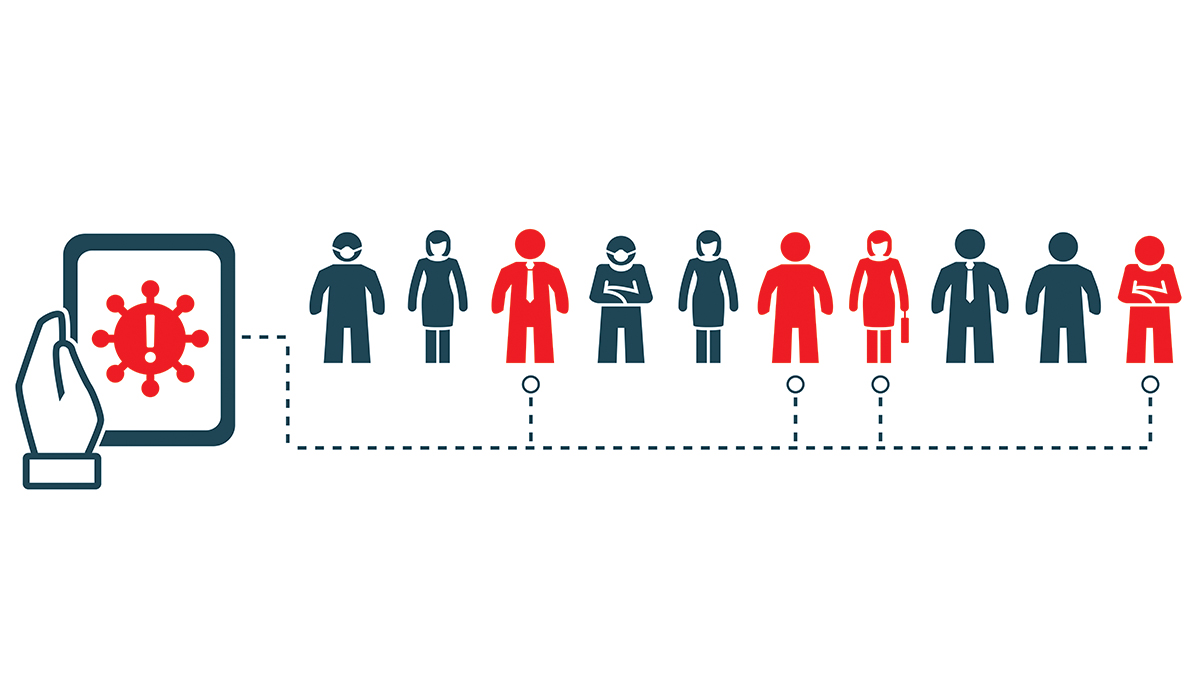
Social distancing, closed schools and businesses, quarantine, and pandemic are all words and phrases our students became very familiar with during the spring of 2020. How do we explain to our students that a virus particle called severe acute respiratory syndrome coronavirus 2 (SARS-CoV-2, hereafter referred to as coronavirus) put a stop to normal life as we know it? How do we engage our students in a visual representation of this virus particle spreading across the world in a matter of days? The mini model-based inquiry unit (Windschitl, Thompson, and Braaten 2018) described in this article allows students to use modeling and multiple aspects of technology, such as online simulations and infographics, to show how a virus can spread globally in a short period of time.
Online simulations are models that provide opportunities for students to investigate and visualize scientific phenomena (Hilton and Honey 2011). By using models, students can engage in the scientific practices and the work of scientists. Simulations also provide a means for students to observe microscopic and macroscopic phenomena that can be difficult to visualize and, in doing so, are able to deepen their understanding of a concept (e.g., Ryoo and Linn 2012). If used appropriately, simulations provide an opportunity to maximize student achievement and interest in science (Chang and Linn 2013; ).
Infographics or information graphics integrate words and graphics to quickly and clearly present complex information and identify important information, patterns, or trends (Davidson 2014). They are often easier to understand than words alone and should be used to attract the attention of the reader to clearly communicate information. As part of this mini unit, students design and create their own infographic. They find evidence to support their thinking and determine what information is essential to convey their point of view. In the design of infographics, students should think about the type of audience they are targeting and how they might design an infographic to reach that audience. In addition, students are engaged in the science and engineering practices as they develop and use models to predict and/or describe phenomena, analyze and interpret data, and obtain, evaluate, and communicate information (NGSS Lead States 2013).
Overview of unit
We designed this mini model-based inquiry unit to show students that a virus must have a parasitic relationship with a living host (i.e., cells in the human body) to survive (Pea and Sterling 2002). This unit is centered on the coronavirus pandemic, making it relatable to all students and helpful in increasing student understanding. There is a possibility that a student may have lost a loved one due to COVID. Care should be taken to determine if this might be an issue prior to starting the unit; a simple exit ticket could be used to gather this information. The teacher can alter this unit to discuss transmissions with other viruses rather than COVID if he or she decides it is best to not address the pandemic. Teachers can use the influenza virus or measles virus as the basis of this unit instead. Students construct their explanation of a virus infecting a human and design a preventative solution as they engage in science and engineering practices to use technology to investigate and communicate what they learn. This virus unit builds on the disciplinary core idea that all living things are made up of cells; students will gain the understanding that viruses need a living host to survive and replicate (see Table 1; see also Connecting to the Next Generation Science Standards chart in Supplemental Materials).
Part 1: Modeling prior knowledge
Prior to creating initial models, teachers select a news video or data set to share with students about the spread of coronavirus in America. After watching the video, students record any observations or questions they have. Then students work with a partner (or small group if online) to share their observations and questions, and to create a list to share with the class. The teacher asks students to share scientific questions we could ask, leading them to focus on: “What is a virus?” “How do we catch a virus?” “How do viruses make us sick?” and “Why do so many people get sick?” After a few moments of students thinking independently about these questions, elicit their prior knowledge by having them construct an initial consensus model in small groups (two to three students) to represent the virus (what is a virus particle) and how it spreads (how the virus gets in us, makes us sick, and gets out of us). In an online setting, students can use breakout rooms for this discussion and whiteboard tools to create their models. Students include ways a virus can get into our body to make us sick. Students then model different ways a virus can spread from person to person and from country to country.
According to Falk and Brodsky (2013), models that are created at the beginning of the unit are a good assessment of students’ initial ideas. These initial models of viral particles and transmission bring to the surface students’ initial ideas and inform the teacher about the type of opportunities they will need to provide students to address them. While students are creating these initial models, the teacher should walk around to each small group (or visit each breakout room) to hear their ideas of what a virus is and ask questions about each small groups’ initial model design.
The second half of the class period is devoted to a gallery walk (or screen share) to see each group’s idea of how a virus can spread globally. Each small group should compare and contrast their models with other models. Members of each group can do this verbally by speaking with each other or by using whiteboards or paper to write down observations of each model. Students can also provide feedback or ask questions about the different models. The feedback should be constructive, yet supportive. Students use sticky notes (or chat comments) to write feedback or questions to place on the initial models. Students share the ideas in their initial models about how the virus spreads and may give answers such as, “touching surfaces without washing hands,” “traveling on an airplane while sick,” and “being around someone who has been sick.” These models are revised throughout the unit, and final versions of the models are presented at the end of the unit along with students’ explanations through an infographic.
Part 2: Virus introduction and simulation
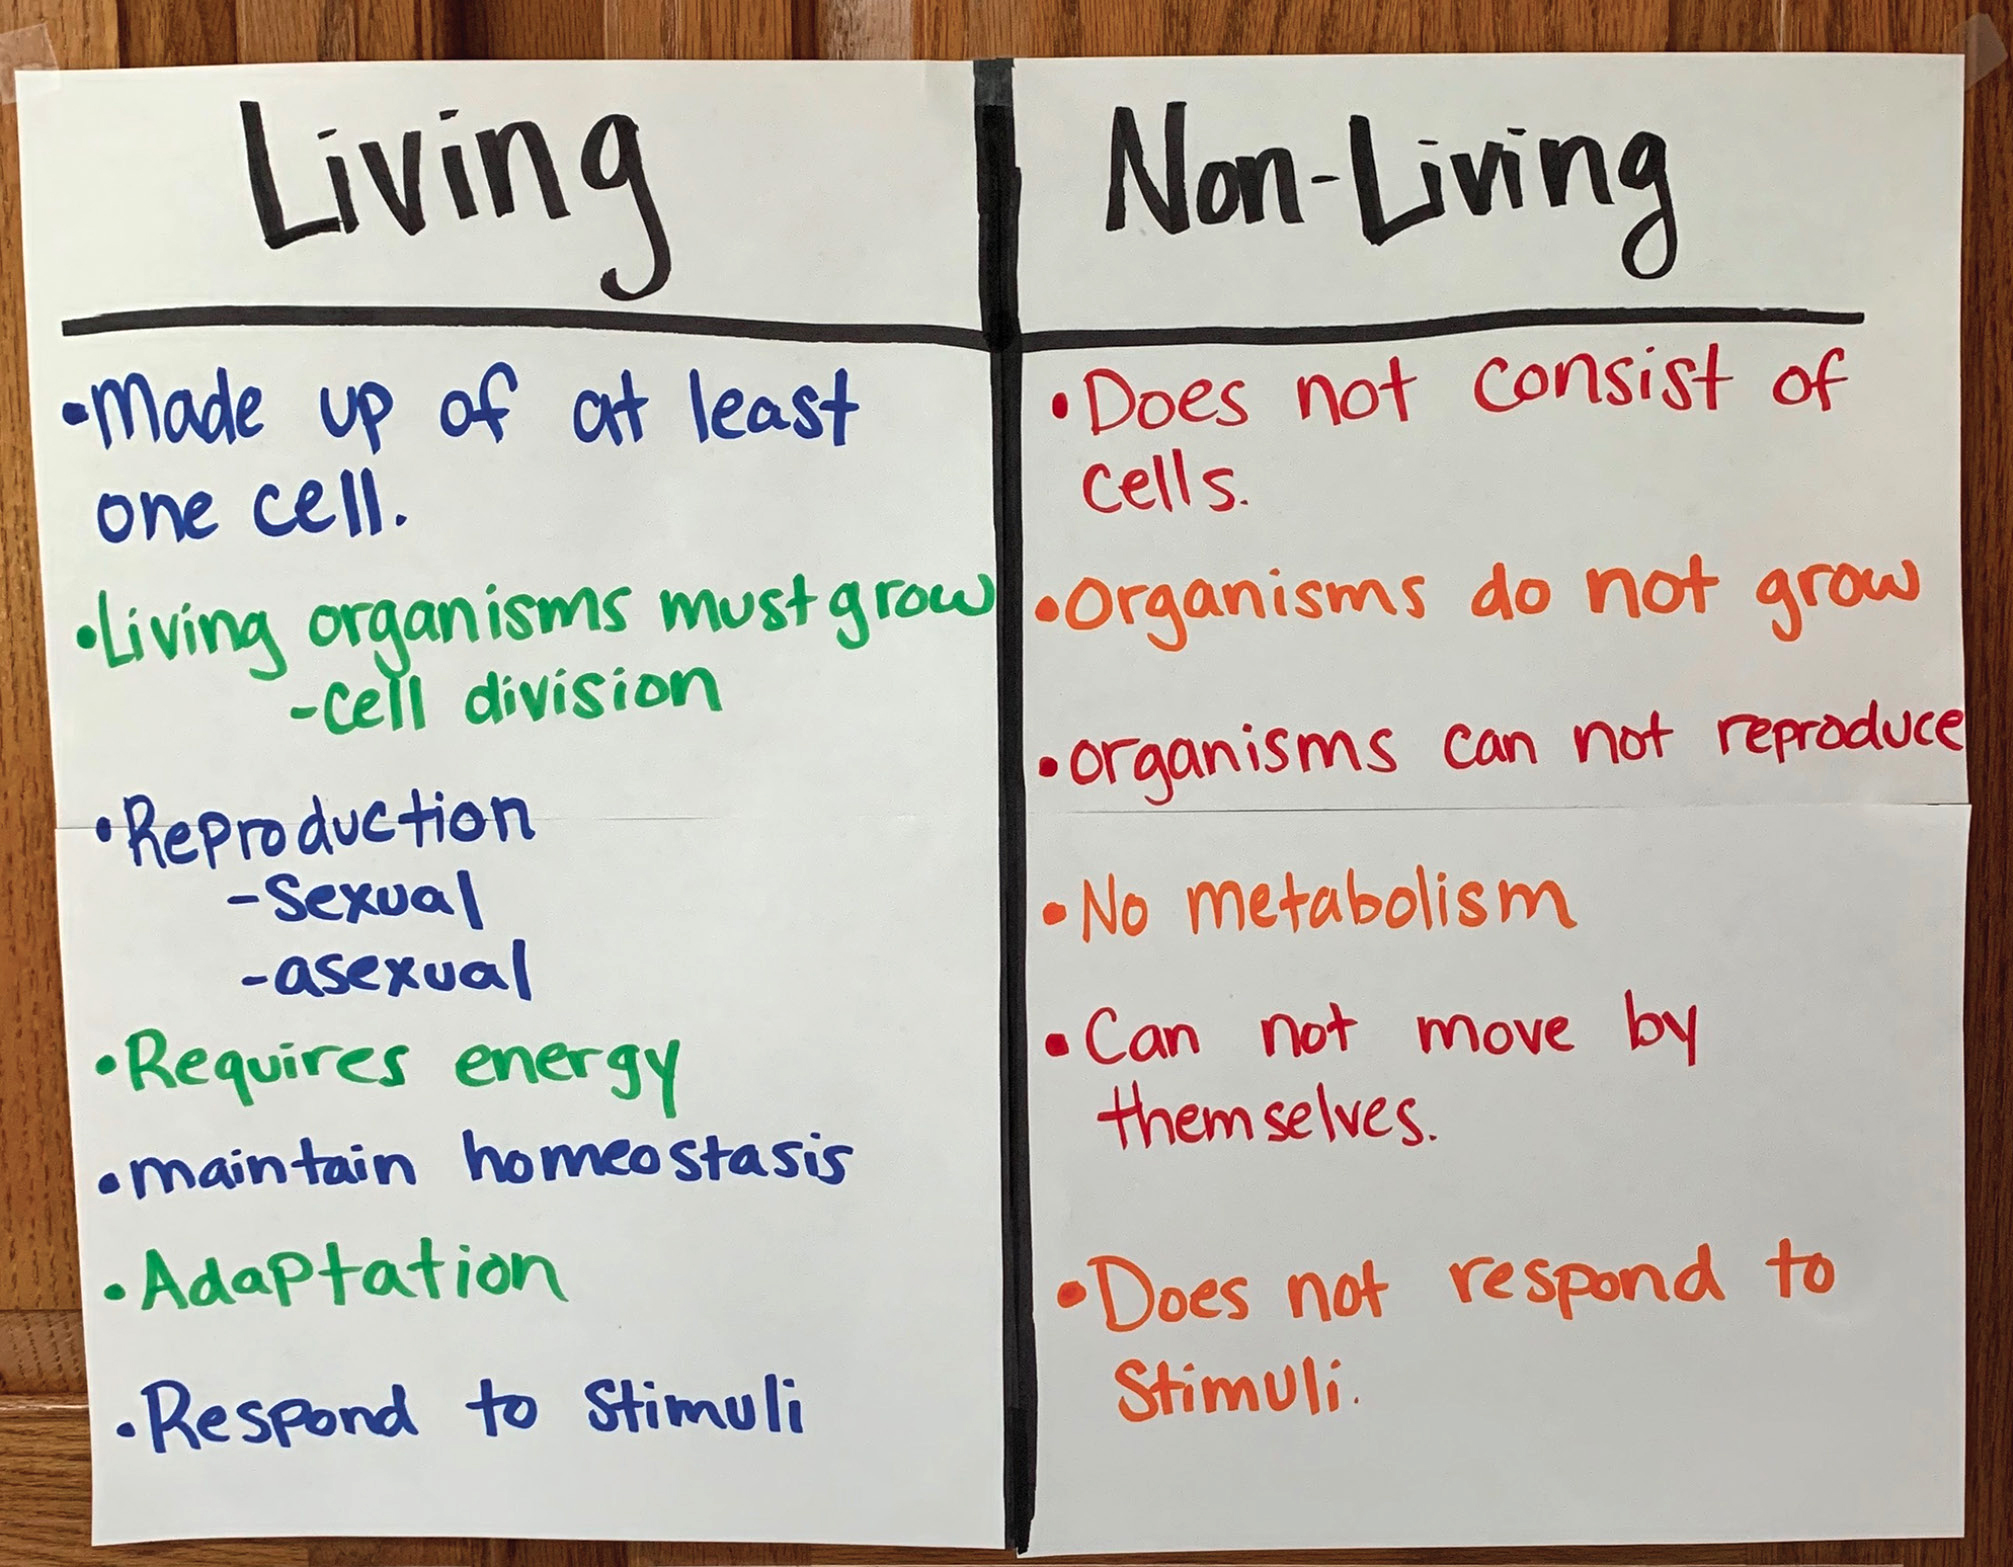
On the second day of the unit, students learn what a virus is and why it is considered a nonliving organism. The lesson question for this day is, “Are viruses considered a living organism?” The teacher can introduce the lesson question by asking the class, “Many of us had questions about viruses and we aren’t in agreement about how they make us sick. Does it make sense to answer the question ‘Are viruses a living organism?’ next?” Having a short class discussion on whether this is the right next question can be fruitful for moving the lesson forward. The class then focuses on creating a T chart table contrasting living organisms with nonliving organisms (see Figure 1). Students should develop an understanding of the disciplinary core idea that all living things are made up of cells. If this unit is taught prior to a cells and living organisms unit, then additional investigations may need to be added to help students develop this understanding that all living things are made up of cells. If this unit is taught following a cells and living organisms unit, then students can develop their own tables as a review of previous learning before the whole group develops its table. Including this table in the unit allows students to have the understanding that viruses are nonliving and must have host cells to survive and replicate. Students are formatively assessed on their understanding by completing an exit ticket at the end of class.
| Table 2. Examples of infographic resources for students. | ||||||||
|---|---|---|---|---|---|---|---|---|
|
On day 3 of the unit, the lesson questions include, “How do viruses spread so quickly?” and “How do viruses, like the coronavirus, spread globally?” To introduce the lesson to students, the teacher poses the following question: “We are wondering how viruses spread so quickly. Should we investigate this next?” Students typically have a good idea of what causes a virus to get on their hands or around them, but teachers can deepen student thinking by asking, “How does the virus get into our system?” This question gets students thinking about what happens internally that causes humans to get sick. Using this question, the teacher prompts students to think about the previous day’s table on living and nonliving organisms. Students do a “think-pair-share” with shoulder partners (or in breakout rooms online) to think about how a virus gets into our system causing us to get sick. Students then share out their ideas and thinking. For example, some groups may say, “The virus gets inside us through our mouth, nose, or eyes.” Teachers can then have students do another “think-pair-share” with different shoulder partners (or breakout rooms) to think about what a virus does once it has entered our body through our mouth, nose, or eyes. This elicits critical-thinking skills, and students begin thinking about a virus needing a living host cell to survive.
Students use the online Interactivate Spread of Disease simulation (see Online Resources) to manipulate the spread of a virus throughout a population (see also the student activity sheet in Supplemental Materials). Students can manipulate population size, spreading, and other parameters and view a human population graph. The simulation shows the amount of time the population becomes susceptible, gets ill, recovers, and becomes susceptible again. To investigate viral replication on the cellular level, students could also use the Gizmos Virus Lytic Cycle (see Online Resources) simulation to show the virus entering the cell, replicating, and releasing to infect other cells; however, this simulation has a fee. This may require more class time, but can be a valuable extension. If your school or district does not have the resources to use Gizmos, another free option would be to have students watch an animation of the lytic cycle (see Online Resources). Using simulations allows students to visualize abstract scientific concepts and develop a more in-depth understanding of what is occurring at a micro and/or macro level (Chiu, DeJaegher, and Chao 2015). Simulations also provide multiple representations to support students with different learning needs.
Part 3: Student explanations
On the fourth day of the unit, students return to their initial models. Students revise their model using evidence from their knowledge and understanding of science ideas and the simulation they have developed in the unit, incorporating the feedback from their peers during the first gallery walk. Students also add evidence that supports their final model from instruction and additional classroom resources on the topic (see Table 2). Students revise the initial models to show what a virus is and how it can spread quickly and globally and then answer the driving question: “What causes a virus to spread globally?” Teachers circulate around the room (or through breakout rooms) as students are working on their revised models to formatively assess and provide feedback.
On the last day of the unit, the teacher asks students, “How can we prevent the spread of infectious diseases?” Students, in small groups, now create an infographic using either Prezi, Canva, PiktoChart, PowerPoint, or paper to present models along with a strategy to prevent the spread of infectious diseases (see Table 2). When students design their own infographic, they can effectively show their understanding. If students are not familiar with infographics or have not created or used them before, the teacher may need to take more time to help students identify important aspects of an infographic and aid them in thinking through the creation. Students may also use the online resources provided in Table 2, such as the John Hopkins University resource page, to study other coronavirus models and trends. Davidson (2014) provided an excellent example of an introductory lesson to infographics, which you can use if you are unfamiliar with this teaching strategy. As students design their infographics, they should also consider their target audience; if they are using images of people, they will need to show equal representation within the infographic so that all viewers see people like themselves. Each group then presents how their ideas changed from the initial model to the final model. Students also present ideas and strategies they would use to prevent another viral pandemic.
Assessment
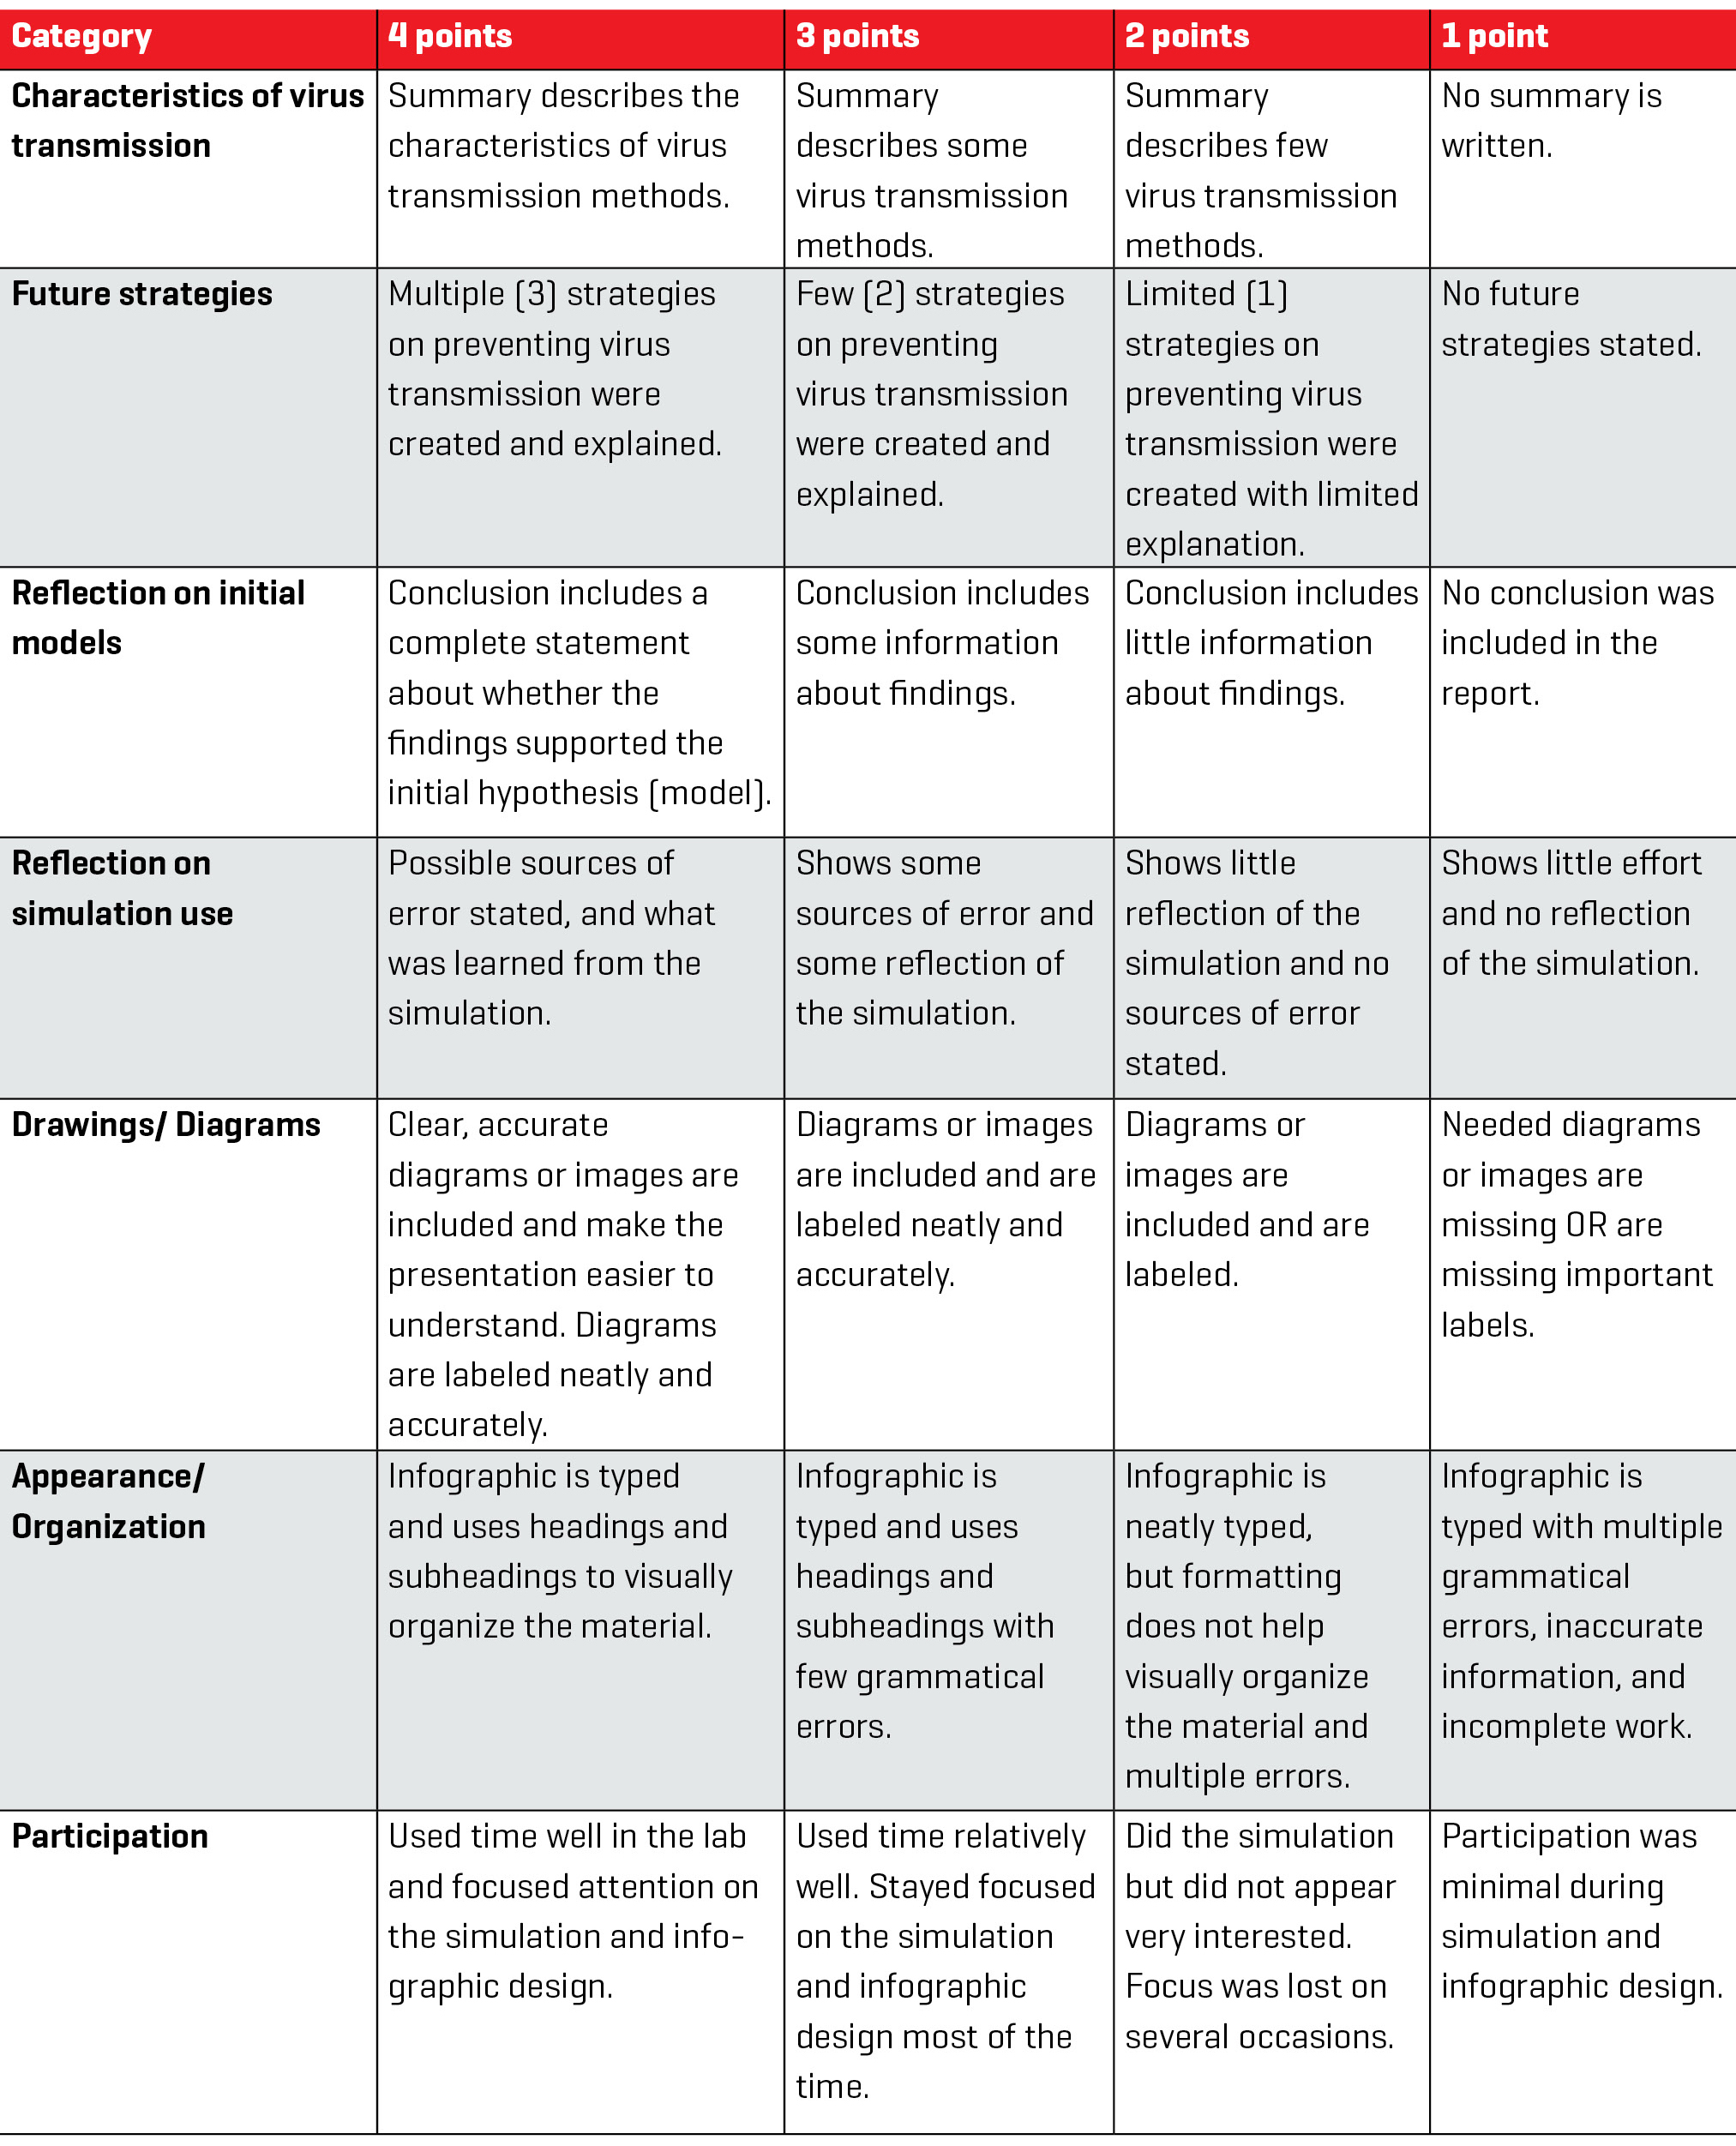
Students are assessed on the information and organization of the infographic using a rubric (see Table 3). This summative assessment is meant to assess not only their knowledge of the science content, but also their ability to communicate scientific ideas (drawings/diagrams and appearance/organization) and collaborate with others (participation). Teachers can also use different forms of formative assessments each day throughout this unit, such as exit tickets, think-pair-share, group circulation, discussions, and self-assessments or peer assessments. These formative assessments can be used to evaluate students’ understanding and ideas about the concepts to see if additional instruction or intervention is needed during the lessons. Through formative assessments students can express their thinking throughout each day of the unit and be assessed on the content without impacting their final grade.
Cautions about the science and the nature of science
As the science of coronavirus is still being developed, it is critical for teachers to also read and more deeply understand what scientists understand about coronavirus prior to teaching this lesson. For example, between when this article was initially submitted and revised, our understanding of whether individuals can be reinfected with the coronavirus has changed multiple times and scientists now have a clearer understanding of this issue, though this may change between this revision and when the article is published. Depending on what scientists ultimately determine, the susceptibility rate in the online module would be affected. If not properly taught, the lesson could reinforce common yet incorrect ideas students hold about these concepts. In addition, this may be an opportunity to discuss with students important aspects of the nature of science, specifically that scientific knowledge is based on empirical evidence and scientific knowledge is open to revision in light of new evidence. Learning about the coronavirus provides an opportunity for students to understand how scientific knowledge develops in a real-time, authentic, relevant context.
Tips for going online
When using this unit remotely, teachers can use the following tips on classroom management and time efficiency. Online platforms such as Zoom, Google Classroom, Canvas, and Blackboard all have breakout room features. If you have never used breakout rooms before, a quick search on these platforms’ help sites will provide tutorials or walk you through their use. We suggest teachers group students into breakout rooms to work on simulations in small groups. If classes are larger, breakout rooms can have larger groups (six to eight students) rather than multiple small groups as a way of effectively managing students through the activity. Alternatively, the simulation could be used as a whole class and breakout rooms could only be used for discussion about what was observed and to develop arguments in larger groups. Table 1 includes suggestions for structuring the class to help teachers with time management. The total number of breakout rooms the teacher uses will determine how long the teacher visits each breakout room. The teacher should visit each room to answer questions and promote student thinking throughout the exploration questions and scenarios.
If you are using an online platform that does not have a breakout room feature, students can work through the simulation as a whole group, on their own, or as a homework assignment, and have a whole-group discussion after the activity. Teachers can also enforce guidelines for students to ensure student safety online. This may include students using only the resources provided in Table 2. In addition, if the lesson is happening in the classroom, then teachers can ensure that students only open web browsers for the purpose of the lesson and do not engage with social media or other distractions. Teachers may also remind students about other important aspects of internet safety, including but not limited to the following: protecting login information, not sharing passwords (except from parents and guardians), using appropriate language, and installing teacher and parental controls when and where appropriate. If the student is learning online, teachers can send these helpful reminders to parents as they support their students.
Conclusion
Students understand that viruses make us sick, but oftentimes do not know the process a virus takes to survive once it enters the human body. Once students develop this understanding, they can determine how a virus spreads within a country or globally. By integrating simulations and infographics in this unit, students can visually see the process a virus takes to survive and determine how a virus infects and spreads. Students will be more engaged in the learning process by using simulations and infographics to investigate, create, and strategize a preventative plan to keep viruses from spreading (Chiu, DeJaegher, and Chao 2015; Linn et al. 2010). This mini unit allows students to actively participate in the learning process through discussion with peers and listening to each group’s explanation. In addition, the models students create allow for students to visually see their ideas and how their ideas change throughout the unit. •
Online Resources
Animation of the lytic cycle—https://www.biointeractive.org/classroom-resources/viral-life-cycle
Gizmos Virus Lytic Cycle—https://www.explorelearning.com/index.cfm?method=cResource.dspDetail&ResourceID=448
Interactivate Spread of Disease simulation—http://www.shodor.org/interactivate/activities/SpreadofDisease/
Supplemental Materials
Laura C. Todd (lctodd@olemiss.edu) is a graduate assistant in the Department of Teaching and Learning at the University of Mississippi in Oxford, Mississippi. Brooke A. Whitworth (bwhitwo@clemson.edu) is an associate professor of science education in the Department of Teaching and Learning at Clemson University in Clemson, South Carolina.
Biology Life Science Literacy Teaching Strategies Middle School