
feature
Under the Sea
Promoting Visual Literacy Through Image Analysis
Science Scope—July/August 2021 (Volume 44, Issue 6)
By Jayma Koval, Sabrina Grossman, and Marion Usselman
CONTENT AREA Life Science, Environmental Science
GRADE LEVEL 6–8
BIG IDEA/UNIT Students quantify and analyze time-series photographs of deep-sea coral using standardized rubrics and coding to reveal the ecological effects after the Deepwater Horizon oil spill.
ESSENTIAL PRE-EXISTING KNOWLEDGE None needed
TIME REQUIRED Six 50-minute class periods
COST Cost range: from $50-$100 to purchase markers and transparencies
SAFETY General classroom safety
All was not well on the offshore oil well drilling unit called the Deepwater Horizon on the evening of April 20, 2010. The electric lights flickered, and the workers felt two sharp vibrations. They knew something was very wrong. Then a large bubble of methane gas escaped from the oil well they were drilling on the ocean floor. It shot up the drill column and exploded, engulfing the drilling rig in flames. The 126 crew members had less than five minutes to escape. Lifeboats and helicopters rescued 115, but 11 workers were killed. And 5,000 feet below, one of the largest environmental disasters in U.S. history was just beginning. The broken oil well, called the Macondo Well, was spewing massive amounts of crude oil into the waters of the Gulf of Mexico and couldn’t be stopped.
So begins Under the Sea: A Deep-Sea Ecosystem Challenge, a week-long middle school science module that promotes visual literacy within the context of ecology and the interdependence of living things. Using time-series photographs of deep-sea coral, taken over a five-year period by the ECOGIG multi-institutional research team, Under the Sea introduces students to the concept that photographs and other visual images can be a rich source of scientific data and explores the quantification of nonnumerical data through the use of standardized rubrics, coding, digitization, and artificial intelligence. In the process, students learn about scientific inference and use the spatial and temporal evidence they have analyzed to construct an explanation about the recovery of the corals over time. The module emphasizes collaborative learning, and students work in groups of three through much of the experience.
Under the Sea was developed as part of AMP-IT-UP, a National Science Foundation Math and Science Partnership project, and ECOGIG, a Gulf of Mexico Research Initiative. Like all AMP-IT-UP modules, Under the Sea follows the BSCS 5E instructional model that is based on the constructivist theory of learning and allows for students to construct their own knowledge based on experiences (Bybee et al. 2006). The AMP-IT-UP curriculum materials consist of weeklong science and mathematics modules that were created and revised based on over five years of implementation and student and teacher-level data collection at diverse middle schools in a rural fringe public school district. All 18 modules and associated materials are free to download (see link for AMP-IT-UP in Online Resources).
Engage: The Deepwater Horizon accident
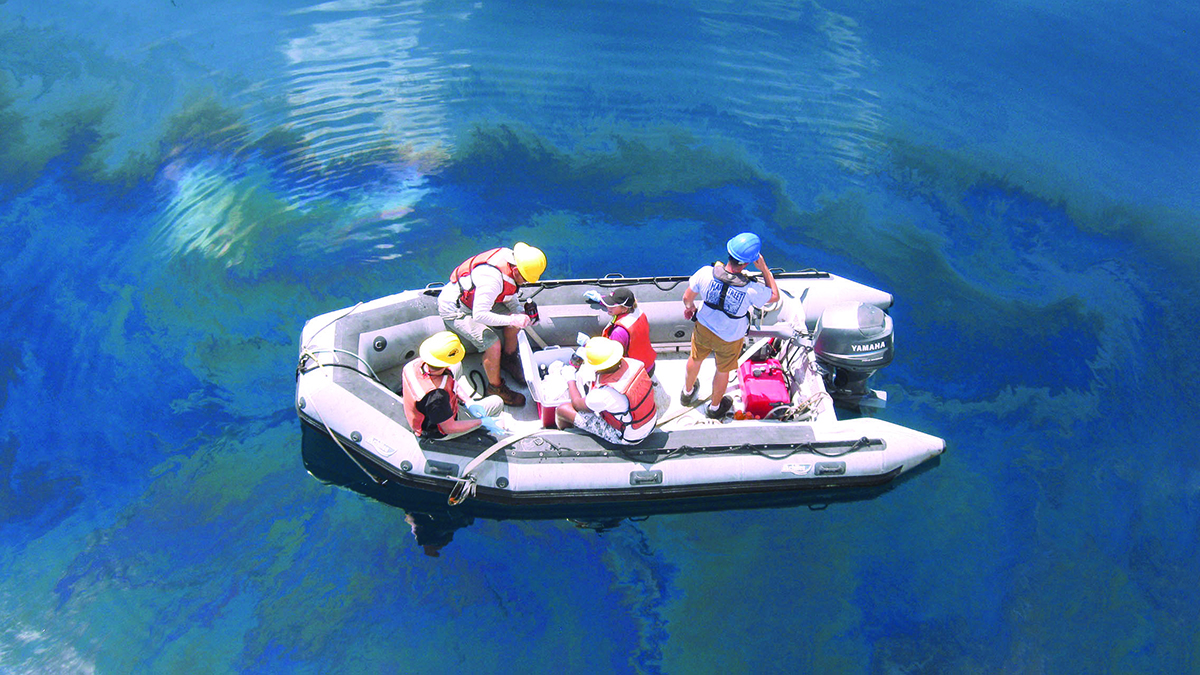
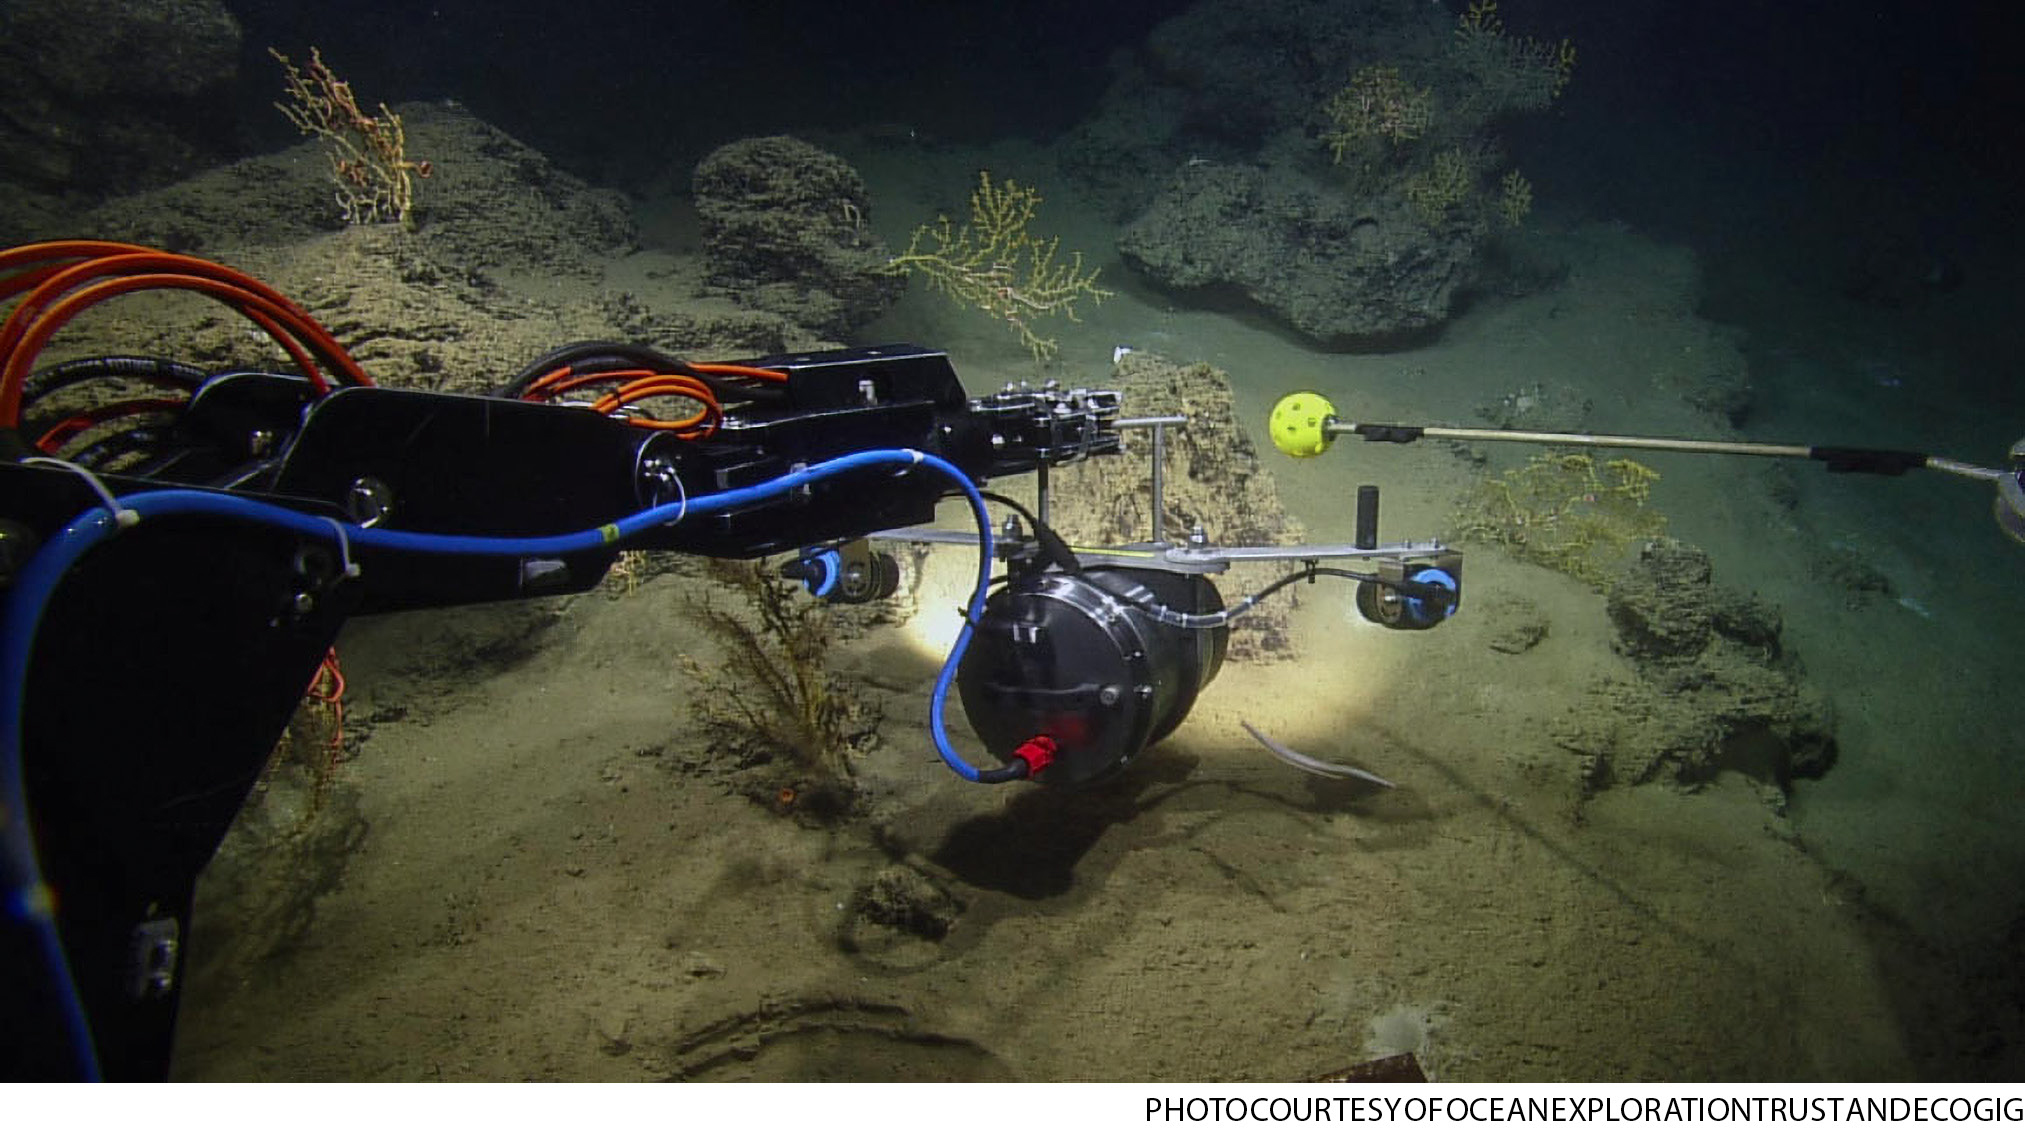
The Under the Sea module initially captures students’ interest by introducing them to the Deepwater Horizon oil spill, an environmental disaster that occurred in 2010 in the Gulf of Mexico. Students view videos of news accounts about the accident and about the ECOGIG team of oceanographers, marine biologists, and chemists that investigated the damage from the oil spill and subsequent clean-up efforts. The research team used special remote-controlled vehicles to take photographs of slow-growing corals that live 5,000 feet below the surface of the Gulf of Mexico (see Figure 1). The team photographed the same coral each year for six years to evaluate how the health of the coral changed over time after the explosion. Students are then challenged with helping ECOGIG researchers determine whether the coral is recovering. But an important question is posed: How can you do that with a bunch of photos? The class engages in a discussion about what types of information or data can be gleaned from photographs and why it is important to take pictures of the same coral every year.
Explore 1: Analyzing images
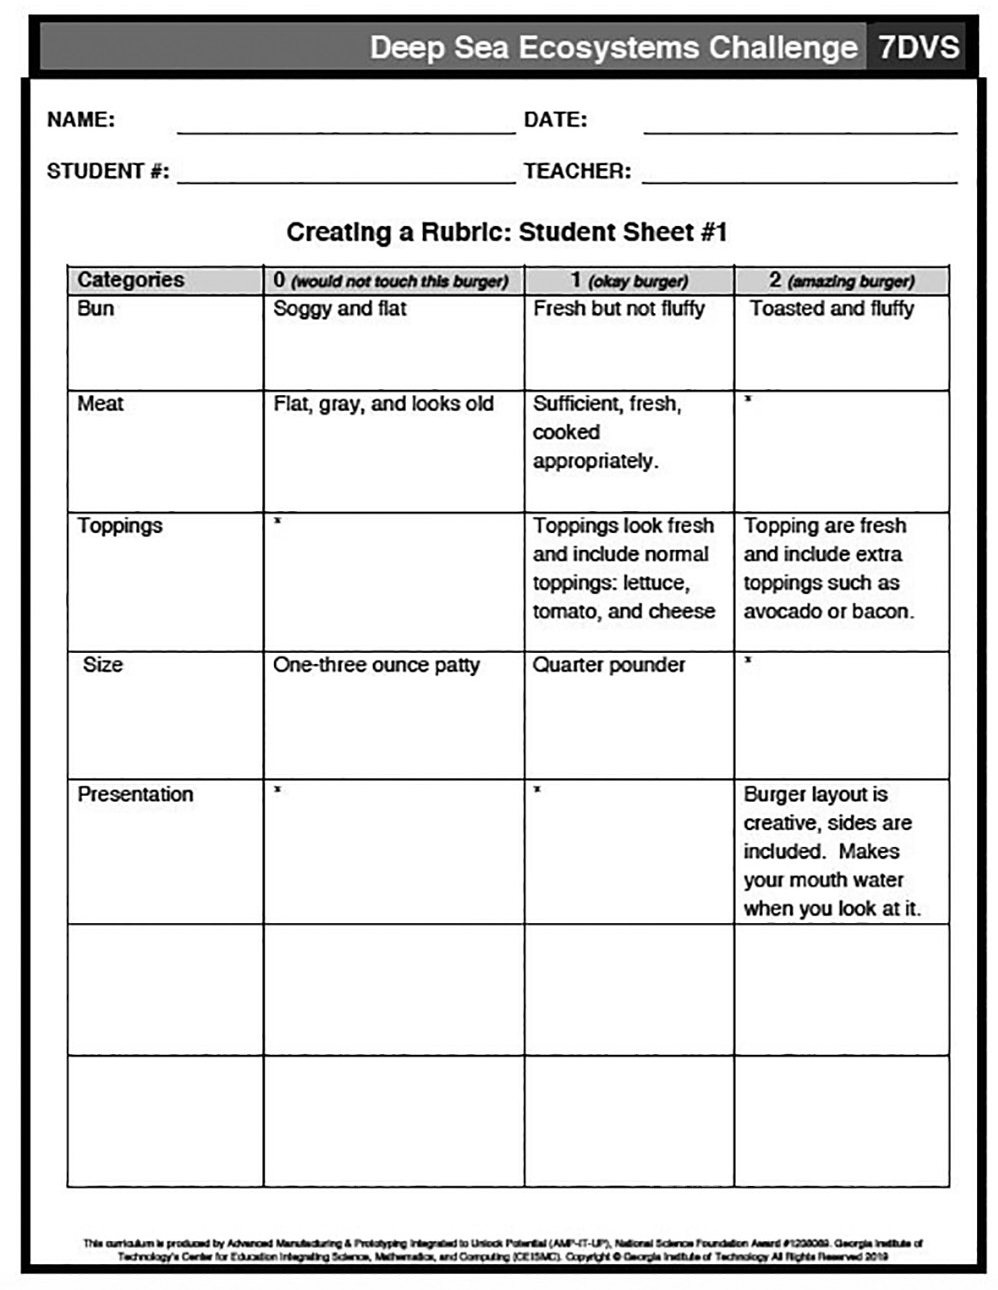
In the first Explore phase, students begin to confront how to analyze photographic images in a standardized way and are introduced to the concept of inference. As a Think-Pair-Share activity, students analyze and describe a picture of a hamburger and discuss whether they can infer from the picture how the hamburger will taste. Hamburgers were selected for this activity because of how familiar they are to students. By analyzing a familiar object, students can focus their attention on learning how to discern information from an image. This scaffolding will allow students to apply their knowledge to more complex scientific images. They progress from verbal descriptions to a simple 1–10 rating scale and then engage in a discussion about how to change nonnumerical data into numerical data in a way that is reproducible and systematic. The text introduces the concept of rubrics and their design, and working as a class, students complete a scaffolded rubric on Creating a Rubric: Student Sheet #1 (see Figure 2) that they will use to analyze images of hamburgers. Then, working in their groups, students apply that rubric to evaluate and compare two additional photographs of hamburgers. This activity could also be facilitated as a class discussion depending on student understanding of rubrics. Students then tally the scores on a subsequent student page.
Explain 1: Studying coral communities
During the first Explain phase, students learn more about the ecology of the diverse and complex deep-sea ecosystem, including the presence of biotic and abiotic factors and diverse benthic organisms. They watch a video about the remotely operated vehicles (ROVs) that ECOGIG uses to collect data and examine photos from scientists that show changes to the coral after the Deepwater Horizon accident. ECOGIG scientists found oil extending 10 to 15 miles away from the well explosion, including areas with heavily damaged communities of coral. Students learn that the presence of floc and hydroids, and abnormal brittle star behavior, are indicators that the coral is not healthy. This section is a combination of teacher-facilitated discussion and independent student reading. It contains science content and key terms that are highlighted in the text, critical to understanding the deep-sea ecosystem and recovery efforts. Struggling readers will benefit from engaging vocabulary strategies such as graphic organizers and knowledge ratings (Taylor et al. 2009). The sections could also be read aloud as a class and discussed.
Explore 2: Evaluating the health of coral communities
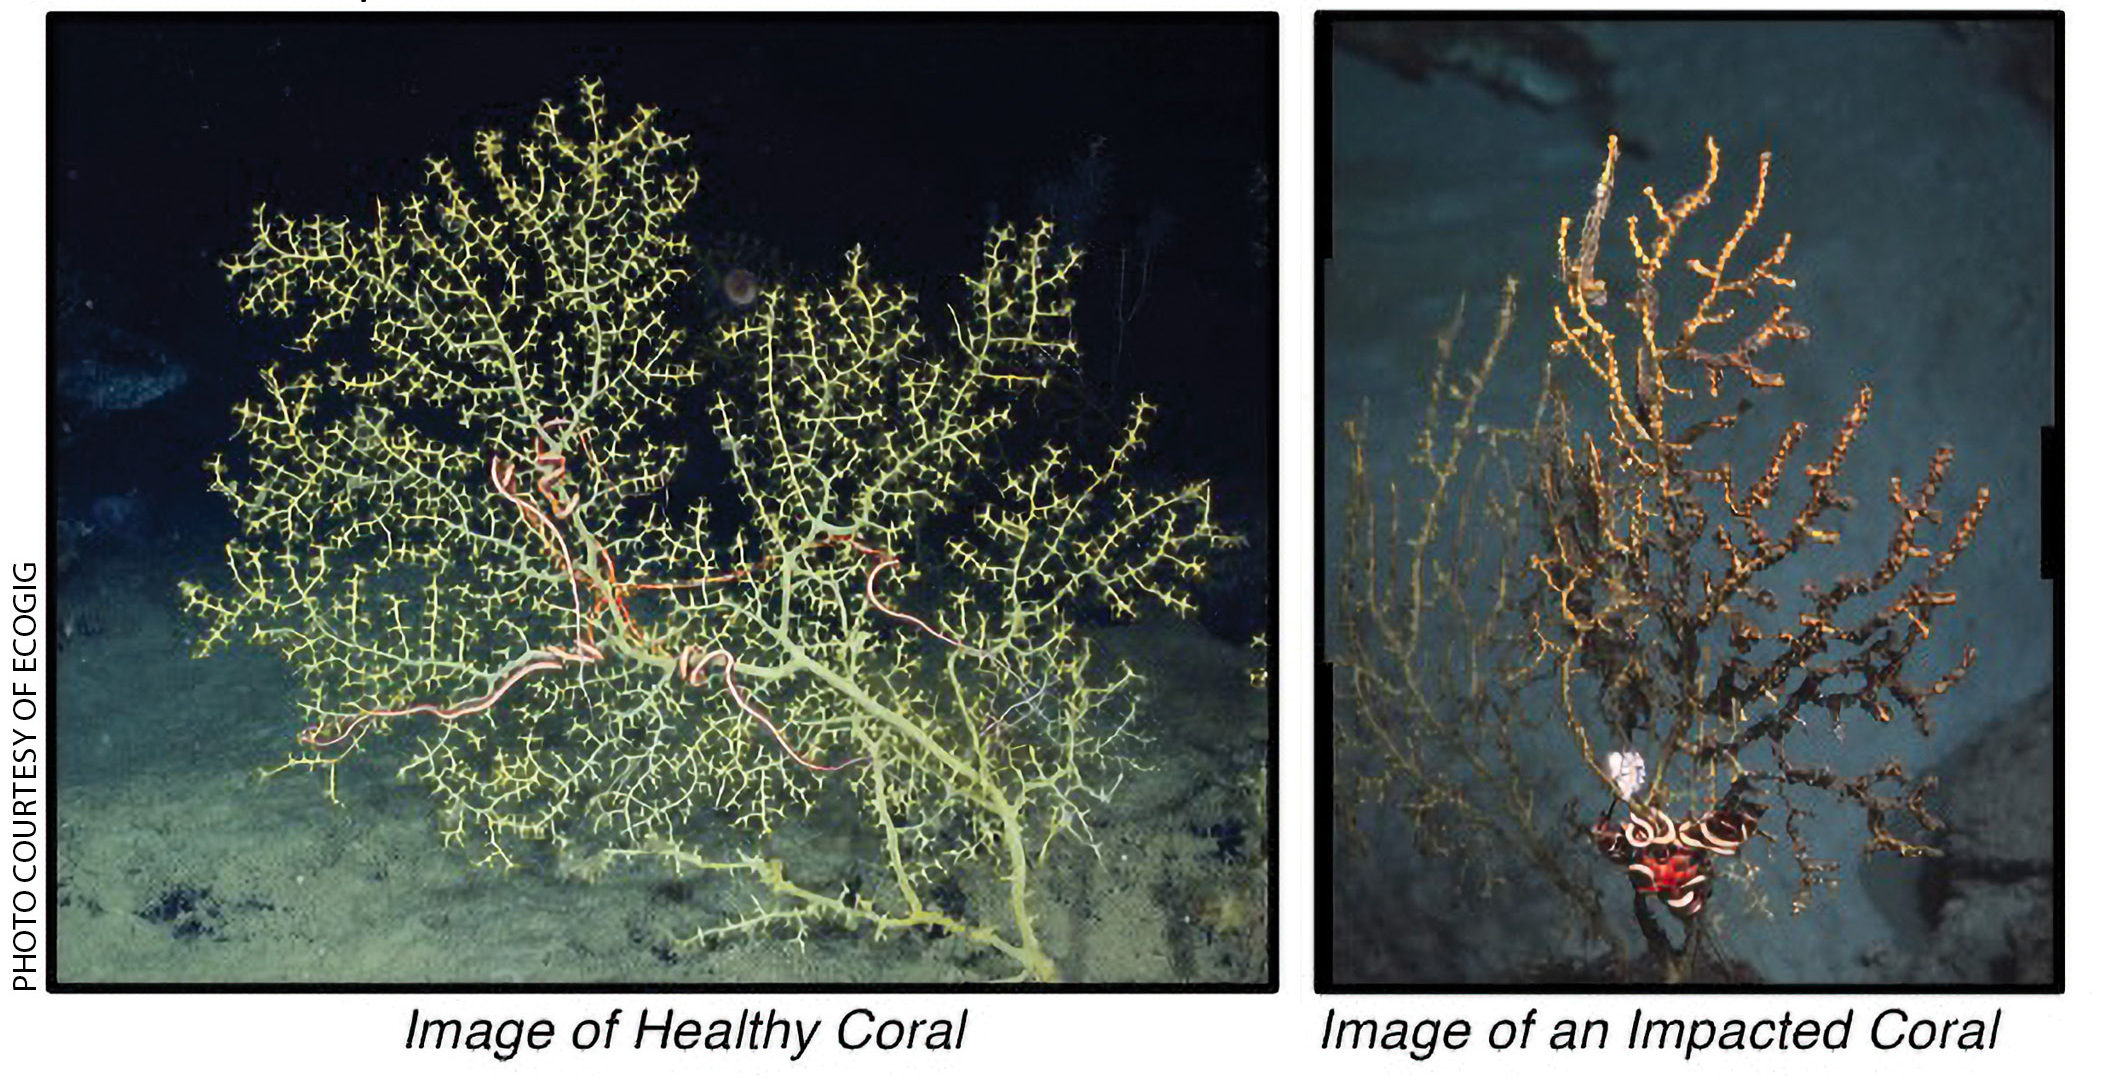
Students return to the challenge of investigating the health of corals on the ocean floor and watch a video about the diversity of deep-sea coral. Working with their groups, they analyze images of healthy and unhealthy coral (see Figure 3) and generate a list of characteristics, such as color, that distinguish the two. Then, using these characteristics, they brainstorm as a class a standardized rubric for determining the health of the coral.
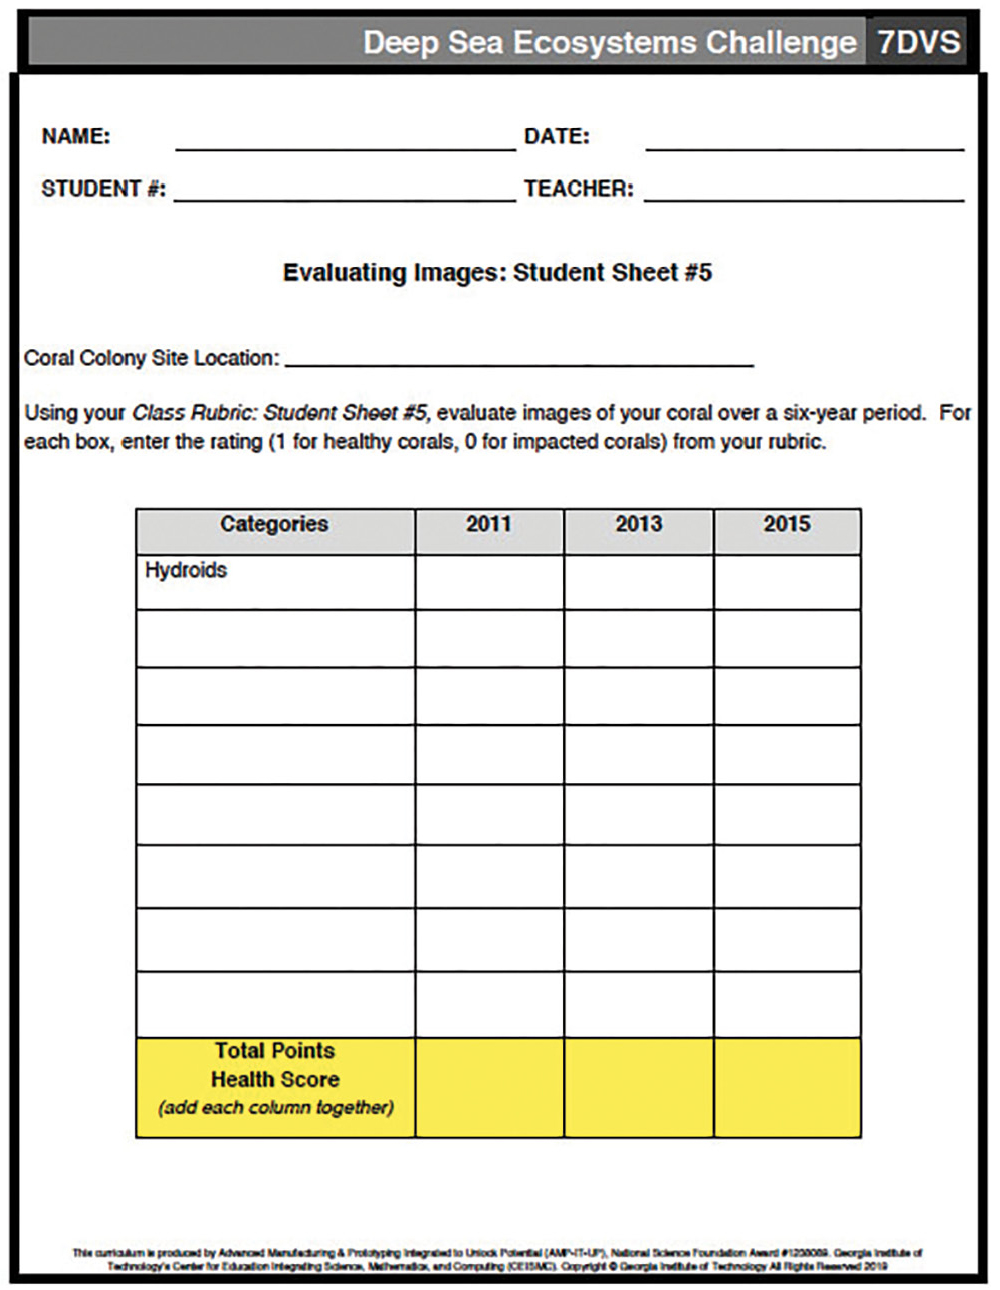
The ECOGIG scientists have made available time-series photographs from three research sites (A, B, and C), located at different distances from the Macondo wellhead. Each time series has a photograph from 2011, 2013, and 2015. Student groups use the three time-stamped images from their assigned site and their standardized rubric (see Supplemental Materials for the standardized rubric for analyzing healthy and impacted coral). To determine a “heath score” for their site for each year (see Figure 4), students score each rubric category (e.g., color) either as a 1, if it matches the description for healthy coral (bright yellow), or a 0 if it matches the description for unhealthy coral (white/gray). If students struggle between a 1 and a 0 rating, they are required to make their best guess, rather than give half of a point. After completing this exercise for each of the three photos for their site, students add up their numbers for each category and determine the health score for each image. A lower score indicates more damage, and a higher score indicates healthier or recovering coral. Using these scores, students are asked to infer whether the corals in their site are recovering over time. To assess whether recovery differs by site location, students share their findings with the rest of the class and engage in a class discussion about the data—what inferences can be drawn and what factors might be impacting coral recovery. Multiple groups evaluate the same site and have the opportunity to compare scores. This leads to interesting discussions about how to evaluate images and how visuals can be interpreted differently depending on the viewer’s perspective.
Explain 2: Remembering Deepwater Horizon
During a short second Explain phase, students watch a video on the lasting effects of the Deepwater Horizon accident and the impacts it has had on the ecosystem and the coastal economy. Then, building on their experiences with analyzing the health of the coral over time and space, students learn the difference between temporal and spatial data. Having an understanding of why data is analyzed over time (temporal) and space (spatial) to make conclusions is a very important concept in this module and is also key to the Next Generation Science Standards (NGSS) Science and Engineering Practice of Analyzing and Interpreting Data (NGSS Lead States 2013). While this module explores the recovery of deep-sea coral as a result of the Deepwater Horizon oil spill, teachers could engage in the same sequence of activities, but focus them instead on other examples of temporal and spatial data, such as time-series photos of glacial melt or forest recovery after a fire. Challenging students with other examples of temporal change can also be used as a way to assess students’ ability to transfer knowledge from the module.
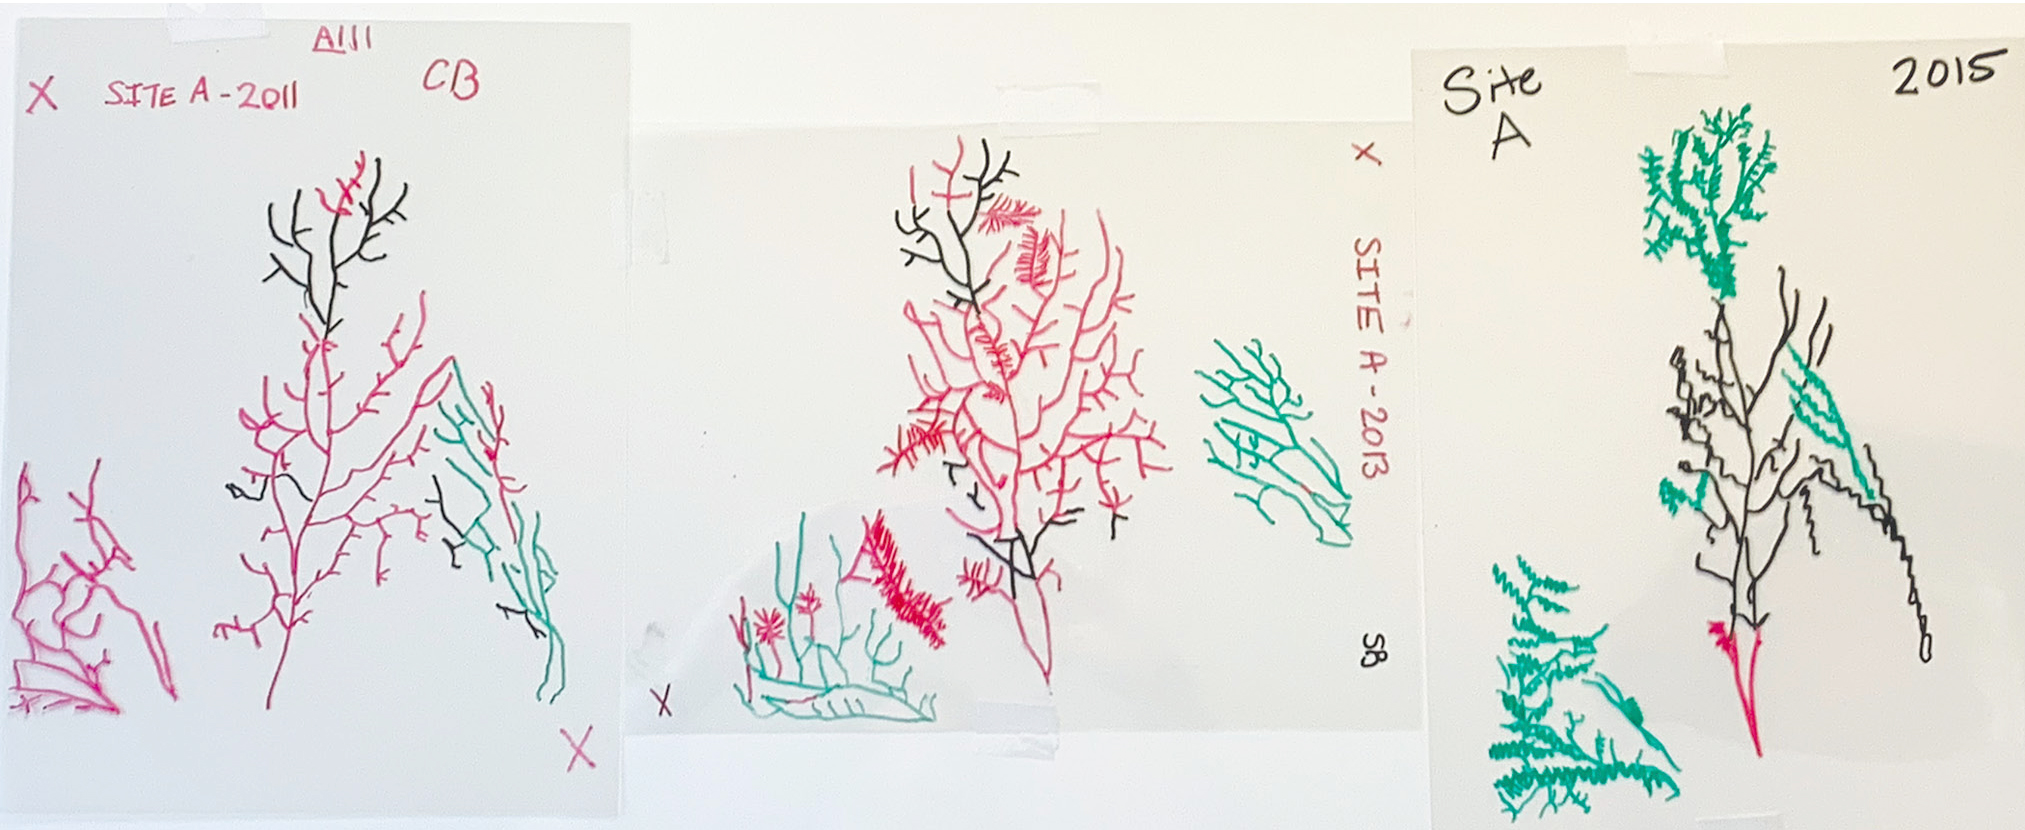
Elaborate: Making more meaning out of data: Coding corals
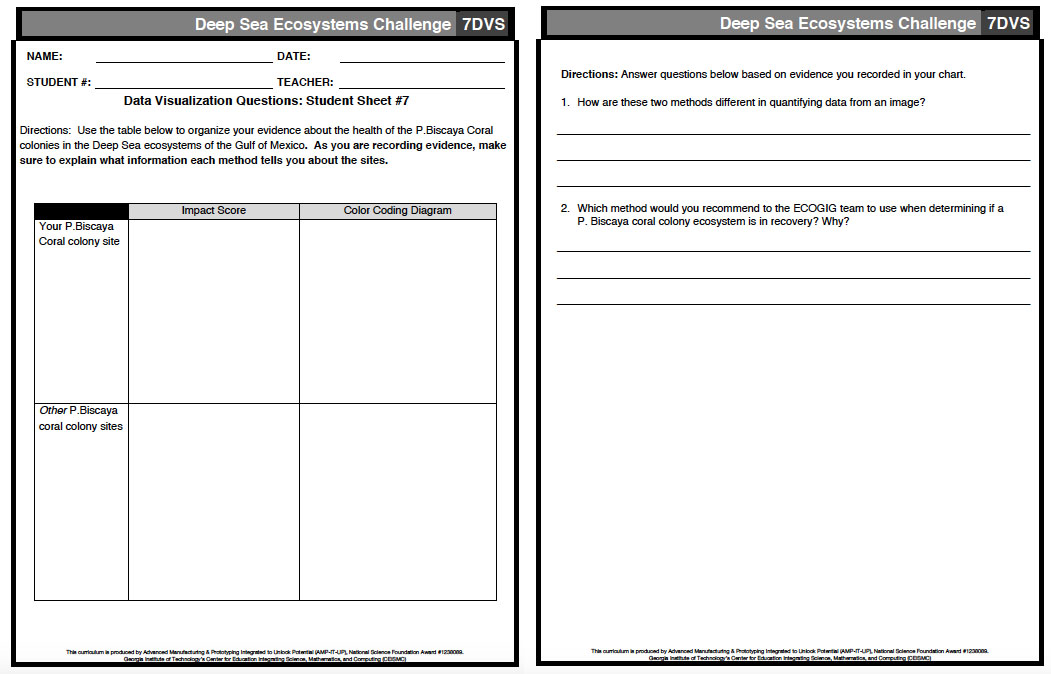
After analyzing their photographic images using the “health score” rubric in the previous activity, students realize that this simple numerical score only describes the general health of the coral and that it is possible for two very different images to have the same health score. Students are introduced to a new way of analyzing the health of the coral by color coding the images using clear transparencies and wet erase markers in three colors (this activity can be easily modified to accommodate students with visual impairment. Different colored markers can be used as needed and the images could also be enlarged on a projector and traced on a whiteboard instead of a transparency). Students place the transparencies over the coral photographs and use their markers to trace unhealthy branches in red, healthy branches in green, and areas of recovery in black. They are able to infer the health of the sections of coral by examining the images for the presence of hydroids, branching, polyp extensions, yellow color, and sclerites, which are small structures that grow on the skeleton of a coral to provide it support and protection. This method provides a way to visualize the data that can make it much easier for people to discern the health and recovery of the coral. After completing their color coding, students organize their images in order by time and look for recovery trends (see Figure 5). Groups then tape their transparencies and health scores around the classroom and participate in a gallery walk to observe the other sites. This gives students clearer insight into how the health of the corals has progressed over time and space and which locations were most affected. The student and teacher editions of the text include discussion questions to guide the conversation about trends that are evident in the data and about the differences between the color-coding method of analyzing the pictures compared to using the rubric.
This activity provides students with a striking visual representation of the changes in the coral over time. It also provides an entry for introducing students to the concepts of computer digitization, artificial intelligence, and machine learning. While this module does not take the next step and ask students to use computers to analyze their images, which would allow them to accurately calculate percentages of unhealthy, recovering or healthy coral, that is an extension that classrooms with the necessary technology could make. The module does introduce students to the idea that images can be analyzed by computers using artificial intelligence and that computers can be “taught” to recognize important characteristics in an image, such as the differences between healthy and unhealthy coral, or between healthy and diseased lungs, through the process of machine learning.
Evaluate: The recovery effort
The summative assessment for this challenge asks students to use what they have learned to construct an explanation that describes the recovery of the deep-sea corals based on their proximity to the wellhead and the time elapsed after the spill. In their explanations, students give a description of coral recovery using both temporal and spatial variables, evidence to support the description of health, a description of the process that was used to obtain that evidence, and a conclusion that includes predictions for future recovery of their corals. Students rely on the information they previously recorded on their student pages to help craft their explanations (see student worksheet for organizing evidence about the recovery of the coral in Supplemental Materials).
Conclusion
The Under the Sea module promotes visual literacy within the context of ecology and the interdependence of living things. The module provides students with authentic experiences for understanding ecological content and analyzing and interpreting data. All of the curriculum materials for Under the Sea are available and free to download (see link in Online Resources). •
Acknowledgments
We thank the following people for contributions during the development and assessment of the Under the Sea module: The educators from Griffin-Spalding School System, Annalisa Bracco and the ECOGIG Consortium, Meltem Alemdar, Jessica Gale, Sunni Newton, Stefanie Wind, William Jimerson, Mary Levine, James-Addis Hill, and Steven Taylor. Under the Sea was developed as part of AMP-IT-UP, an NSF Math and Science Partnership project (NSF #1238089).
Online Resoures
AMP-IT-UP—https://resources.ceismc.gatech.edu/amp
Under the Sea curriculum—https://resources.ceismc.gatech.edu/amp/deep-sea
Supplemental Materials
Standardized rubric for analyzing healthy and impacted coral
Student worksheet for organizing evidence
Jayma Koval (jayma.koval@ceismc.gatech.edu) is a research associate, Sabrina Grossman is a program director, and Marion Usselman is an associate director, all at the Center for Education Integrating Science, Mathematics, and Computing (CEISMC) at the Georgia Institute of Technology in Atlanta, Georgia.
Biology Interdisciplinary Literacy Technology Middle School