
feature
Using Big Data to Understand the History of Planet Earth
The Paleobiology Database
CONTENT AREA Earth and Space Science
GRADE LEVEL 6–8
BIG IDEA/UNIT Big data can be used to explain Earth’s history.
ESSENTIAL PRE-EXISTING KNOWLEDGE Familiarity with the classification and nomenclature of organisms and the geologic timescale
TIME REQUIRED Two to three 50-minute sessions
COST No cost
SAFETY No special safety concerns
Have you heard the term big data? Big data seems to be at the center of a lot of people’s attention as high volumes of diverse data are continuously generated, collected, and now easily accessed via the internet. When students work with big data they participate in authentic science, practice as scientists, and engage with the momentum of the data revolution. Because analyzing and interpreting data is an important aspect of “doing science,” this process is identified as one of eight Science and Engineering Practices in the Next Generation Science Standards (NGSS Lead States 2013). Large agencies such as the National Oceanic and Atmospheric Administration (NOAA), the United States Geologic Survey (USGS), the National Aeronautics and Space Administration (NASA), and the Environmental Protection Agency (EPA) collect, process, and make freely available vast quantities of scientific data.
One example of a large database is the Paleobiology Database (PBDB), a nongovernmental, nonprofit data repository for paleontologists that contains published data on fossils and includes a user-friendly navigator tool to provide free access to the public (see link to the PBDB in Online Resources). Lesson plans and educational activities that use the PBDB facilitate bringing big data into the classroom. Here we highlight one of these lessons (which can be found under the resource tab on the main page of the PBDB website) and the modifications we made to create an exciting instructional sequence that builds student knowledge of Earth’s place in the universe.
Background
Organized and maintained by paleontologists, the PBDB (see Online Resources) provides easy access to worldwide fossil data for organisms of all geological ages with the purpose of encouraging research collaborations that test interesting hypotheses. For example, one hypothesis might be that fish are less vulnerable to global change stressors than to marine invertebrates. Vázquez and Clapham (2017) of the University of California at Santa Cruz tested this hypothesis and published their results in the journal Geology. Using data from the PBDB, they analyzed the extinction rates of fossil fish and marine invertebrates from the Permian through Early Jurassic Periods. Overall, they found that the response to global change was different between the two groups; the fish had broader environmental tolerance, which helped their survival. This helps us understand how modern marine organisms might be stressed by ocean warming, pH reduction, and deoxygenation.
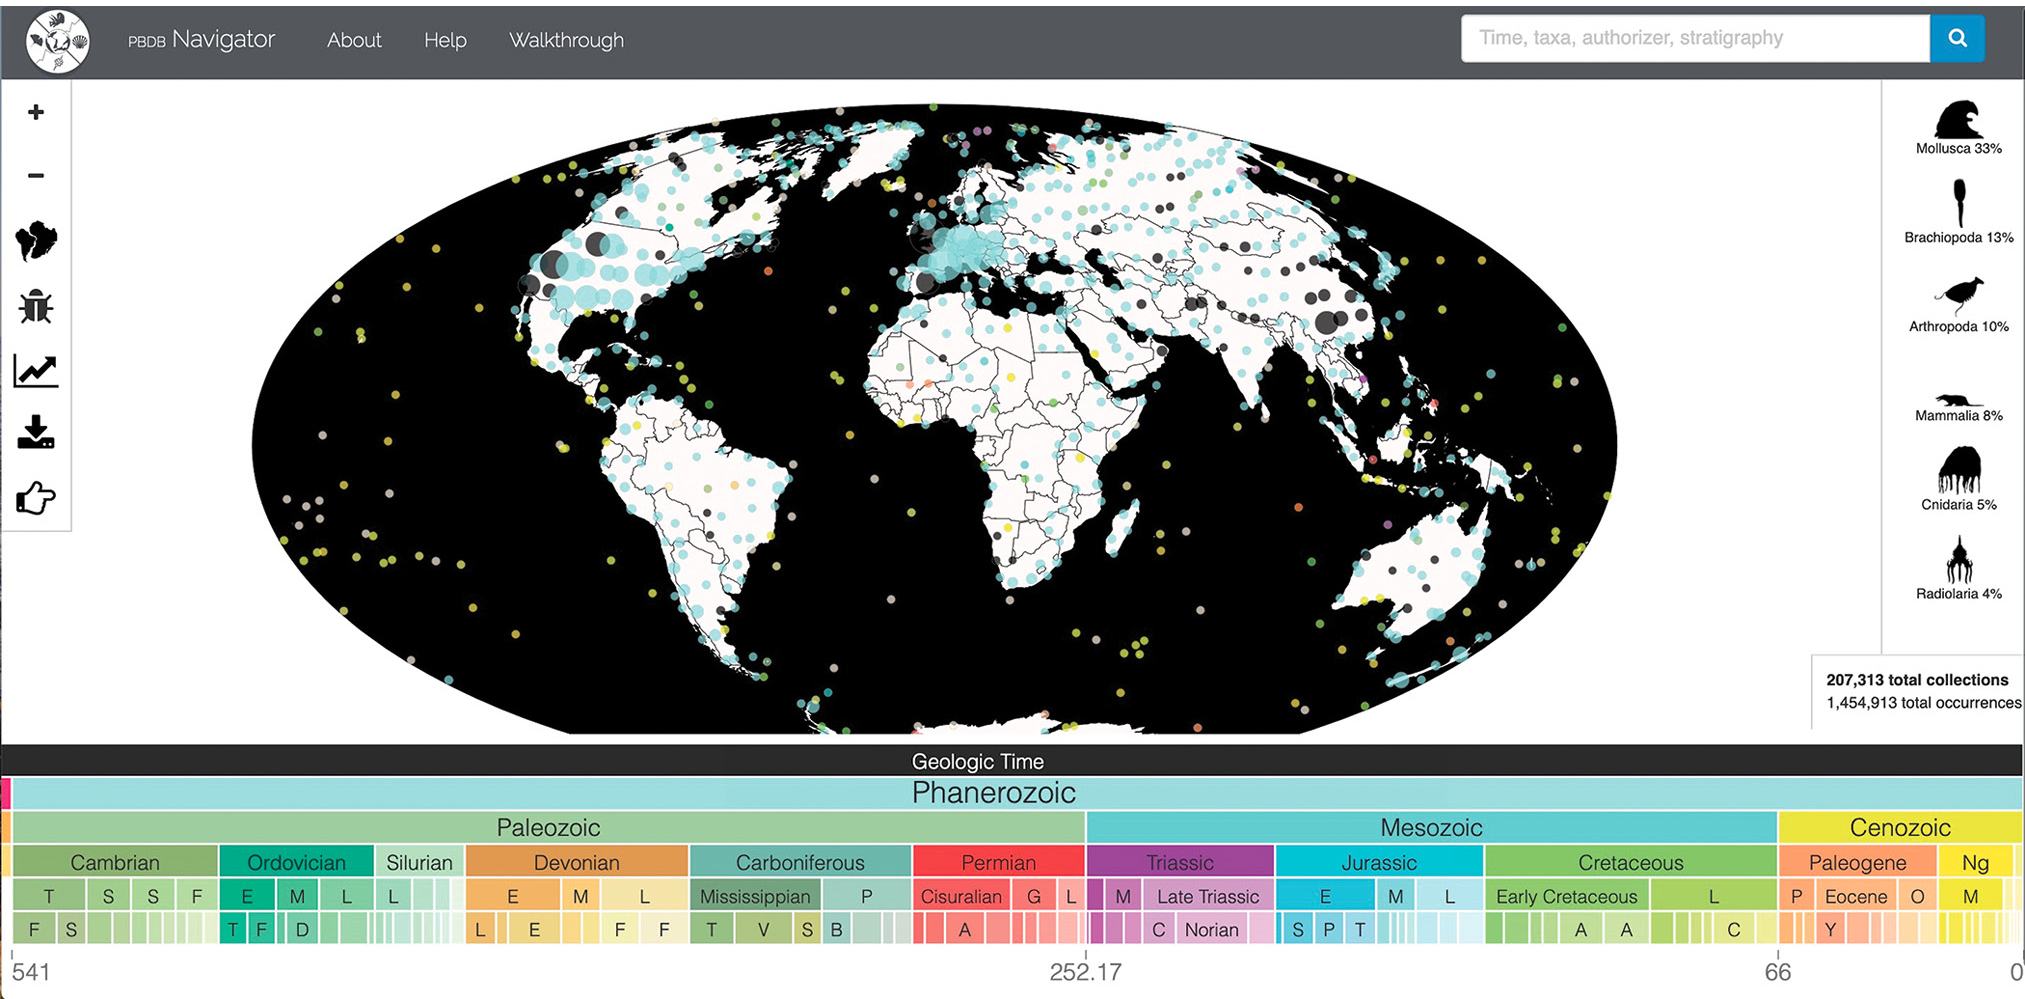
This highlights the usefulness of big data. These large data sets provide a sufficient volume of data necessary to draw valid conclusions. The PBDB contains data on fossil collections including latitude and longitude, geologic age, depositional environment, fossil size and class, collection method, and references to scientific papers associated with each collection. These data can be downloaded and analyzed. However, the data can also be explored through an application developed for and hosted on the PBDB website called the PBDB Navigator (see Figure 1). This remarkable tool efficiently facilitates bringing “big data” into the classroom where students can use it as evidence for constructing explanations and advancing ideas. It is with an introduction to the PBDB Navigator that we begin our description of a 5E lesson that addresses MS-ESS1-4: Construct a scientific explanation based on evidence from rock strata for how the geologic time scale is used to organize Earth’s 4.6-billion-year-old history.
Advance preparation
If you want to learn more about fossils, rock strata, and the geologic time scale, please see Supplemental Materials for background information for educators. To learn how to use the PBDB Navigator, there is an excellent YouTube video available that introduces the PBDB Navigator and provides a tutorial for its use (see Online Resources). We suggest that you watch the video ahead of time so that you are prepared to best guide students. Our own experience revealed that there is a learning curve associated with using the PBDB Navigator, and it is beneficial to know the nuances of its use ahead of time. We did not use the video with students because it covers material quickly and includes more detail than needed. However, the video could be viewed by advanced students, who after practicing could serve as tutors for struggling students.
To familiarize students with the PBDB Navigator, we used the Fossils Under Your Feet lesson that is linked on the PBDB resources page (see Online Resources). In addition to providing an appropriate introduction to the PBDB, this enhanced student excitement about fossils and increased engagement by connecting students to fossils found in their local area. We began by projecting the PBDB Navigator onto a screen in the front of the classroom so that students could follow as we demonstrated its functions. We also provided our students with a Delving Into the Database instruction sheet (see Supplemental Materials) and followed with time for students to explore on their own as we informally assessed their progress and provided additional assistance as needed. Students worked together in small groups to share strategies and support one another. Preparing students with these activities will likely take an additional class period (~50 minutes) before the start of the main lesson.
We modified elements of the Life through Time lesson (George 2017) that is linked on the PBDB resources page for use in our middle school classroom and share them here (see Life through Time in Online Resources for link to original lesson). The concepts addressed in the lesson require students to have prior knowledge of taxonomy and the geologic timescale. Although taxonomy is not explicitly addressed in the NGSS for middle school, it could be incorporated as part of MS-LS4-1: Analyze and interpret data for patterns in the fossil record that document the existence, diversity, extinction, and change-of-life forms throughout the history of life on Earth under the assumption that natural laws operate today as in the past. Similarly, the assessment boundary for MS-ESS1-4 states: “Assessment does not include recalling the names of specific periods or epochs and events within them.” However, because the geologic timescale is a prominent feature of the PBDB Navigator, an introduction to the geologic timescale will greatly enhance students’ experience interacting with the PBDB.
We found that each component of the following 5E lesson plan took 20–30 minutes. You can lump or split lesson components as necessary to meet the length of your class meetings. The entire lesson sequence will likely take at least two class periods (~50 minutes each). In our case, each student had access to a laptop computer and interacted with the PBDB individually; however, discussion occurred in small groups of four to six students. For classrooms without access to individual computers, students can work in pairs or small groups; the PBDB Navigator application also works on devices such as tablets and smartphones. No special safety precautions are needed for the lesson. You can find a key and rubric for responses to items as well as key vocabulary included in the lesson in Supplemental Materials.
Engage
To fully understand the lesson, students need to be familiar with sediment deposition and the formation of rock strata. We engaged our students in these concepts using a laundry hamper analogy. Imagine a laundry hamper is emptied of all clothes on Sunday. It is now Saturday and another week’s worth of laundry has piled up. Where would the dirty clothes from Monday (oldest) be? Where would the clothes from Friday (youngest) be? You can extend this analogy with different scenarios. Imagine that a dirty sports jersey is needed for a game and pulled out from in between the layers (a missing layer, maybe due to erosion). Perhaps someone turned the hamper upside down and dumped all the clothes out, overturning or folding the original “layers.” Possibly someone left something in a pocket—a receipt from lunch on Tuesday—that was deposited with the clothes/layers and can be used better estimate the day that “layer” accumulated in the laundry hamper.
You can role-play these scenarios with students and an actual hamper. Students can take turns putting articles of clothing (extra jackets, sweaters, etc.) into the hamper on different “days.” Some articles of clothing might conceal items in the pockets that can be discovered and used for more precise estimations. You might throw in a few small plastic toy animals to represent fossils. This role play can include events that cause overturning of layers and additional deposition. Following the role play, you can ask students how depositing clothes in a hamper might be like the formation of sedimentary rock strata and the fossils found within. This—done as individual written response, think-pair-share, or small group discussion—will reveal student conceptions and prepare students to describe the process in their own words later on the student handout.
Explore
The purpose of the Explore phase of the lesson is for students to use the PBDB to build ideas about how organisms have changed over the course of Earth’s history. Students work with the PBDB Navigator to respond to the following:
- Choose three geologic periods. For each period, record the scientific names of the three most abundant taxa.
- Which of the time units you selected were the most distinct from one another?
- How many years passed between these two units of time? Explain why this makes sense based on your answer above.
- How does this relate to the role that evolution has played in the history of life?
- The Phanerozoic Eon contains three geologic eras. What are they?
By clicking on different time units on the geologic time scale found at the bottom of the PBDB Navigator, students will discover that the taxa change in the taxon list on the right of the PBDB Navigator screen (see Figure 1). (A taxon is a general grouping of any level of organism, such as a genus, family, class or species). The taxa on the right side of the screen are in order from most to least abundant. Through exploration of different time units, students will discover distinctions between different time units, the amount of time that separated these units, and then connect this change to evolutionary processes. You can facilitate this process by pointing out the proliferation of mammals through the Cenozoic Era following the extinction of nonavian dinosaurs. This extinction removed multiple mammalian competitors and predators, allowing for the subsequent evolution of mammals and the wide variety that has existed since.
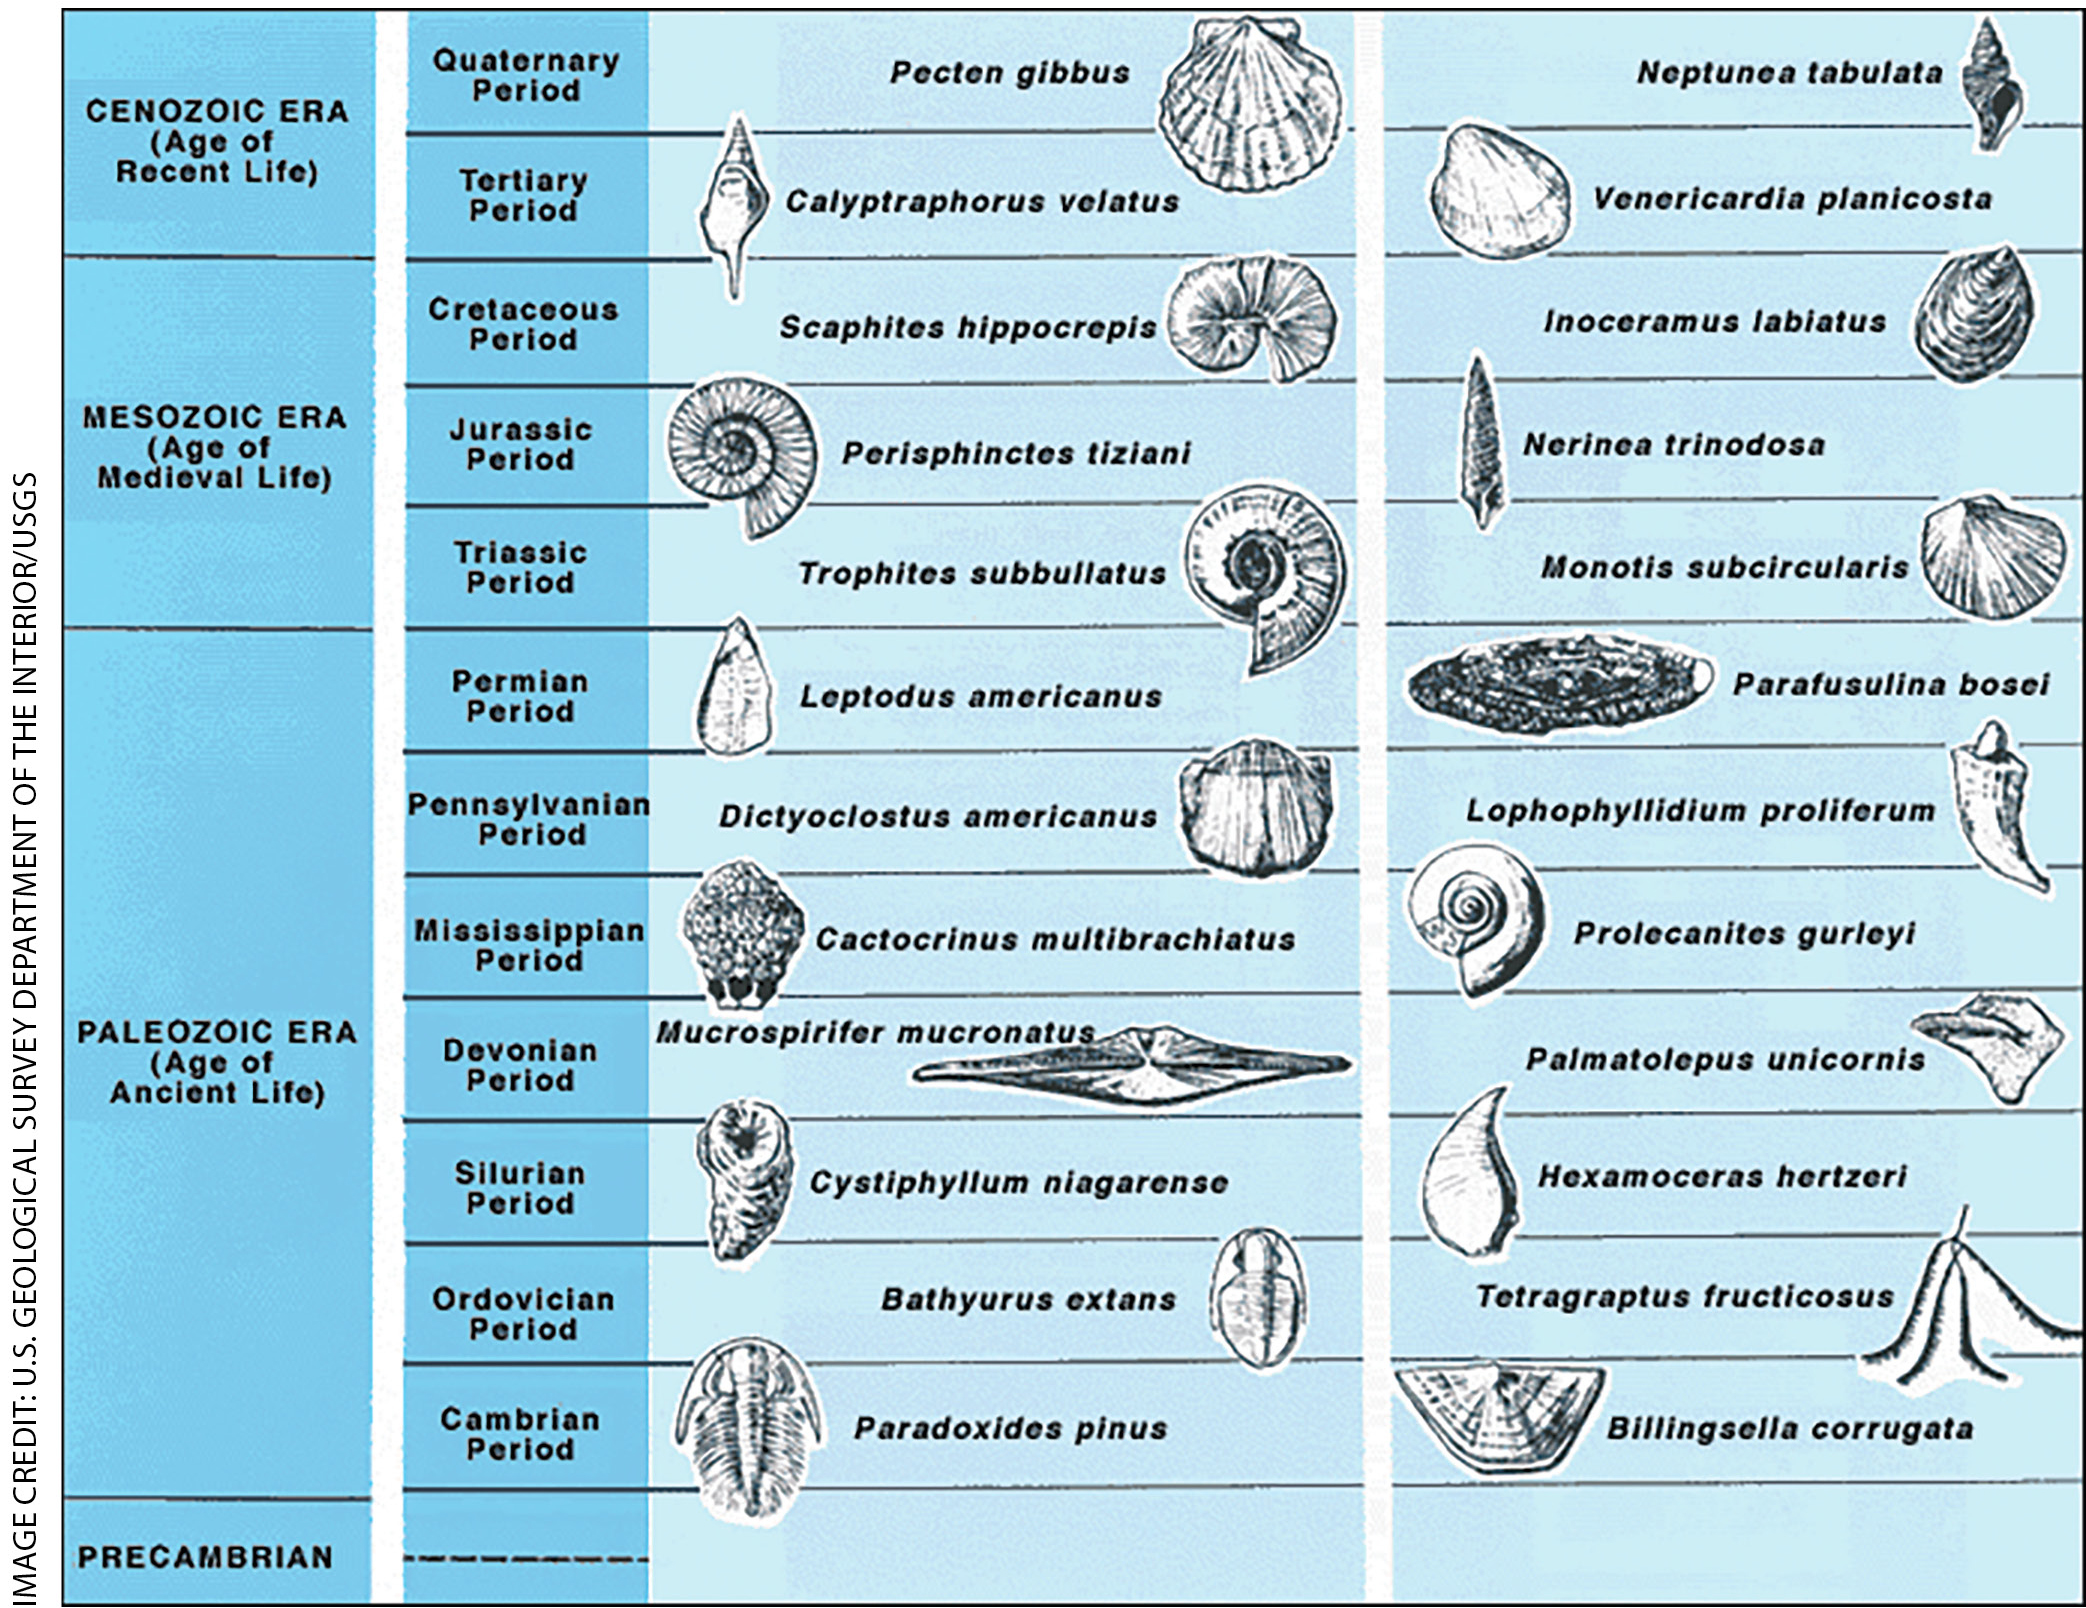
After students complete the questions, we suggest continuing with a teacher-guided discussion of what evidence might be found in rock strata that could be used to distinguish one rock stratum (layer) from another. To do this, we presented students with Figure 2, a chart prepared by the USGS that shows examples of index fossils used as guides to the age of the rocks in which they are found. We asked students, “How is this like the example of the laundry basket?” Students concluded that fossils can be used as evidence of the age of rock strata and as a basis for distinguishing geologic time. We then tasked students with responding in writing to the following: “In your own words, describe what evidence exists within rock strata that could be used to distinguish one geologic era from another.”
Explain
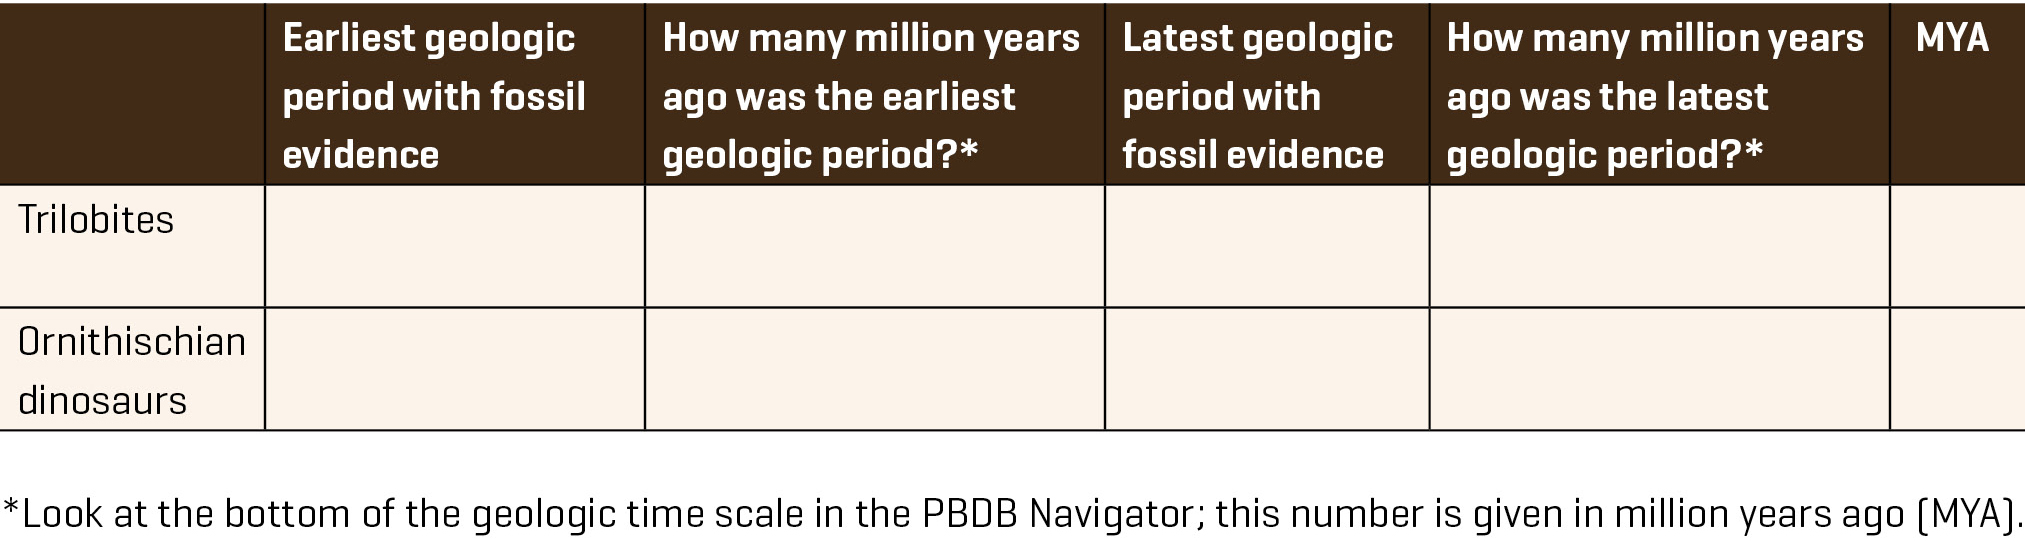
Likely students are aware that nonavian dinosaurs went extinct; however, they may not realize that the end-Cretaceous Period mass extinction was only one of several extinction events throughout Earth’s history. (They also may not realize that modern birds descended from dinosaurs, which presents an opportunity for an interesting foray into this topic.) In the next phase of the lesson, students are introduced to Ornithischia dinosaurs (a group that includes many well-known dinosaurs such as Triceratops and Stegosaurus) and trilobites, which are a group of extinct arthropods, distantly related to insects and crustaceans. By working to respond to the two items (listed on the next page), students first explore the difference in the distribution of Ornithischia in the Cretaceous and Paleogene Periods, finding that whereas the taxon was widely distributed in the Cretaceous Period, it is absent in the Paleogene Period. Students discover a similar pattern to the distribution of trilobites after the Permian Period.
- What is the difference between the distribution of Ornithischia in the Cretaceous and the Paleogene?
- Determine which geologic period has the last fossil evidence of trilobites.
By completing Table 1, students use the appearance and disappearance of Ornithischia dinosaurs and trilobites to determine the earliest and latest geologic periods with evidence of each and calculate a time range for their existence. This will prepare students for a whole-group discussion of their findings and lead to discovery of how time ranges of taxa correspond to time units in the geologic time scale, which provides structure to Earth’s history. Students conclude this section of the activity by independently (or in small groups) searching for species that did and did not make it through the Permian extinction. They can do this by selecting the Permian Period in the geologic time scale at the bottom of the PBDB Navigator and clicking on any of the dots representing fossil collections. By clicking on the occurrences of a collection of their choosing, they can select a taxon, which will create a filter for it. Next, by toggling between the Permian and Triassic Periods on the geologic time scale, students can determine whether organisms belonging to that taxon survived the Permian extinction event. Because approximately 90% of the living genera in the Permian Period did not make it to the Triassic Period, it is fairly simple for students to find taxa that went extinct. Some examples that they might find include Mesosaurs, the first known aquatic reptiles; Miomoptera, an extinct order of insects; or multiple species of mollusks and brachiopods.
Elaborate
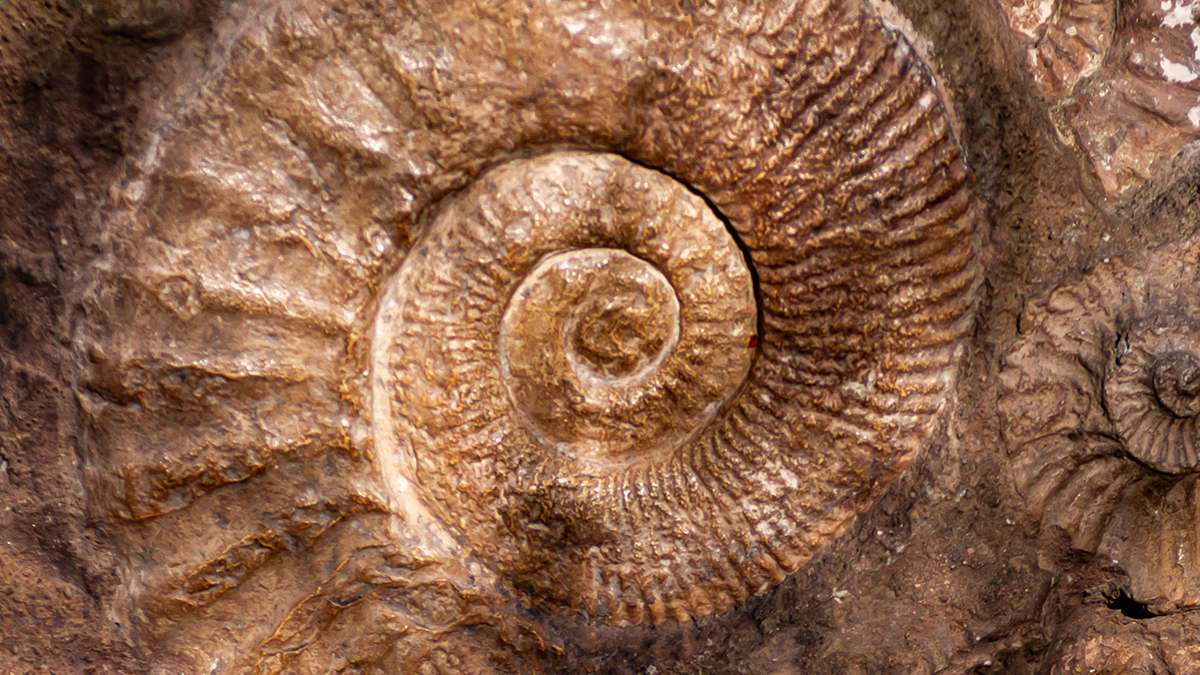
So far, students have considered how evidence from rock strata can be used to organize Earth’s 4.6-billion-year-old history. One way to challenge students’ conceptual understanding is to approach this understanding from another direction. In the Elaborate phase of the lesson, students are asked to explore how fossils can be used to infer the age of surrounding rock, rather than recognize fossils as a way to organize geologic time. This will engage students in analyzing fossil data and selecting appropriate index fossils. Before beginning, you can introduce students to the concept of index fossils, which can be used to determine the age of sediments containing them. Good index fossils are wide ranging (spread across continents), can be found in a variety of habitats, have short geologic ranges (evolved and went extinct within one geologic period), and are easily identifiable. Next students will investigate two fossil types—from the genus Pecten (scallops) and the genus Mariella (ammonites)—to determine their suitability as index fossils. Through completion of Table 2, using information found within the geologic time scale at the bottom of the PBDB Navigator, students will calculate the time range of each fossil. In doing so, they will discover that whereas Pecten fossils have been recorded from the Carboniferous Period to the current Quaternary Period—which represents 358.9 million years of Earth’s history—ammonites of the genus Mariella existed for 79 million years only during the Cretaceous Period. Therefore, rock strata containing Mariella fossils can be dated confidently to the Cretaceous Period and make better index fossils. Students conclude the Elaborate phase by responding to the following:
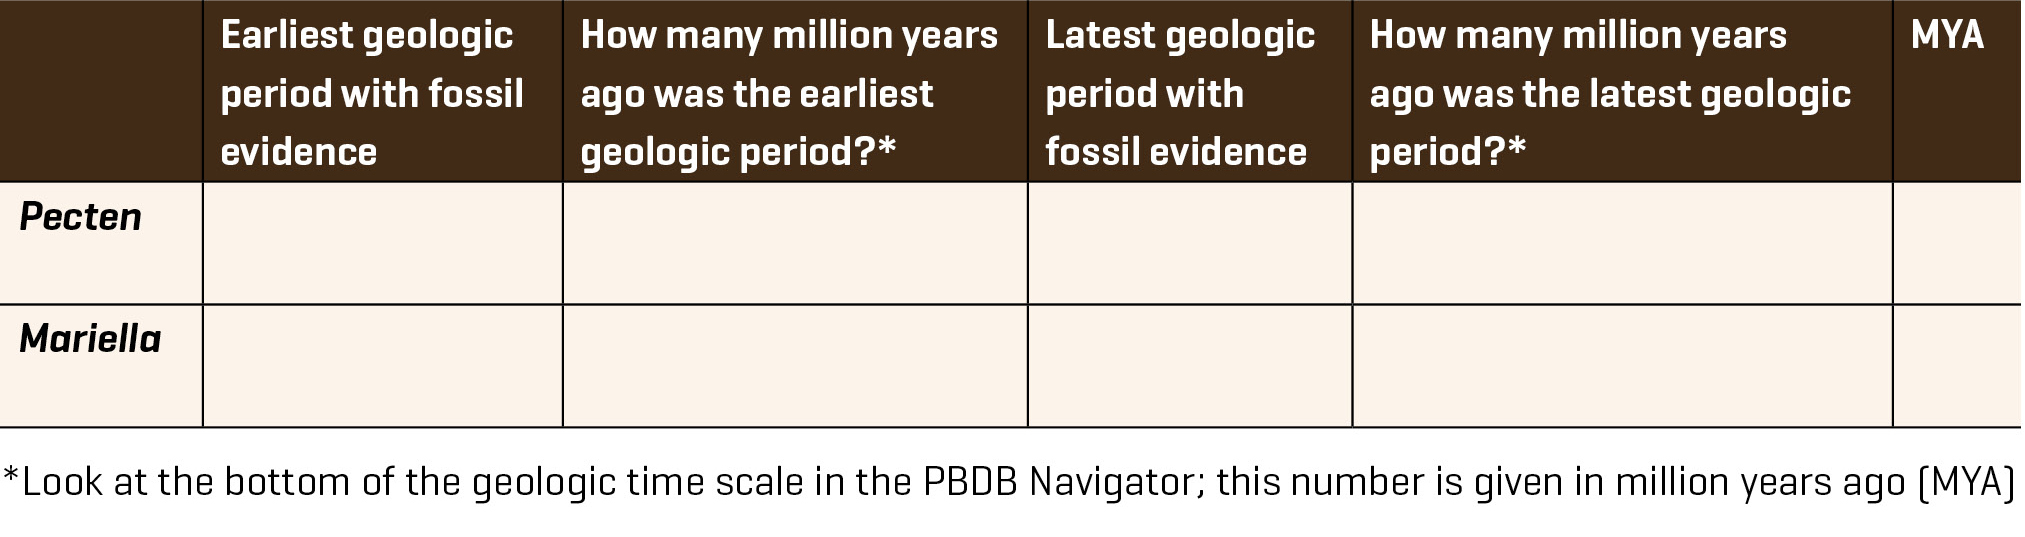
- Do Pecten fossils make for good index fossils? Why or why not?
- If you found a Mariella fossil, about how old would the rocks that contained it be in millions of years? How confident are you in that age range?
If students need more practice with this skill, you can create additional pairs of index fossils (see Figure 2) and nonindex fossils of your choosing.
Evaluate
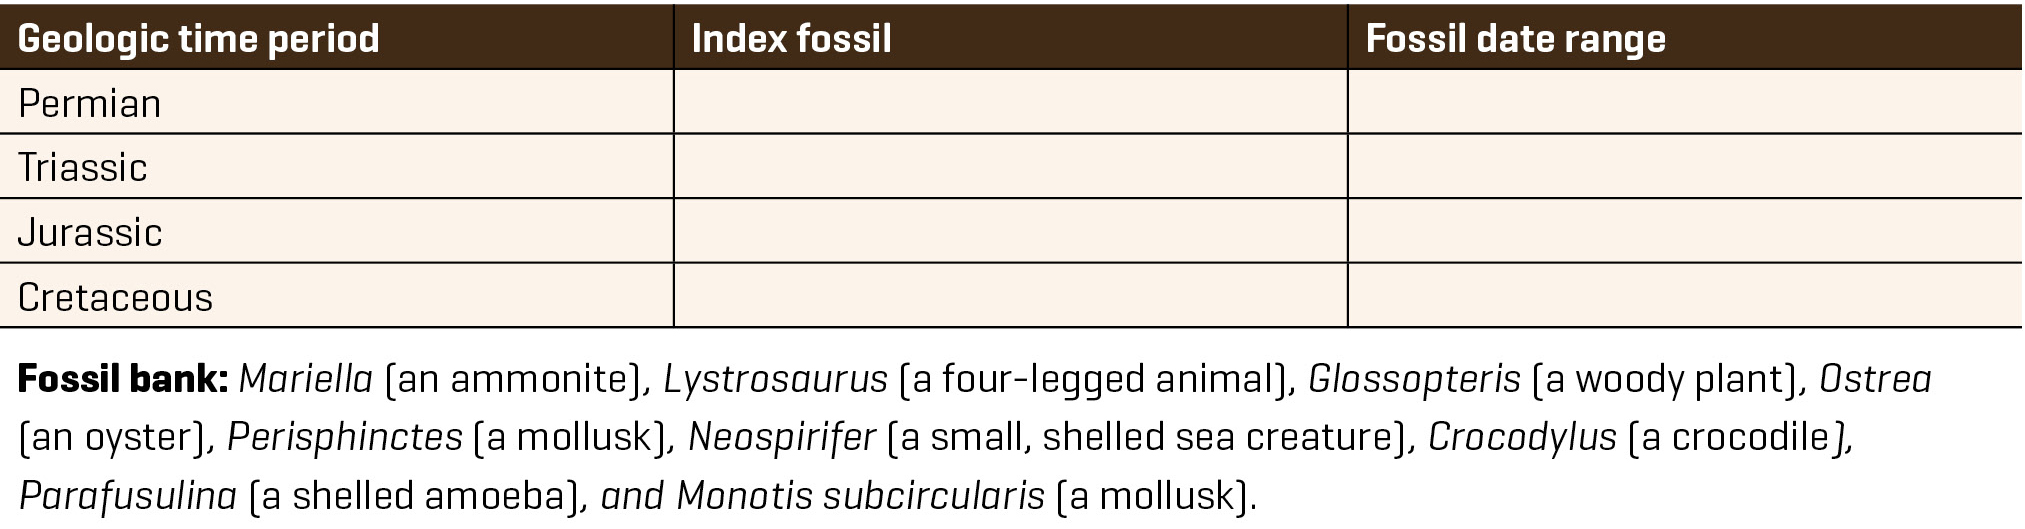
To demonstrate mastery of NGSS Performance Expectation MS-ESS1-4 (NGSS Lead States 2013), you can ask students to identify an index fossil for four geologic periods (Permian, Triassic, Jurassic, and Cretaceous) using Table 3. With the exception of Mariella, this could be rather difficult, thus we suggest providing the fossil bank included at the bottom of the table. After completing the table, students can provide a short essay based on data from their chart to give a scientific explanation for how the geologic time scale is used to organize Earth’s 4.6-billion-year-old history. See “Differentiation and Enrichment Ideas.”
Conclusion
There is no doubt that big data will continue to accumulate and influence the way that science is done. Using big data in middle school classrooms helps students engage with authentic science and recognize the power of the data revolution. Because many aspects of the future rest on what we learn from the analysis of large data sets, it is important that students access and engage with big data in meaningful ways that promote an understanding of data, how to work with it, and how it underpins scientific processes. The PBDB is an excellent introductory data set for middle school students that can develop an interest in the history of planet Earth. In addition to exploring more ways to use the PBDB, we encourage you to find and share other large data sets that can be used as part of middle school science instruction. •
Acknowledgments
We thank the students at Hillsdale Middle School for their participation and Ann Mason for coordinating the fossil making activity in the Hillsdale Middle School Maker Space. A special thanks goes to Mark Uhen for his work on the PBDB and for reviewing our manuscript.
Differentiation and Enrichment Ideas
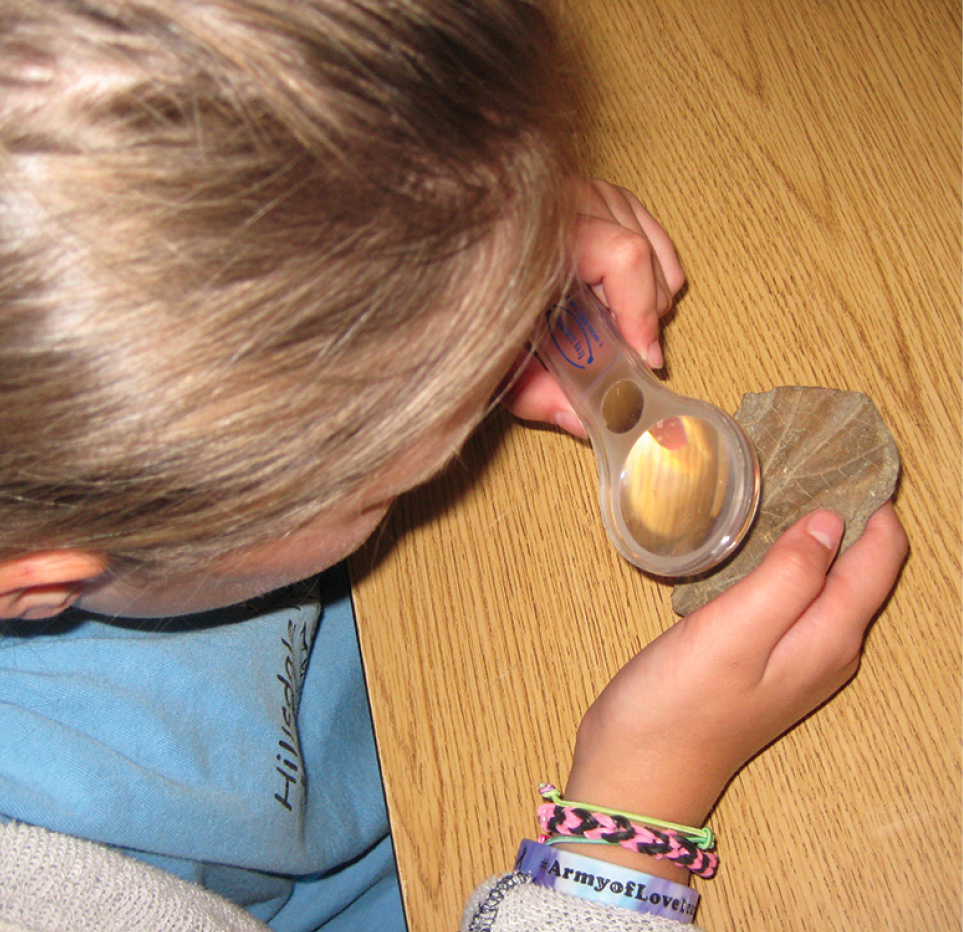
Lesson elements that may cause students to struggle include potentially inaccessible vocabulary, math operations with large orders of magnitude, and difficulties associated with operating the PBDB Navigator. To support meeting these challenges and scaffold student learning, we suggest providing students, as needed, with illustrated key vocabulary (see Supplemental Materials) for easy reference throughout the lesson. The illustrated key vocabulary includes pictures of taxa and simple definitions for discipline-specific language (i.e., stratum) that are used in the lesson. To make the math simpler, we taught our students to use the convention MYA for “million years ago” instead of including zeros when performing math calculations. This significantly reduced the difficulty of the math so that in most cases calculators were not needed. Finally, some students are bound to have more difficulty than others while learning to operate the PBDB Navigator. Although, we found this to be the case, by pairing students together and identifying student tutors who were available to help classmates, we created a collaborative learning environment that promoted meeting student performance expectations. The tech team that maintains the PBDB is working with ePANDDA (enhancing Paleontological and Neontological Data Discover), a new application interface, to provide access to full-sized images of PBDB fossil occurrences from another database, iDigBio (Integrated Digitized Biocollections) that is digitizing data and images for millions of biological specimens. Not every fossil in the PBDB has images yet, but many do. These images (where available) could be used with students who finish early (i.e., how many of the organisms that you investigated have images available?), as an extension activity (i.e., find images, copy and paste to presentation software and share with class), or to increase access for students with special needs (i.e., lesson modifications that emphasize visual aspects of the data). To access the images, go to the PBDB Main Menu (not the PBDB Navigator) and enter a genus or a species in the box on the upper right, “Search the Database”; in this example, we used the genus Dorudon. If images are available, the results will include a button at the bottom of the page that says “Display Images.” By clicking this button, you can get images of the fossil; by clicking on each image, you can get a full-sized image. By clicking on the “i” next to the image, you can look at the iDigBio record associated with each image, which contains the full specimen record including in what collection the fossil is currently housed. We also had access to a classroom fossil collection and a maker space. Students had the opportunity to handle and examine actual fossils (see Figure 3) and replicate the process of forming fossil casts and molds. This was a fun activity that excited students and provided an opportunity to be creative. Again, we suggest incorporating these activities as a way to enrich and differentiate instruction—for example, as an activity for students who finish early (i.e., investigate the fossil collection), as an extension activity (i.e., categorize the fossil collection by type), or to increase access for students with special needs (i.e., lesson modifications that emphasize tactile aspects of the data).
Online Resources
Life through Time lesson—https://serc.carleton.edu/NAGTWorkshops/intro/activities/183735.html?
Paleobiology Database—paleobiodb.org
PBDB Navigator—https://paleobiodb.org/navigator/
PBDB resources page—https://paleobiodb.org/#/resources
Video introduction to the PBDB Navigator—https://www.youtube.com/watch?v=db2He3p-Jco
Supplemental Materials
Connecting to the Next Generation Science Standards
Delving into the Database instruction sheet
Fossils, rock strata, and the geologic time scale
Key and rubric for responses to items in lesson
Peggy Mansfield McNeal (pmcneal@towson.edu) is an assistant professor of science education in the Department of Physics, Astronomy and Geosciences at Towson University in Towson, Maryland. Elizabeth Cordle is a science teacher at Hillsdale Middle School in El Cajon, California.
Computer Science Earth & Space Science Literacy STEM Teaching Strategies Middle School