
feature
Transitioning from Partial to Total Understanding
Using Visual Data to Help Students Understand Eclipses
Science Scope—July/August 2023 (Volume 46, Issue 6)
By Jesse Wilcox, Carly Troyna, William Lange, Katharyn Gray, and Cassidy Leadley
CONTENT AREA Earth and Space Science
GRADE LEVEL 6–8
BIG IDEA/UNIT Modeling eclipses
ESSENTIAL PRE-EXISTING KNOWLEDGE Moon phases
TIME REQUIRED 2-3 hours
COST A one-time cost of around $100
SAFETY Conversations about appropriately shining flashlights
Visual data refers to visual sources of information intended to convey meaning (Finson and Pederson 2013). While visual data can be graphs, charts, and diagrams, it can also include many other types of visual representations such as simulations, photos, and models (Anderson and Contino 2013; Finson and Pederson 2013). Students interact with these types of visual data on a daily basis but are rarely taught how to interpret visual data in meaningful ways.
In science, many concepts are communicated through visual data. If students do not have adequate strategies for making sense of visual data, they may misinterpret what they are seeing in numerous ways. For example, students often see the Sun, Moon, and Earth in the same picture. While seeing all three objects is useful, without carefully considering the issues with scale, students may not realize the vast distance the Sun is from the Earth and the Moon.
Science teachers can use visual data strategies to help students come to understand what they are seeing as well as pick out how those representations differ from reality. Strategies such as teacher modeling, questions, and small-group work (McTigue and Coleman 2013) help direct students’ attention to graphics and help them make sense of them.
In this article, we describe a middle school space science lesson about eclipses (partially addressing MS-ESS1-1). We use visual data throughout this 5E lesson, along with teaching strategies, to help our students move toward a more complete understanding of eclipses. We have found by focusing on teaching students through and about visual data, they are better able to think critically about the content and the way the content is represented.
Engage (20 minutes)
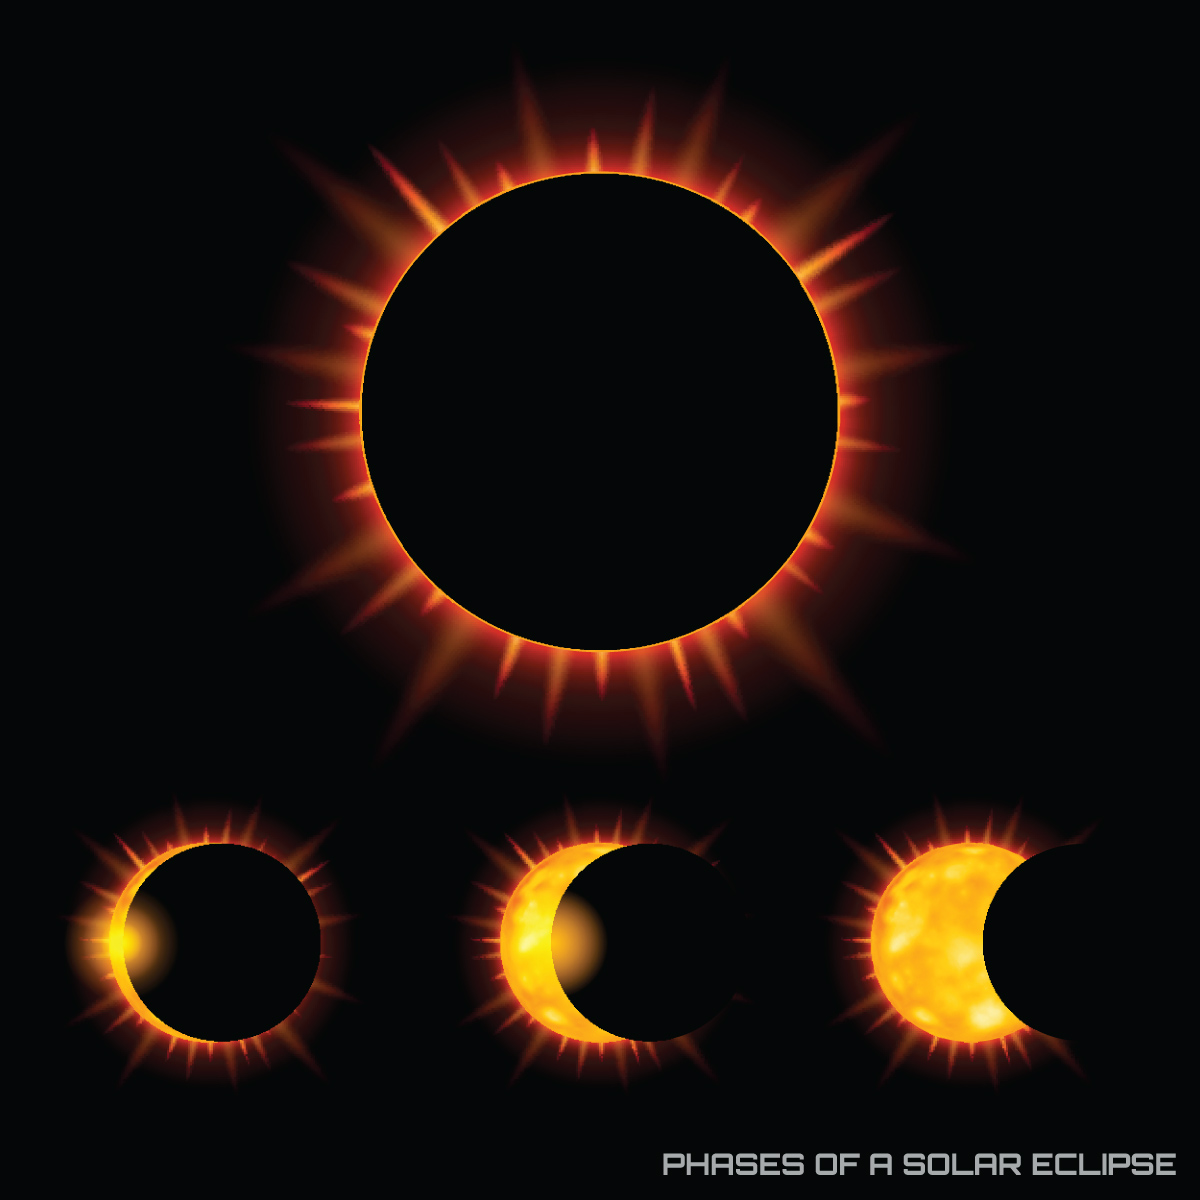
We start the lesson by engaging students with two videos, one of a lunar eclipse and one of a solar eclipse (see Online Resources). We typically show the solar eclipse video second because we often get better engagement from students. For each video, we ask students to record three to four observations. After the eclipse videos, we ask, “What observations did you make?” Students often respond by saying “the moon appeared pink/red/purple at different times of the lunar eclipse,” “the moon looks like it changed shape,” “the solar eclipse starts during the day,” and “it looks like night during the solar eclipse.” After we show both the videos, we ask, “How can we model eclipses in the classroom?” and “How will modeling help us better understand what is happening?”
Explore (50 minutes)
To begin the explore section of the lesson, we have students create a model of the distance between the Earth and the Moon based on their answers from the engage phase. In their groups of about three or four, we provide students with a small globe (circumference of 40 cm), a small Styrofoam ball to represent the Moon, string, and meter sticks (all of these materials can be a one-time purchase and are relatively inexpensive).
First we ask students, “How can we measure around the globe?” Students typically respond, “We can use a ruler.” We ask, “Why might using a ruler alone not be enough?” and “How could we use a string to help us?” Once students understand, they use a string to wrap around the globe, then measure the string. The students report the globe is about 40 cm in circumference. We then ask, “What would we need to know if we wanted to know the scale of our model to the actual Earth?” Students quickly look up Earth’s circumference of about 40,000 km. We then ask, “How could we use these numbers to make a scale relationship?” With a bit of guidance, students determine 1 cm on the globe is equal to about 1,000 km on Earth. We continue this process with the model Moon (circumference of 11 cm), actual Moon (cm of 11,000 km), and the distance between Earth and the Moon (384,000 km or 384 cm for the model). Once students have all the information, we give each group a flashlight to represent the Sun. Then, we instruct them to model solar and lunar eclipses using all the materials we provided. Prior to starting, we warn students not to look directly into the flashlights.
Students begin by measuring the scale distance between Earth and the Moon and make their models in groups of two. Students use calculations of the scale distance they made of the Earth and Moon to guide them to attempt to replicate what they saw in the videos (Figure 1). As they work, we walk around the room, listen to students’ conversations, and scaffold by asking questions such as, “How will you model a solar eclipse?” and “Where would you have to put the Moon?” Students are often surprised by how far Earth and the Moon are apart from each other. Students also make adjustments to their models as they work. For example, students often decide to use a whiteboard or a large piece of paper to put behind the Moon to better see the shadow created by Earth when they are modeling the lunar eclipse.
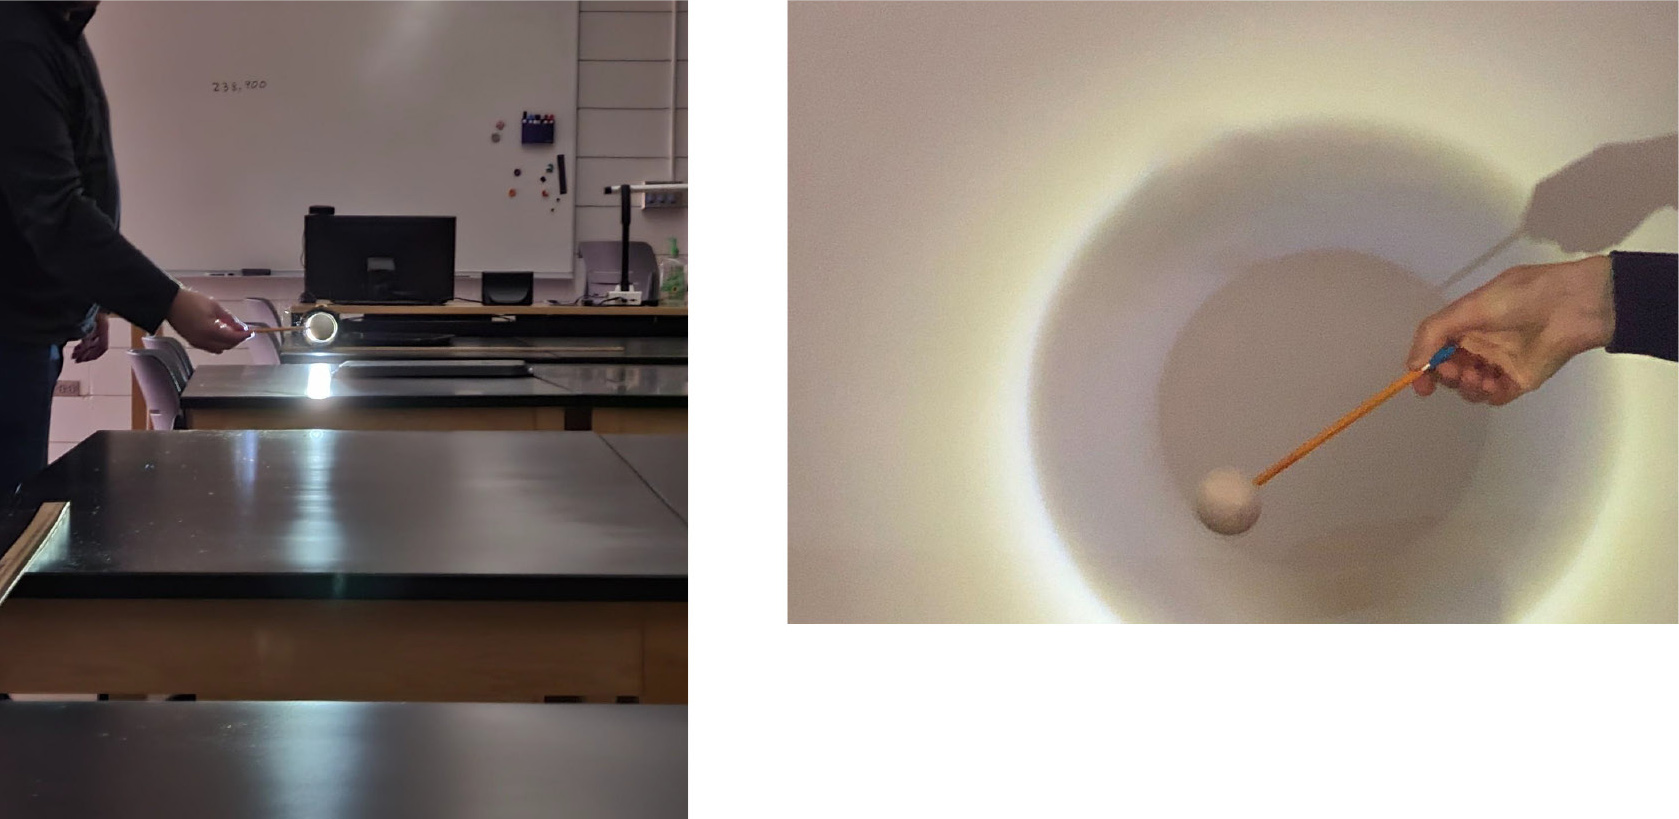
Student models solar eclipse from Earth’s perspective (left) and lunar eclipse from Earth’s perspective (right).
After students have modeled the solar and lunar eclipses, we ask them questions about visual data. For example, we ask students, “How can models help us visualize phenomena?” Students often respond by saying, “It helps us see something so large” or “Modeling helps us look at why things happen.” We then ask, “Even though models can be useful, what limitations do they have?” Students often say, “They aren’t the real thing” and “It sometimes can have parts that are wrong.” We then return to the eclipse models (Figure 1) and ask students, “What were some limitations of this model?” Students point out the distance to the Sun is wrong and we aren’t moving the Earth and Moon like they would actually move. We then ask, “How does this model help you understand solar eclipses?” Students often say, “It helps us think about how big the shadow of the Moon is on Earth” and “It makes sense why solar eclipses are so rare.”
Explain (45 minutes)
We start the explain phase by asking students, “How did you model the eclipses?” We have students share their ideas and images in groups of four, and we rotate the groups a few times so they can see other groups’ pictures and ideas. After about 10 minutes we ask, “What is the difference between a solar and a lunar eclipse?” Students often say, “The difference is where the Sun, Earth, and Moon are located.” We press further by asking, “How is the light getting blocked during a solar eclipse and a lunar eclipse?” Through discussion and looking at the models and pictures, students realize the Moon is blocking light from hitting a part of Earth during a solar eclipse, and Earth is blocking light from the Sun to the Moon during a lunar eclipse.
We then ask, “What had to happen with the alignment of the Sun, Earth, and Moon to create an eclipse?” Students often say, “They all have to be in a line.” We ask, “What happens if they aren’t in a line?” To help students engage more with visual data, we ask them to draw the alignment of the Sun, Earth, and Moon for both a lunar and solar eclipse to appear with the phase of the Moon if it is too high or too low. Referencing back to our recent lesson on Moon phases (Kruse and Wilcox 2009), we follow up by asking students, “What Moon phase does this represent?” Students typically reply, “this represents a full Moon” for the lunar eclipse and “it’s a new Moon” for the solar eclipse.
Additionally, we want students to consider what eclipses might look like from different perspectives (Figure 2). We ask students, “What would it look like if the viewer was outside of the Earth looking at a solar eclipse? Take a few minutes to set up your model to show this. Then, draw what this viewer would see.” While students are completing this task, we wander around the classroom fielding questions for setting up this model. A typical question is, “How do I go about setting this up?” We respond by saying, “What do you know about the order of the three objects during a solar eclipse?” Students say, “The Moon is between the Sun and the Earth.” We reply, “What would we see on Earth during a solar eclipse?” Students often realize they should see a shadow.
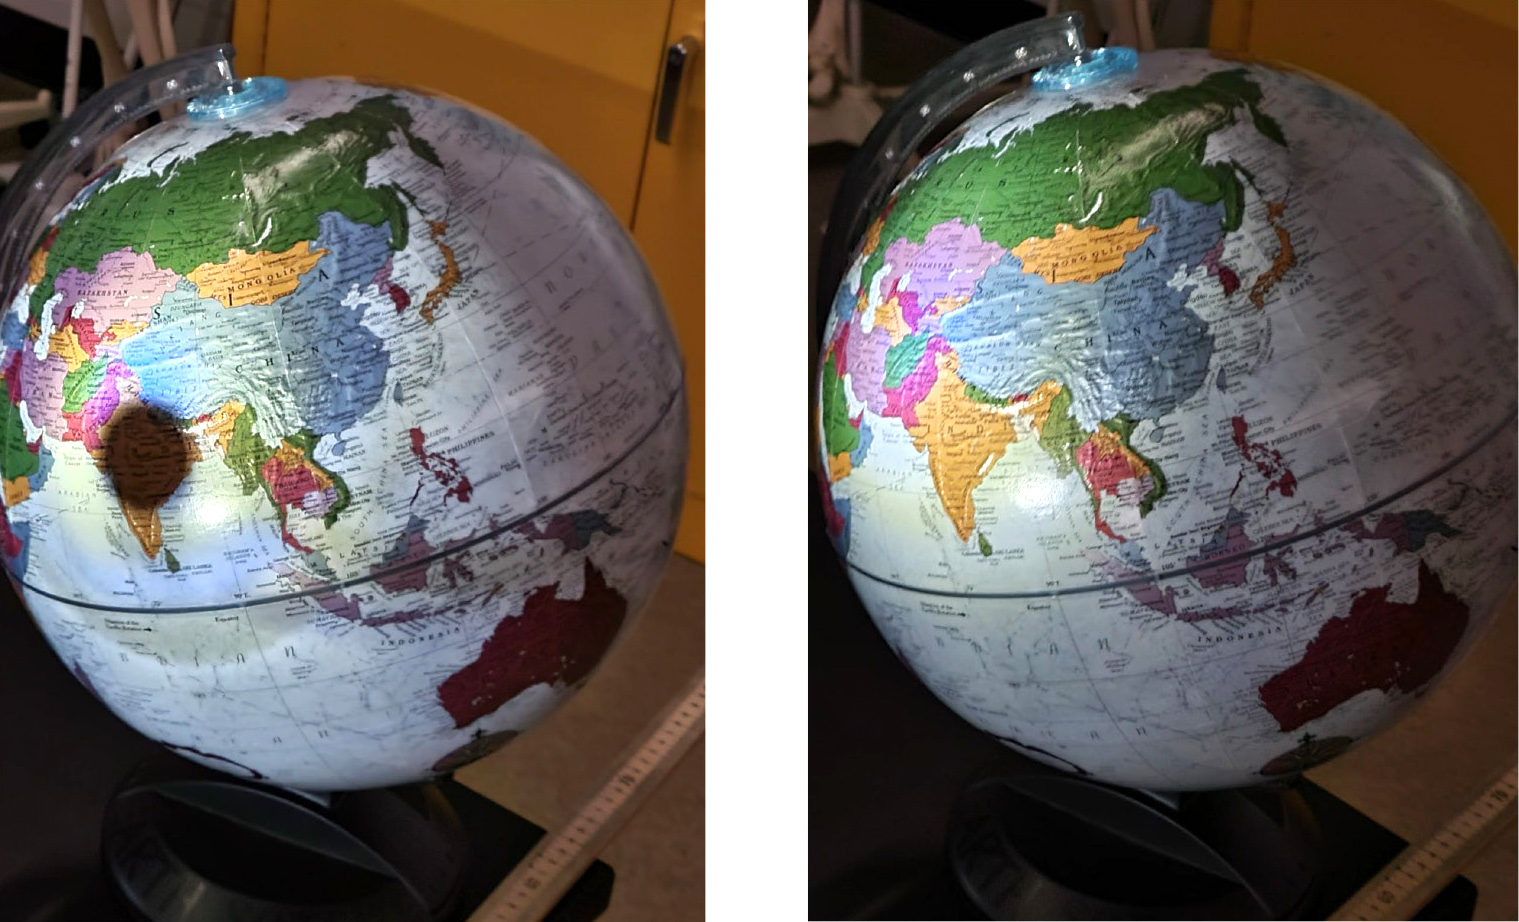
Solar eclipse from an outside perspective (left) and no eclipse (right).
Once students have completed their models, we ask, “What would we see if we were standing in the center of the shadow?” To this students often reply, “We would be completely covered in the shadow, so we would see darkness.” We continue by asking, “What would we see if we were standing on the edge of the shadow?” Students may struggle with this, so we scaffold their thinking by giving them a picture to analyze (Figure 3). We help students make sense of visual data using the graphic by asking, “How can we use this graphic to help us understand how the eclipse in 2024 will look from different locations?” Students often make the observation that “there are lines moving with the path of the eclipse.” We further scaffold by asking, “What do you notice those lines point to?” Students notice that “there are small Suns at the end of those lines.” We then ask, “How does this help us with what we see in various locations during a solar eclipse?” Students then understand the lines correspond to how much the Sun will be covered at a given location. We come back to the original question, “What would you see if you were on the edge of the eclipse?” Students use Figure 3 to explain “on the edge of the eclipse you would see a partial eclipse.” To wrap up perspectives, we ask, “What would you see when you are nowhere near the eclipse path?” Students again use Figure 3 to explain “nowhere near the path of the eclipse you would not see any eclipse or only see the Sun.”
Elaborate (40 minutes)
To elaborate on the basics of eclipses, we show a video of the Transit of Venus from 2012 (see Online Resources). Once the video has concluded, with enthusiasm we say, “Wow, that was really strange! What do you think is happening here? Take the next 30 seconds to discuss with the people around you.” We then pose the question to the class, “What is happening to cause this phenomenon?” Student responses vary from “something is moving in front of the Sun to block a small chunk of light” to “another planet is moving in front of the Sun to block the light.” We scaffold students to identify the object in the video by asking, “What other objects do you know in our solar system?” Students often respond with “planets!” We connect this to the video by saying, “Which of the planets would make the most sense to cause what you are seeing?” From these questions, students typically conclude the object is either Mercury or Venus.
After we told students that the object is Venus, we ask, “What differences do you know between the Moon and Venus?” Students often respond, “Venus is much larger than the Moon.” To elaborate on these responses we pose, “Given that Venus is about four times larger than the Moon, how can we model what is happening?” Students typically respond by saying, “We will need many of the same objects as the previous activity, like the Moon, the Sun, and the Earth.” We tell students that Earth and Venus are roughly the same size, so we can use the globe to represent Venus and they can look with their eyes to represent Earth’s perspective. To reinforce the importance of visual data through models, we also ask, “Why is modeling this phenomenon important?” Students typically respond by saying, “It helps us explain what is happening.” We draw a large circle on the board and tell students, “This will represent the Sun” (due to the size of the globe which represents Venus, the Sun should take up the entire board). Then we say, “Using the Moon you have, the globe that is approximately the same size as Venus, and you as the Earth, create both a total solar eclipse and the transit of Venus in your small groups.” While students work, we move around to different groups. Once students seem to have a model, we ask, “If Venus is approximately four times larger than the Moon, why does it look so small when they are both in front of the Sun?” Students often say, “Venus is much farther away than the Moon.” To follow up, we ask “What does that mean about the importance of distance?” Students conclude that “distance is more important than size in terms of eclipses.”
Evaluate (20 minutes)
After students have completed the activities, we assess them on the knowledge they have gained about eclipses using visual data (see Figure 4 for an example; see Supplemental Materials for the full version of understanding eclipses and scales assessment). Specifically, we have students analyze a diagram, look at a graphic to predict which day the 2024 solar eclipse will occur, draw pictures to explain why a solar eclipse is rarer than a lunar eclipse, and match the shadow created by the Moon on Earth to what people standing on Earth would see from various locations during a solar eclipse. We use a holistic standards-based grading (SBG) rubric (Figure 5) to assess students’ progress toward the eclipse part of the MS-ESS1-1 standard (Wilcox 2011; Wilcox and Townsley 2022). Using the learning target and the SBG rubric, we compare students’ answers to the level of understanding on the SBG rubric and write feedback accordingly (Figure 5).
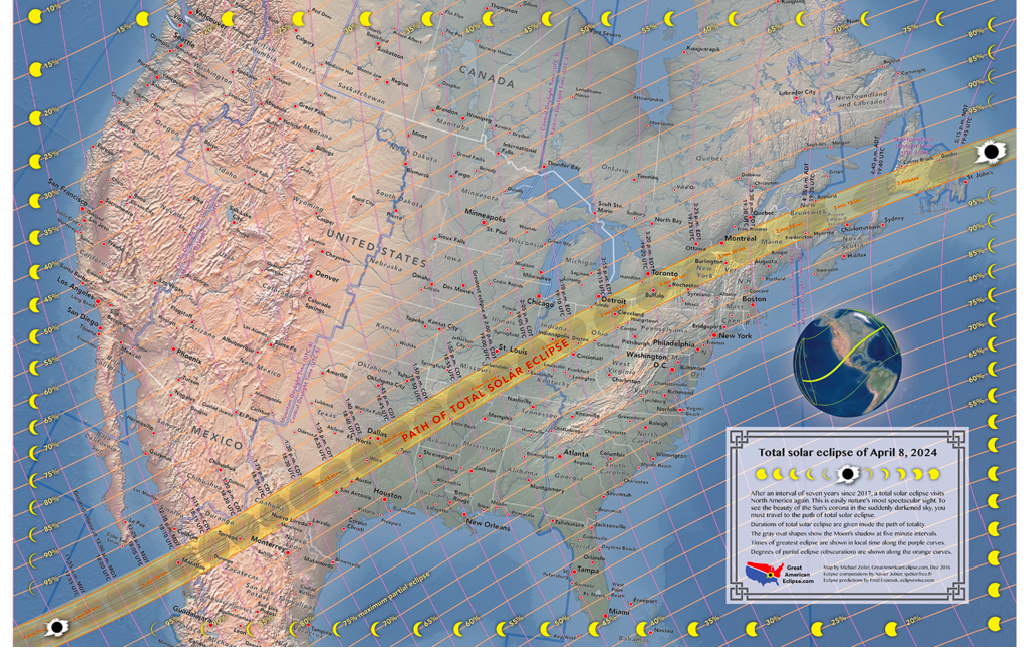
Total solar eclipse in 2024 (larger version at https://bit.ly/3LBeLpG).
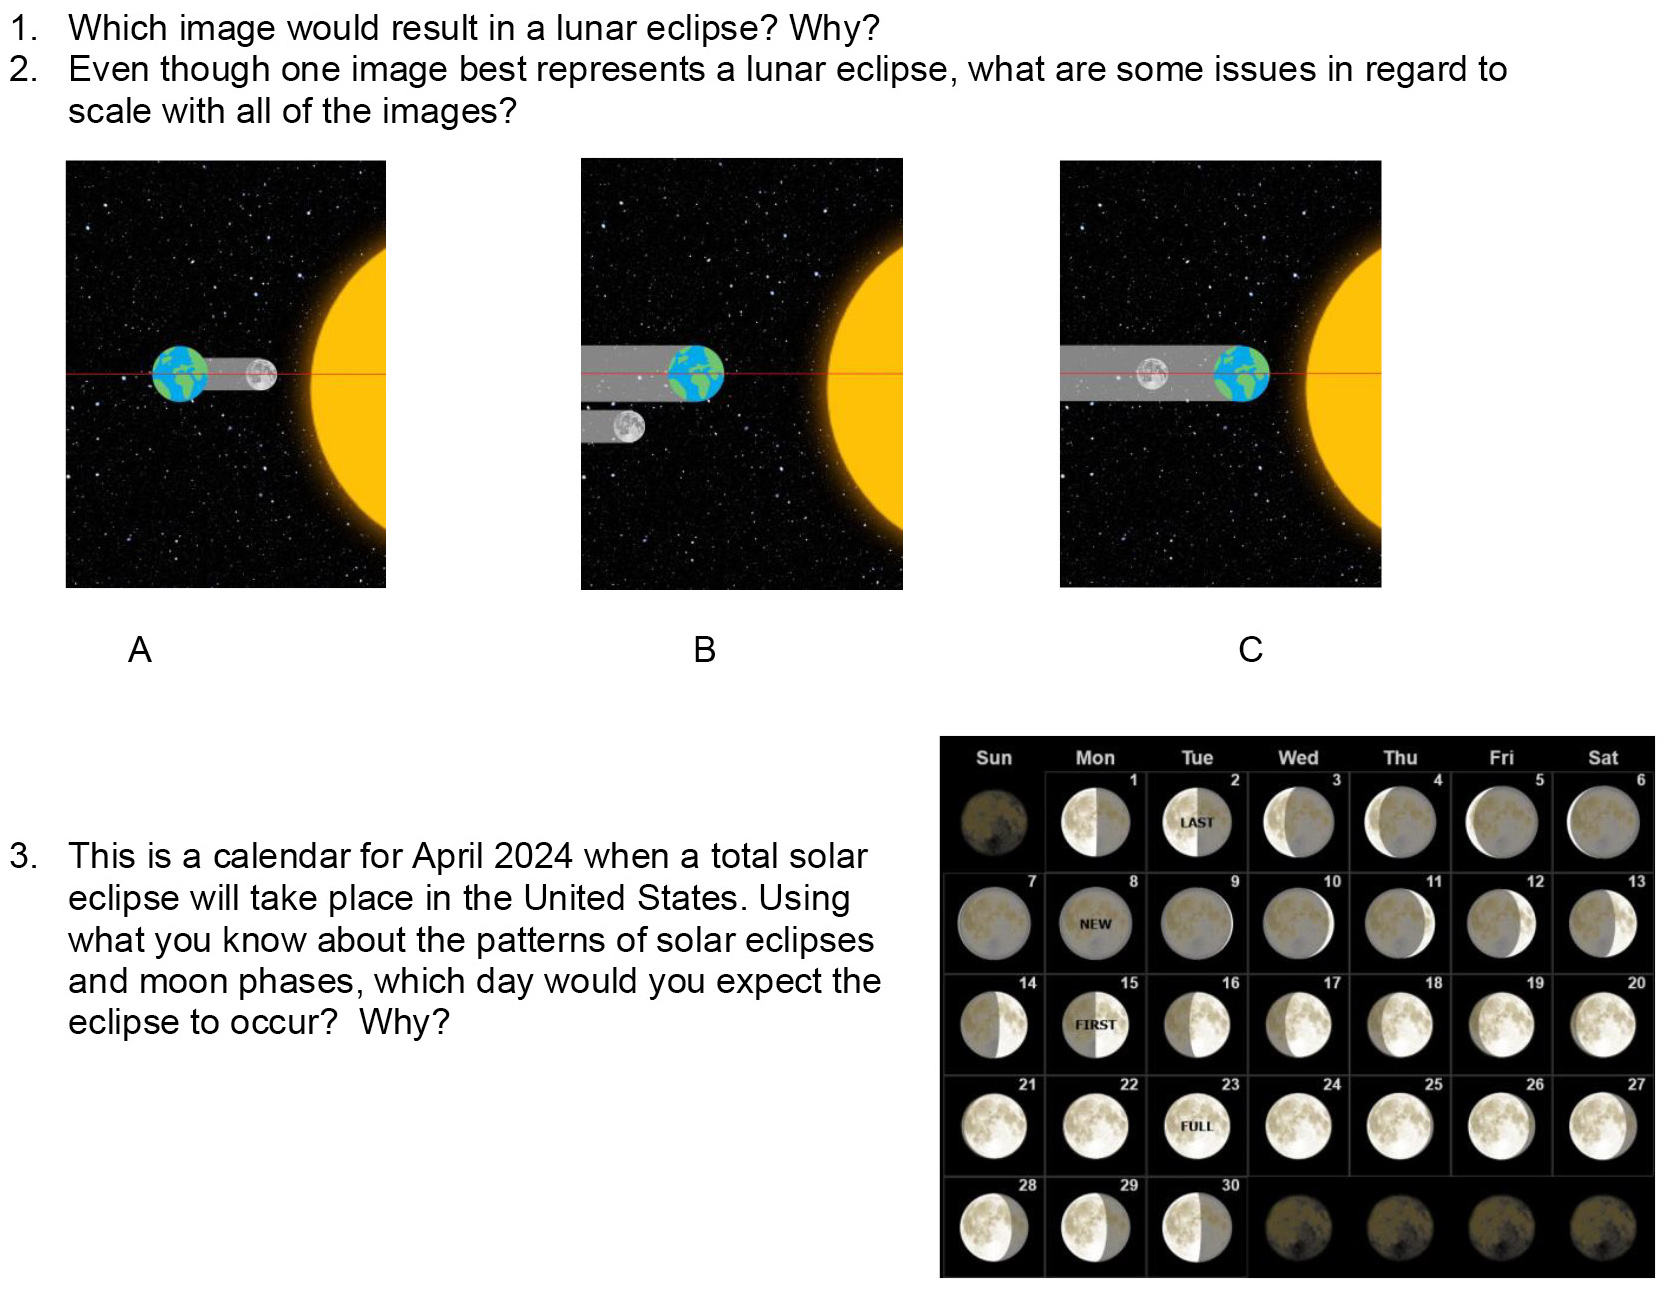
Understanding eclipses and scales assessment.
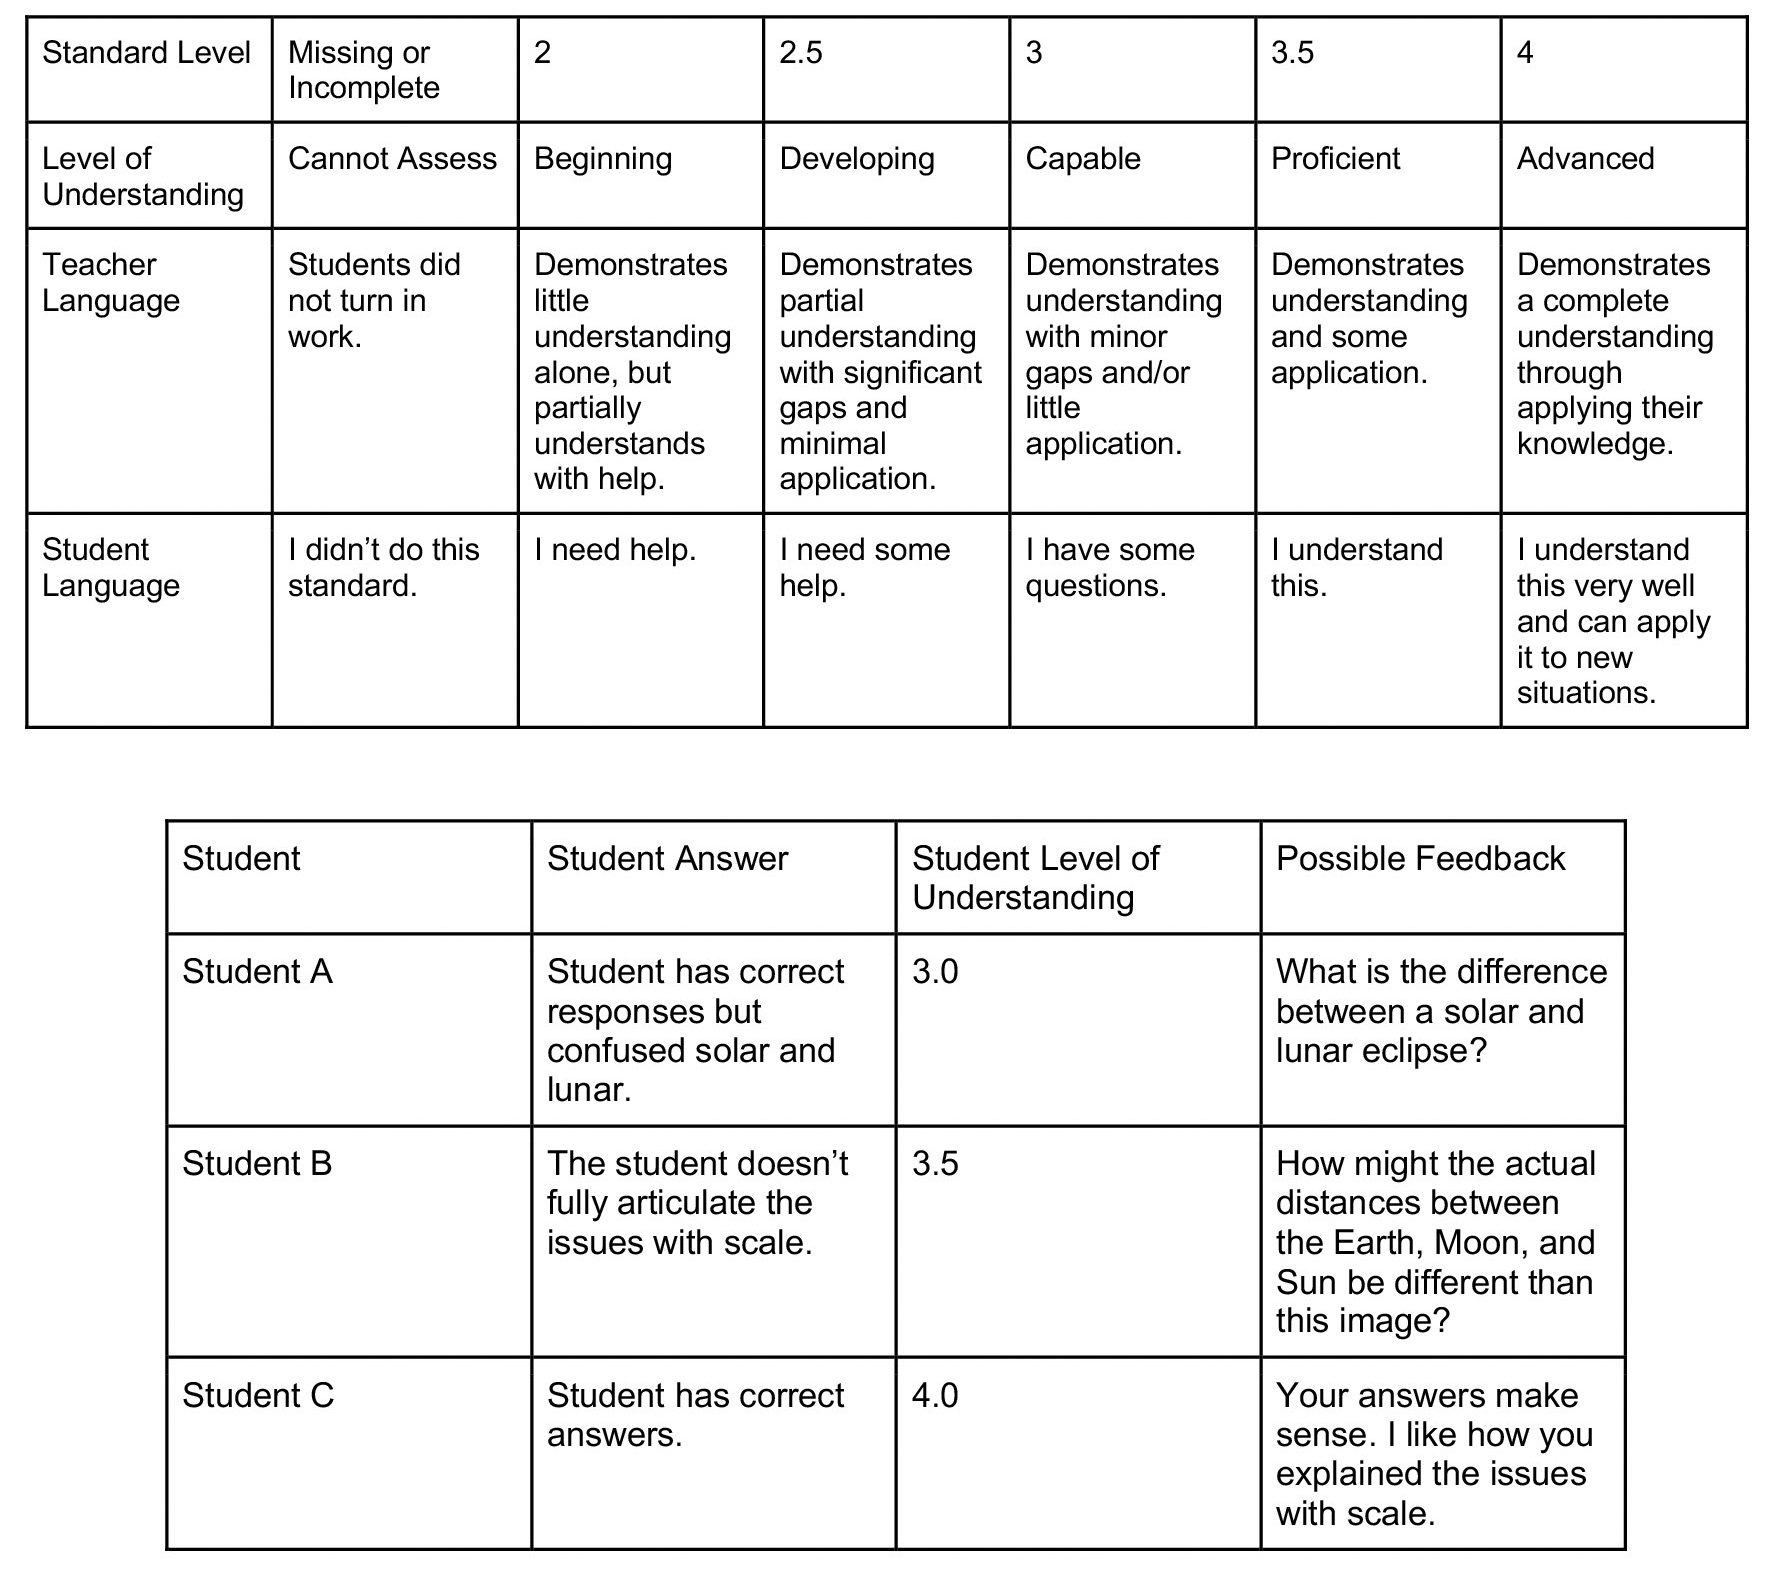
Standards-based rubric with learning target: How can you use visual data and models to describe solar and lunar eclipses?
Conclusion
Throughout this article, we have used several different types of visual data, such as videos, physical models, diagrams, drawings, and images. Visual data can not only engage students, but also foster creativity, communication skills, and content knowledge (Olson 2013). However, students must be taught how to interpret visual data, or else they may glean incorrect information. To do this we used strategies throughout the article including questioning and group work to help students make sense of visual data. When teachers help students make sense of visual data, it is an effective tool to help students make sense of phenomena.
ACKNOWLEDGMENT
We thank the Iowa Space Grant Consortium for funding this project.
SUPPLEMENTAL MATERIALS
Full version of understanding eclipses and scales assessment—https://tinyurl.com/ytpvjexx
ONLINE RESOURCES
Total solar eclipse video—https://bit.ly/3NQDBoi
Total lunar eclipse video—https://bit.ly/3nGn1gp
Venus Transit Across the Sun video—https://go.nasa.gov/3O9j926
Jesse Wilcox (jwilcox.23@gmail.com) is an assistant professor of biology and science education at the University of Northern Iowa in Cedar Falls, Iowa. Carly Troyna, William Lange, Katharyn Gray, and Cassidy Leadley are all students in Science Education at the University of Northern Iowa in Cedar Falls.
•
Astronomy Earth & Space Science Phenomena Middle School