
feature
What is in Our Air?
An inquiry lab exploring sources of air pollution in your community
Science Scope—March/April 2023 (Volume 46, Issue 4)
By Natasha Wilkerson, Benjamin Janney, and Rachelle Pedersen
CONTENT AREA Earth and Space Science
GRADE LEVEL 6–8
BIG IDEA/UNIT Investigate particular matter in the air and identify sources of air pollution.
ESSENTIAL PRE-EXISTING KNOWLEDGE None
TIME REQUIRED Five 50-minute class periods
COST Air quality monitor ($80)
SAFETY Care should be taken when collecting air quality data around the school, especially near busy roads. Teachers should consider common allergies if students are handling air filters.
The Next Generation Science Standards (NGSS) emphasize understanding and mitigating human impact on the environment as a key competency for middle school science (NGSS Lead States 2013). One notable environmental impact is air pollution, an increasingly significant public health issue. The World Health Organization (2021) attributed 4.2 million premature deaths to polluted air in 2016. We present a middle school earth science inquiry lab utilizing effective science teaching practices to promote a robust understanding of this critical issue. Our lesson sequence follows the 5E model based on the learning cycle (Ruiz-Martin and Bybee 2022; ).
Prior to implementing this lesson, we recommend sending home a letter to gather information about student allergies when going outdoors or handling air filters. Additionally, although air quality measurements can occur at any time of year, teachers should consider the best time of year for outdoor activities such as warmer weather and no precipitation to allow for a more enjoyable experience.
Engage: Uncover prior knowledge
Begin the lesson sequence by posing the question, “What is in our air?” Record responses using students’ words to emphasize the value of their ideas. If students are struggling to respond in the class discussion, use cooperative learning strategies like think-pair-share to generate ideas in partners before coming back as a class (Kaddoura 2013). Students often focus on air being made of gasses such as oxygen. To move students toward a more detailed description of air, use questions that target prior experiences. For example, “What might cause sneezing on a spring day?” is a question that promotes the idea that pollen in the air activates allergies. Avoid unfamiliar vocabulary words (e.g., particles, pollutants) and, instead, build ideas from students’ terms. The use of concrete representations will move students toward recognizing that the air contains many “unseen” things. For example:
- A dirty air filter pulled from the classroom or home demonstrates dust particles circulating indoor air (for safety, use filters that don’t contain common allergens like pet hair).
- Light reflects off airborne particles. This can be observed through a projector in the dark.
Now move the discussion to “How does air become dirty?” Create two columns on the board, one representing man-made sources and the other natural sources, but do not reveal the column headers. As students offer ideas, write them in the appropriate column. Use open-ended questions such as “What do you notice when a large semitruck drives by?” to help students consider prior experiences with sources of dirty air. When students generate a sufficient list of their ideas (see Table 1), prompt the class to look for similarities to identify a title for each column. Keep this list visible throughout the lesson sequence to modify as new ideas are uncovered.
The initial discussion entails exploring what and how air becomes dirty. An important additional discussion is to have students talk about why this matters. Pose the question, “In what ways might people be affected by breathing dirty air?” Proposed ideas often include allergic reactions, asthma, coughing, and lung cancer. Acknowledge that these are real concerns with dirty air, then ask how people can know if their air is dirty. If possible, bring out dirty and clean air filters to help students think of ways in which we can measure the dirtiness of the air. To gather students’ ideas, ask, “How could we accurately compare the air in two places?” and “Why might we want to do this?”
One response students often provide is to “count the amount of stuff” on the air filters. This idea provides an excellent context to introduce particle size. Ask students to examine a piece of their hair. Draw attention to the fact that hair is still visible to the human eye and ask them to predict: “How much smaller might a single piece of dust or smoke from a vehicle be?” To visualize the size differences, use the props of a pool noodle as a piece of hair (~50 microns), a golf ball for dust and pollen (~10 microns), and a grain of sand for combustion particles of a vehicle’s exhaust (~2.5 microns; see Figure 1). Ultimately, counting the amount of these tiny particles is difficult, and we need a better tool to identify how much stuff is in the air.
| Table 1. Students’ ideas for sources of particles in the air. | ||||||||||||
|---|---|---|---|---|---|---|---|---|---|---|---|---|
|
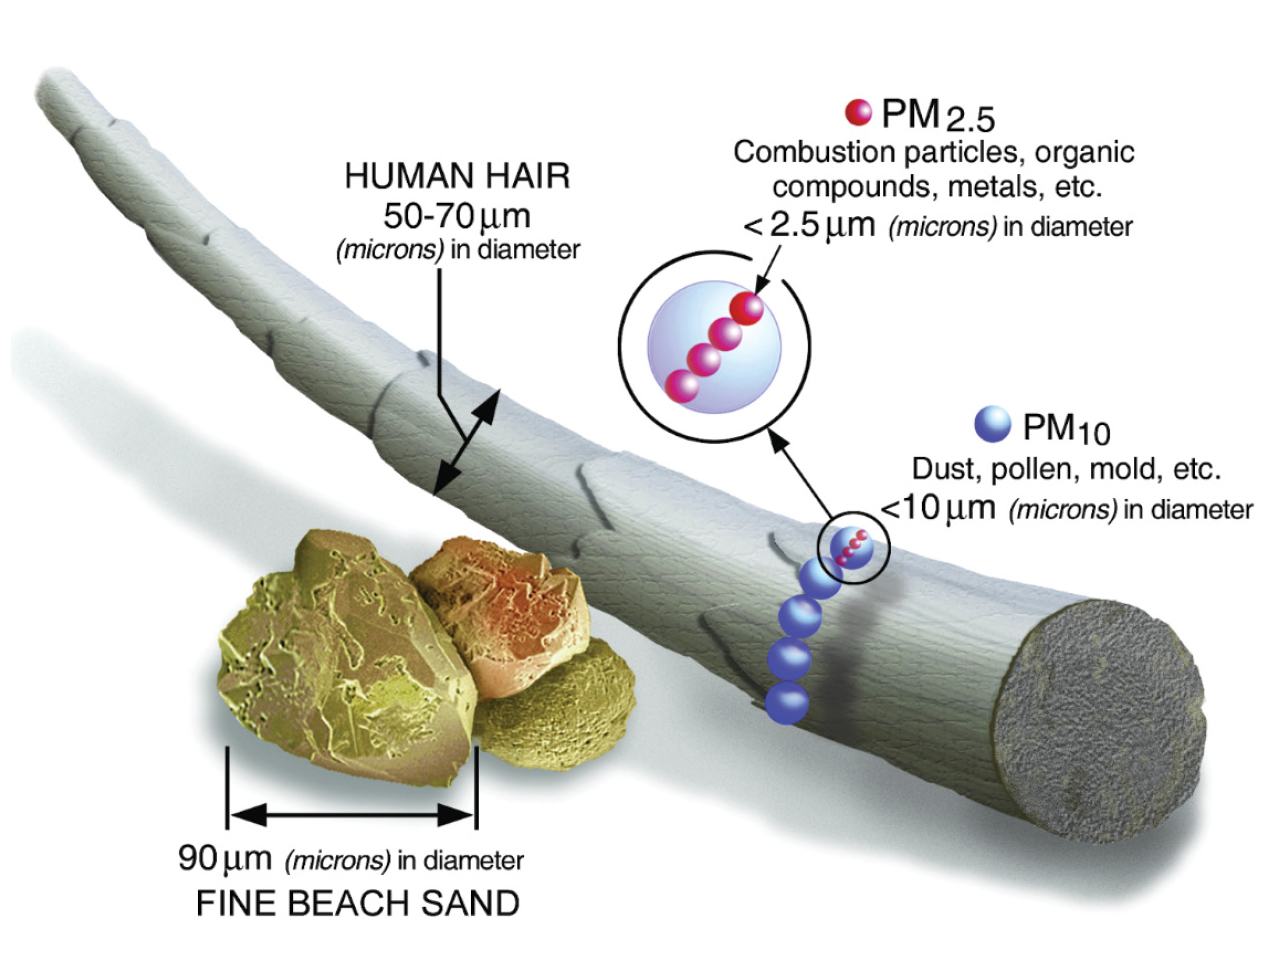
Size comparisons for particulate matter (U.S. Environmental Protection Agency, https://bit.ly/2ww7Rf7).
Before dismissing the class each day, we use exit tickets. These brief questions are an opportunity to assess individuals on the depth and accuracy of learning. For instance, to conclude today’s lesson, we ask each student to respond to the following: “Despite looking ‘clean,’ what pieces of evidence support the idea that the air around us is full of tiny particles? Why don’t we often see these particles?” See Assessment in Supplemental Materials for additional questions and targeted student responses that demonstrate mastery of content.
Explore: Measure air pollution around your community
Prior to collecting data, show students the standardized scale used by scientists to evaluate air quality (see Figure 2). Ask students, “At what value might we be concerned with the number of particles on this scale?” to highlight that 35.5 and above on the scale is considered unhealthy for humans. Show students a particle sensor, which measures the number of particles sized around 2.5 microns found in the sampled air; the sensor labels this as PM 2.5 (particulate matter). We avoided explaining microns, as this is a developmentally inappropriate concept. Instead, we focus student attention on understanding the meaning of different PM 2.5 levels depending on the location sampled. For our purposes, we used the Langkou particle sensor, which costs $80. Pricing and options for equipment are provided in the Lesson Overview and Materials in Supplemental Materials. Only one air quality monitor is needed because the class will move together to each location.
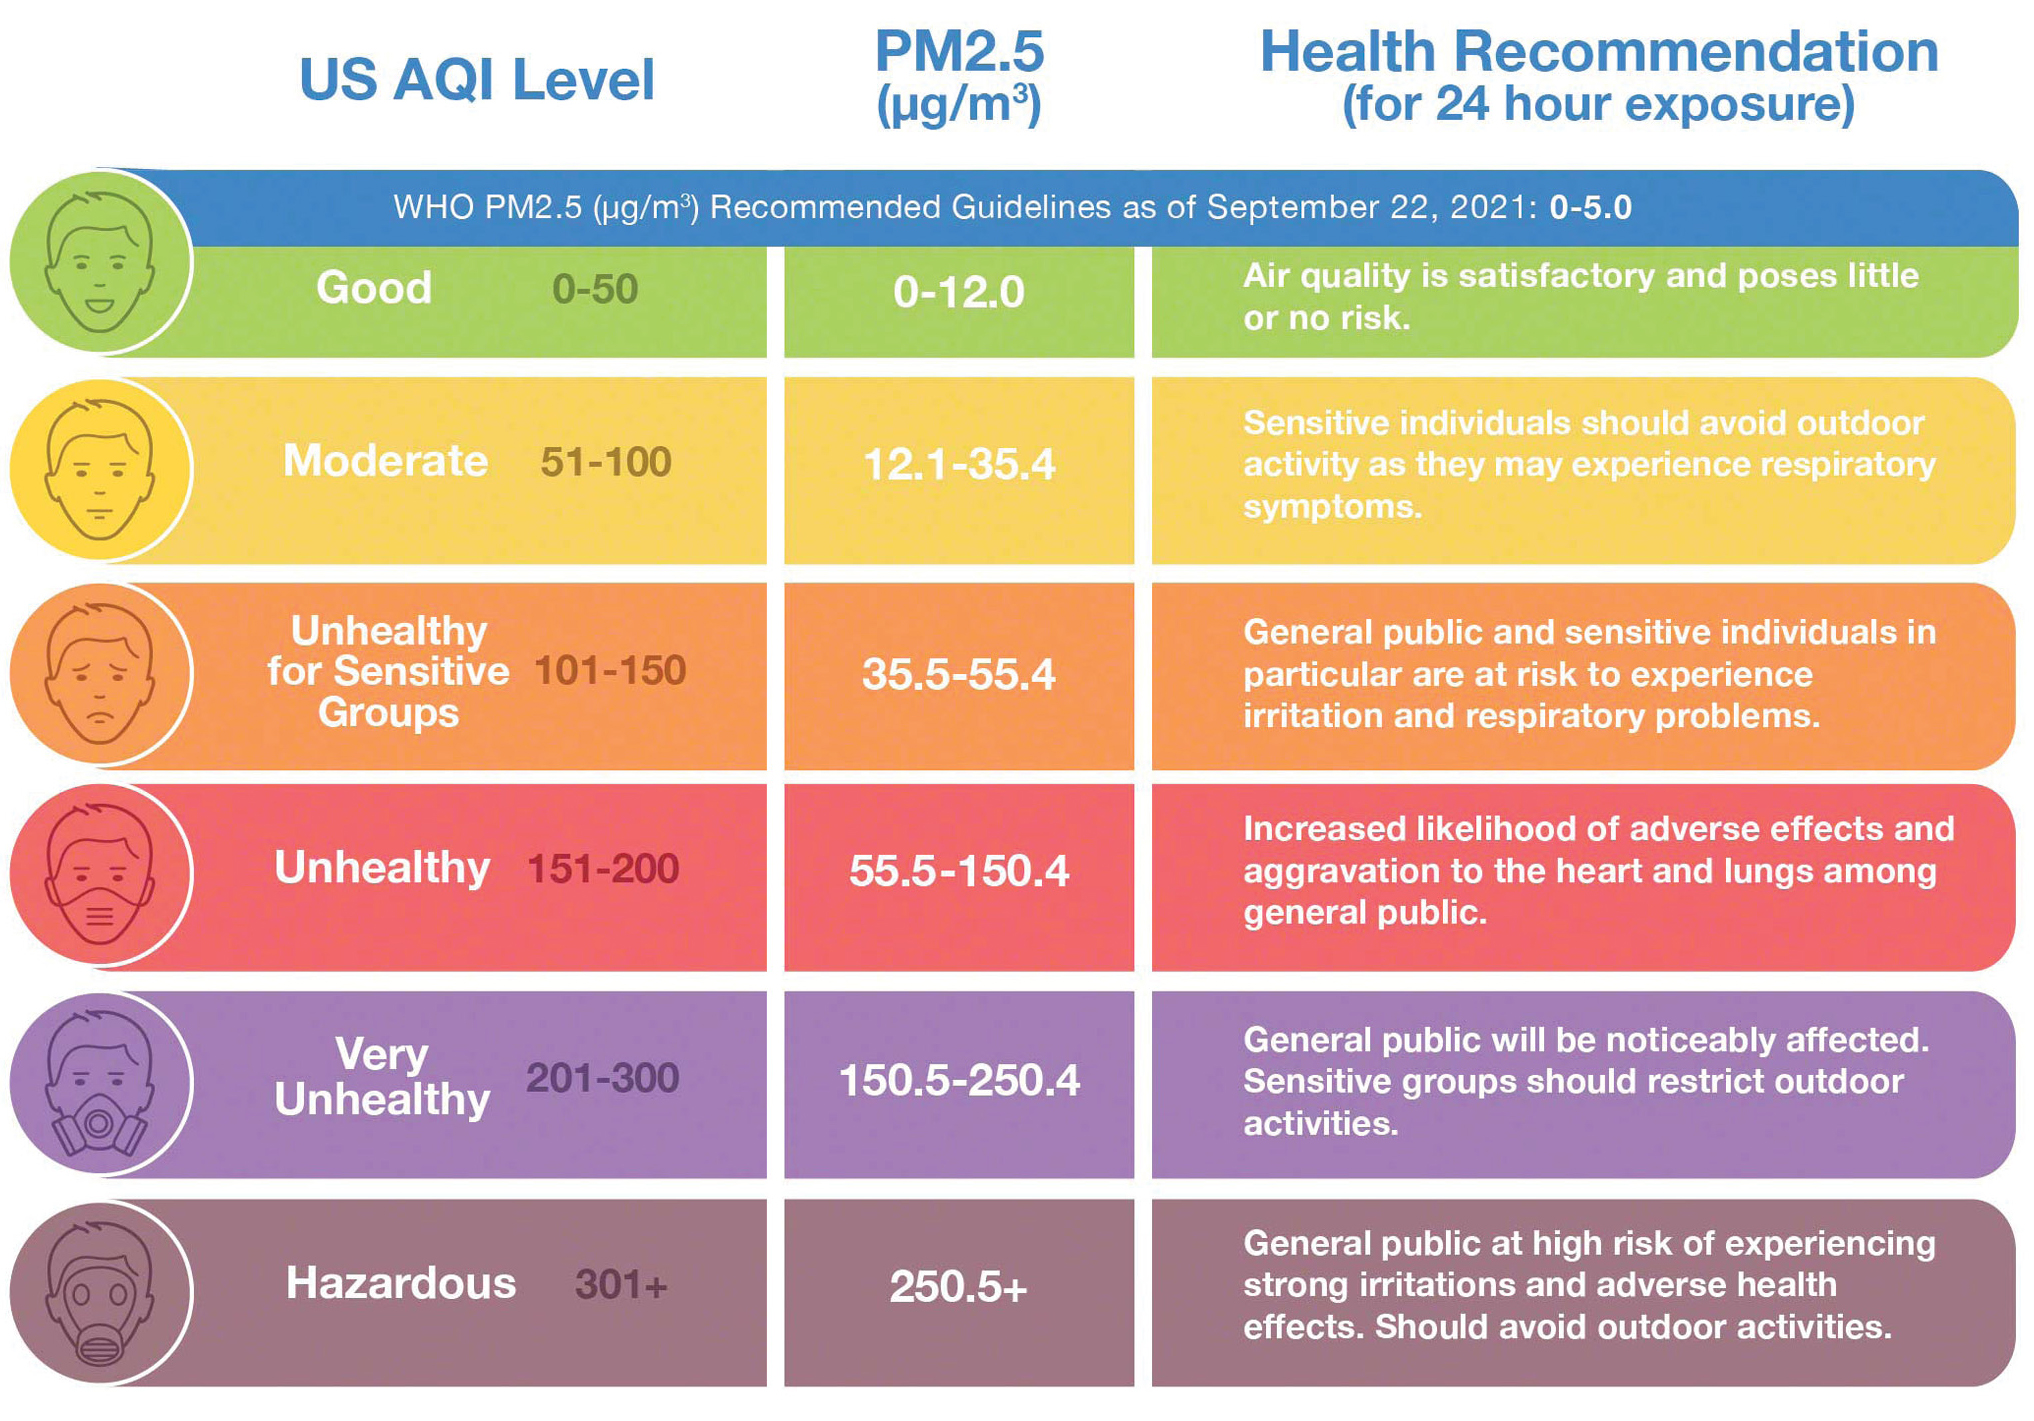
Standardized scale for air quality (U.S. Environmental Protection Agency, www.epa.gov).
Next, we want students to measure particulate levels around the school. Prior to the investigation, task students with developing a procedure in mixed-ability groups of two or three. This step is important because we want to assist students in figuring out how to collect information and what information is necessary to collect, just like real scientists who do not have an instruction manual to follow when conducting experiments. Students are also more engaged as they have a voice in the lab procedures.
For this investigation, besides using the sensor to collect PM 2.5 levels, ask the student groups to consider: “What data might be important to collect if we are trying to determine the factors which lead to increased pollution? What locations should we explore?” For this group task and others in this lesson, we found that smaller groups are more likely to keep all students engaged, and a mixed group promotes cooperative learning (Saleh, Lazonder, and De Jong 2005). After the small groups have discussed procedures, come together as a class and decide what information we should collect in addition to the PM 2.5 levels (e.g., smells, weather, traffic). Task groups with making a data table to record the information. Note that after this lab, students may realize that additional observations would have been useful. These can be incorporated into the later investigation around the community.
After reviewing hallway rules and expected behaviors, plan a route to various locations within and outside the school, ensuring locations are accessible for all students, including those with mobility impairments. To find some variability when collecting data, we recommend a mix of indoor locations like the classroom, cafeteria, and gym, and then moving outdoors to measure at sites like a playground, parking lot, and sidewalk next to a road. To show our students the impact of cars on air pollution, we measured the PM 2.5 levels coming out of the exhaust of a parked car. The older the car, the more likely to have elevated levels of particulate matter. Only a teacher should take this measurement and ensure students are at least five feet away.
At each location, the teacher can either announce the PM 2.5 or allow a different group to take the lead on data collection. Groups will record the PM 2.5 levels as well as other observations on the handouts provided in Measuring Air Pollution Handouts in Supplemental Materials.
Depending on the time of year this lesson sequence is conducted, students may get varying results. The goal of this lesson is to determine the effect of location on the particulate matter on the same day, but students can conduct this investigation over multiple days to see the impact of weather or seasons on the particle level.
Before moving back inside, we showed students an artificial pollution situation with high particle levels. The “smoke in a jar” experiment (see Figure 3) models a setting in which extreme smoke particles saturated the air (e.g., a wildfire or indoor fire). To conduct this activity, you will need a piece of copy paper, a lighter, and a large jar with a lid. This demonstration should take place outside with students upwind so students do not inhale any released smoke. Keep students at least five feet away.
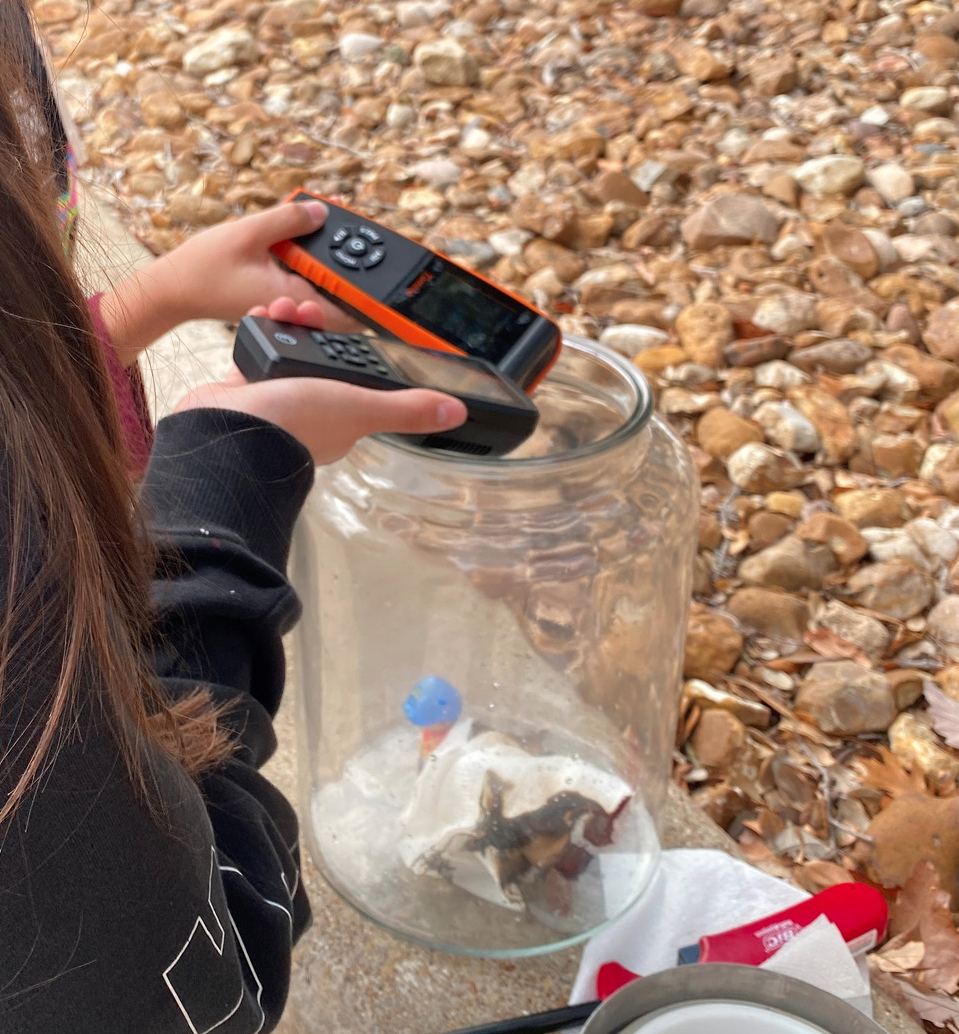
Smoke in the jar demonstration for providing an experience with extremely high levels of air pollution.
Light the paper on fire and carefully place it inside the jar. Let the paper burn for a few seconds and then close the jar. The jar will start to fill with smoke. If your class is large, have students rotate so each student has a chance to see the smoke inside the jar. Ask students for observations, then ask, “How might the particle level compare to the data we have collected so far? What evidence do you have to support your reasoning?”
Next, open the jar slightly, and quickly take a measurement. We recommend the teacher take this measurement and wear a mask to avoid smoke inhalation. The monitor should indicate an extremely high PM 2.5 reading of 600–999 (max). Ask students, “Where does this fall on our air quality scale? How does this compare to the other readings we have found?” To help students connect the readings to locations that might have this level of air pollution, ask, “Where might this high concentration of air pollution exist in the natural world?” Answers might include a wildfire or house fire. Consider a firefighter: “What kind of equipment would they need to stay safe in a fire?” Connect this scenario back to health impacts. Ask, “What do you think someone in this environment is experiencing? How might this impact their health?”
Return to the classroom to analyze the collected particulate level data gathered from different locations around the school. Discuss as a class the factors that lead to differences in air quality readings; for example, “What is the air quality around our school? What common elements do you notice in locations with higher readings?” Depending on your location, outdoor readings may or may not vary significantly as the air quickly disperses particles. Only measurements close to the pollution source—such as next to a construction site, the exhaust of a car, or the smoke in a jar—will show a much higher level of PM 2.5. Even if the levels around the school are similar, this lab provides a concrete experience for comparing the PM 2.5 levels around the school to other locations in the following activities.
Next, expand this investigation to your local community. Ask students, “How do you think the particle levels might vary around our community?” In groups, ask students to generate a list of places in the community that they would expect to have low or high levels of particulate matter. Printing a local map will help guide the brainstorming. For struggling students, provide a list of local areas that they can choose. For example, parks and green spaces will likely have lower air pollution compared with a busy intersection, fast food drive-thru, or construction site. Direct students to be creative and specific and to include a justification relating to sources of air pollution. For example, if a student suggests a traffic intersection, ask, “What levels of particulate matter might we expect? Why? How might the time of day impact the level of air pollution?” Students can use the scale in Figure 2 to predict whether PM 2.5 levels will fall within the good, moderate, or other categories listed.
Bring the class together and share ideas. Pick five to eight of the locations, including sites with predicted high and low levels of pollution. Task students to rank the final list of locations (high-to-low levels of particulate matter), and provide justifications for each ranking using evidence from the previous activities and students’ prior experiences with air pollution. For example, students may have found that a busy road near their school had a higher level of PM 2.5 compared with the playground. This would be a rationale for predicting that the local park will have lower particulate levels compared with a fast-food drive-thru. For an exit question, ask, “How might it be possible that we get different PM 2.5 readings when measuring air at different locations?” We are checking that students recognize that the air in a given location can change in quality based on its composition. We are building to the idea that specific features of a location contribute particles, so prior to that idea, all students must recognize that not all air is the same.
Explain: Connecting particulate levels to sources of air pollution
Between instructional days, we (the instructors) traveled around the community recording air quality data from the class proposed list (see Table 2 for an example). Consider taking a picture or a video while collecting data to share with students. Some air quality monitors connect to Wi-Fi so students can follow live recordings from a computer. Students may propose additional columns to the recorded data such as time of day or other observations.
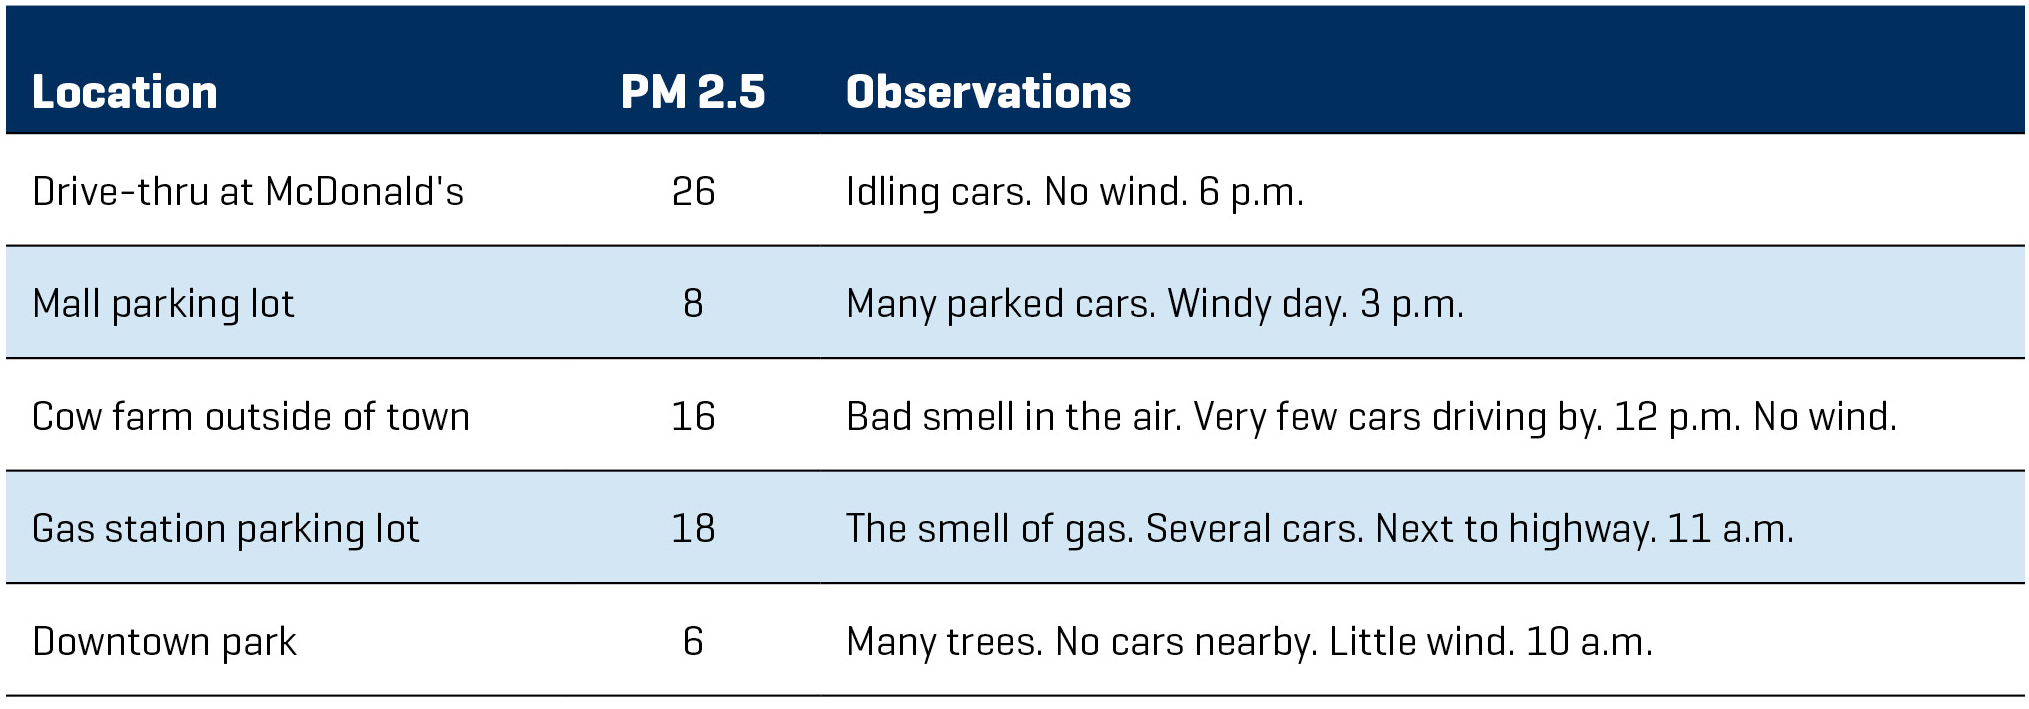
After sharing the results, engage students in a think-pair-share to identify patterns, connect to the school data, and compare to their predictions. Possible questions to elicit student thinking are: “What do you notice about the particle pollution levels at each location? How does this new data compare to the predictions we made? What patterns do you notice across all the observations collected?” The objective is to confirm that there are specific factors around the school and community that increase particulate matter in the air.
These experiences and recognition of natural trends provide a strong frame to begin conceptual development. Build a deeper understanding by connecting experiences to scientifically recognized man-made and natural sources of air pollution that cause negative health impacts.
Specifically, draw attention to human activities such as industrial manufacturing, electricity production, transportation, and dense urban living, along with the impact of governmental policies and regulations designed to reduce air pollution.
Natural factors also affect air quality levels. For example, wildfires introduce smoke and soot, weather can stir up ground dust, and geographical barriers like mountains and valleys prevent particles in the air from dispersing. To check for understanding, we use an exit ticket question that asks, “Write down five types of air pollution. For each, categorize as either natural or man-made and describe a source of the pollution.” The goal is for students to recognize that air is composed of many different particles, that these particles are connected to features of the location, and that we can categorize them into natural and man-made. An example response would be, “Exhaust smoke is a man-made pollutant which comes from large trucks burning gas.”
Elaborate: Investigate and explain air pollution levels around the world
After identifying potential man-made and natural sources of air pollution, deepen student understanding by applying concepts to global air quality data. We use the online database IQAir (see Online Resources) to provide live PM 2.5 readings across the world along with historical trends. Figure 4 shows a screenshot of the website where each colored dot represents an air monitoring station. Clicking on the dot reveals the live air quality reading. Selecting “see detail” provides additional information for the location, including historical trends, health recommendations, and the ranking of the location compared with other cities in the same country as well as a comparison to other cities around the world. For larger cities, IQAir also describes the most common sources of air pollution and local efforts to reduce pollution.
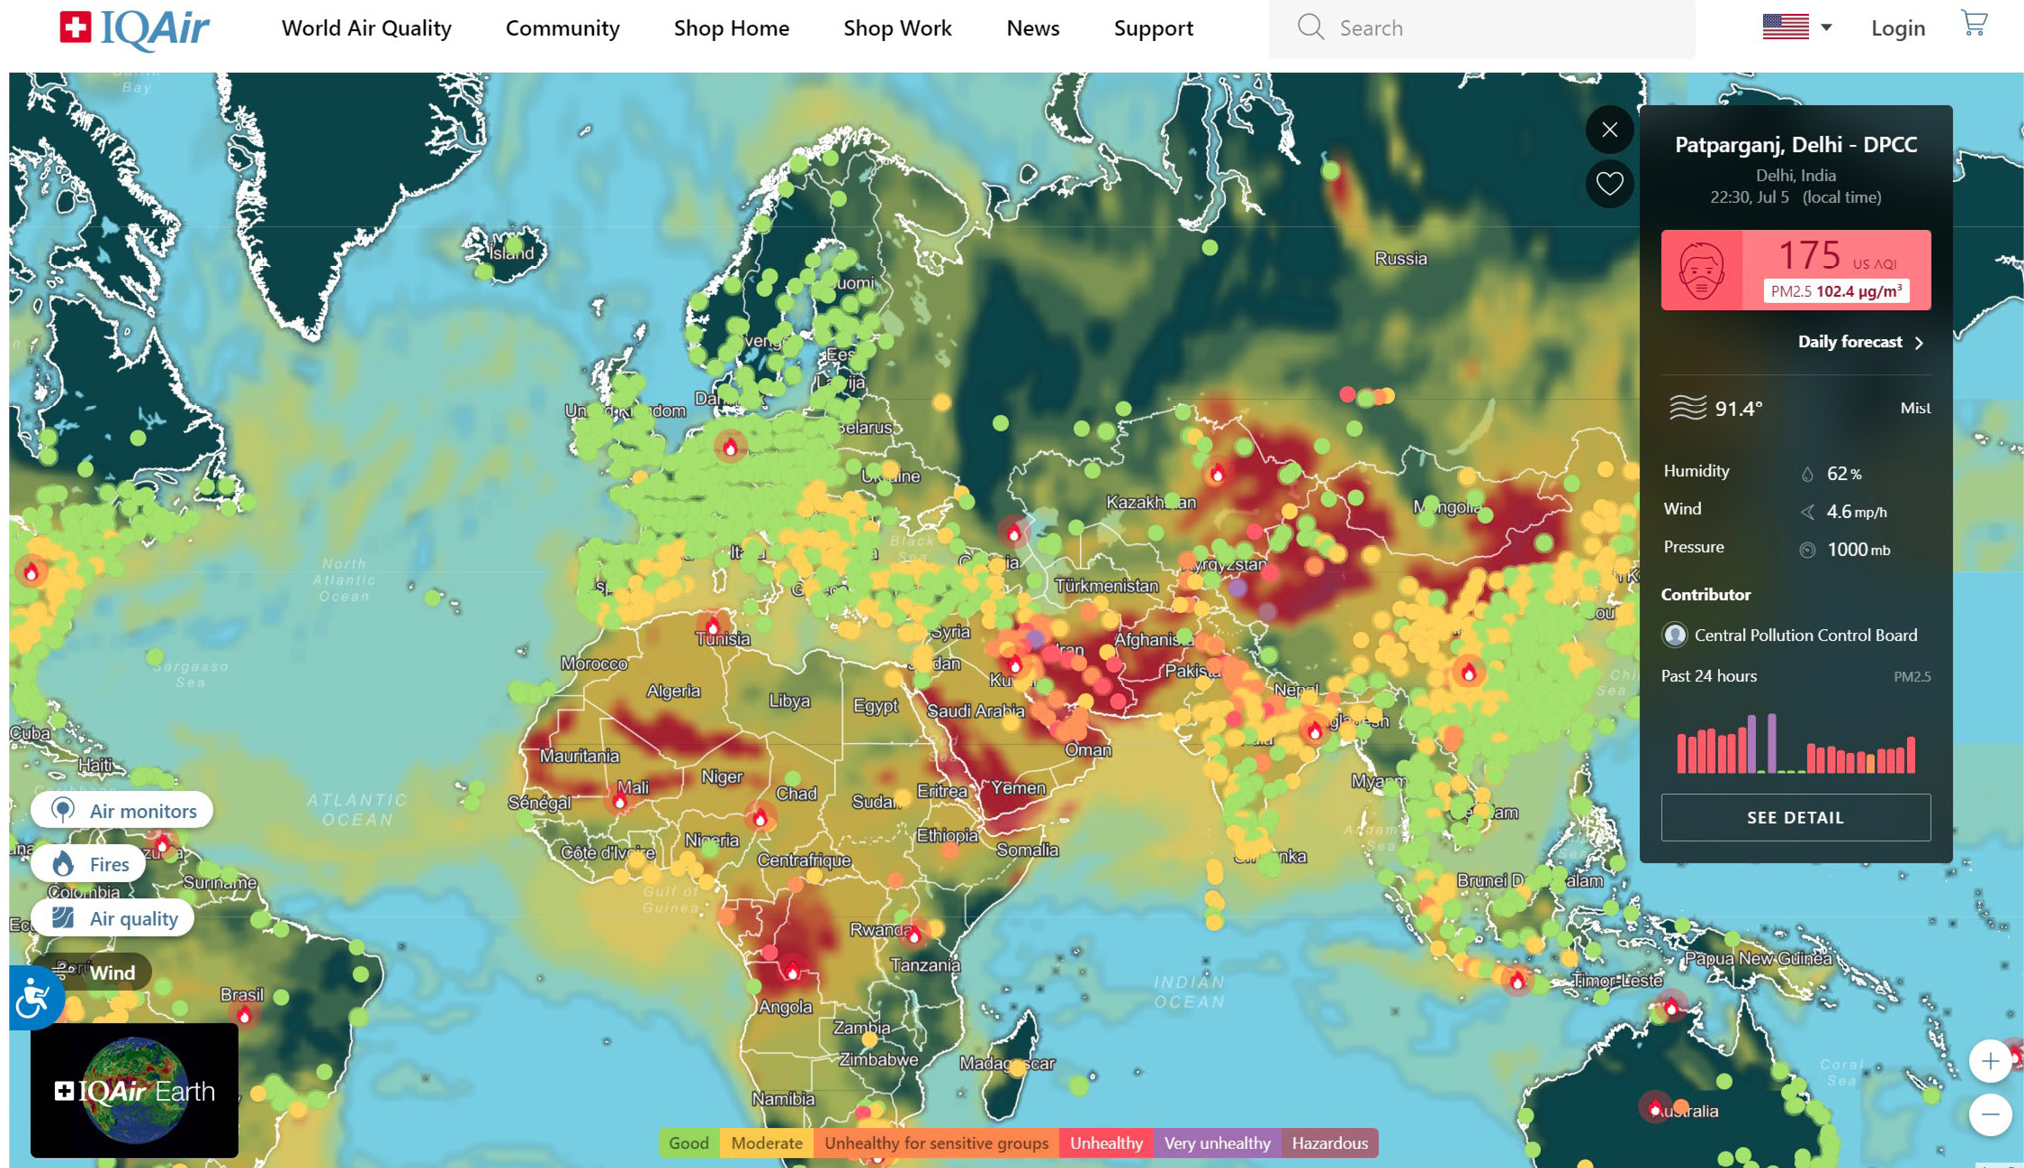
Students explore real-time air quality measurements across the world (IQAir, https://bit.ly/3lanhCv).
We first modeled how to use the IQAir website by projecting our screen and showing students how to read the PM 2.5 levels in several major cities around the world. We selected cities with very high levels of PM 2.5 such as Delhi, India and cities with very low levels of pollution such as Vancouver, Canada. We then divided students into smaller groups and assigned each group to a city such as Sydney, Australia. Using tablets, computers, or cell phones, groups used the IQAir website to create a community report that included PM 2.5 levels, population density, weather, geographic information, environmental policies, and other relevant features such as major industries. Groups then shared their results with the class.
In developing a community report, the students will apply concepts of natural and man-made sources of air pollution to a global context. More details and a handout are provided in Contextualizing Air Pollution in Supplemental Materials.
Evaluate: Mystery Town activity
To assess for a robust understanding of key ideas, we developed a Mystery Town activity where students are provided with a “town data sheet” for three places in the world without revealing the name of the location. This data sheet includes the local data such as population, registered cars, oil refineries, and weather, as well as a map and photos of possibly relevant aspects of the town such as shipping ports, greenspaces, and wildfires. Students first work in partners or groups of three to evaluate provided data that is on the Mystery Town data sheets to predict and justify air quality levels for each town. While students are working, ask guiding questions such as, “How were the towns similar/different? What evidence do you have for this source? Why might one source of pollution be more significant than another in a particular town?” Ultimately, students should be able to explain high levels of air pollution based on potential man-made and natural sources in the mystery area. For differentiation, teachers can first model how to use the information on the data sheet to make predictions about the air quality. The activity can also be modified to focus on a single town at a time. Additionally, pictures on the student data sheets are used to highlight features of the town so students with lower reading levels can still successfully participate. See Mystery Town in Supplemental Materials for more details.
After completing the comparison in small groups, come back together as a class. Go to the IQAir website and show students the current level of particulate matter at each location. Ask students, “How does this level match your predictions?” IQAir also provides common sources of pollution, and these can be compared to the list generated by students. We also recommend exploring the historical data. Ask, “How does the particulate matter change over time?” Some cities like Medford, Oregon have generally very low PM 2.5 levels, but due to a change in local conditions, the level may spike to hazardous conditions. Medford experiences seasonal wildfires and crop burning in the summer that increase PM 2.5 levels to high levels.
Follow this group work with an individual assessment by having students independently compare and contrast three new towns, justify predicted levels of air pollution, and describe their understanding of health impacts and trends. See the assessment and rubric provided in the Mystery Town Supplemental Materials.
Extension: Personal responsibility
One way to extend the lesson sequence into personal environmental considerations is to challenge students to reflect on personal actions that can improve air pollution. Each student is asked to propose an idea or action that they and other citizens can take to improve the communities’ shared air quality. We emphasize that students implement a claims-evidence-reasoning model to justify their proposal using concepts learned (McNeill and Martin 2011). The assignment can be conducted as a class discussion or individual written assignment.
In addition to personal actions that reduce air pollution, we recommend sharing how students can use air quality data to make personal decisions. For example, there are many apps (i.e., IQAIR or AccuWeather) that can be downloaded to provide live readings of local air quality and contaminants. Such readings can inform whether to engage in outdoor activities, especially for individuals who are at risk of asthma or allergy exacerbations. Encouraging our students to utilize this information in making decisions about their own health is a strong way to connect the science of air quality to real life.
Conclusion
Through a series of engaging inquiry activities that move from concrete experiences with dirty air to more abstract maps and data, students develop a robust understanding of man-made and natural contributors to air pollution on a local and global scale. Extension lessons can connect these ideas of air pollution to health impacts, public policy, and engineering solutions.
Online Resources
Supplemental Materials
Assessment—https://bit.ly/3YyFB7e
Contextualizing Air Pollution—https://bit.ly/3xoOXXo
Lesson Overview and Materials—https://bit.ly/3XzJmYH
Measuring Air Pollution Handouts—https://bit.ly/3xLp2cJ
Mystery Town—https://bit.ly/3xtsLeG
Connecting to the Next Generation Science Standards—https://bit.ly/3k07Eh1
Natasha Wilkerson (nwilkerson@tamu.edu), Benjamin Janney, and Rachelle Pedersen are all doctoral students in the Department of Teaching, Learning, and Culture at Texas A&M University in College Station, Texas.
Citizen Science Climate Change Earth & Space Science NGSS Technology Middle School