
Feature
Shaking out Probability
CONTENT AREA General Science
GRADE LEVEL 6–8
BIG IDEA/UNIT Probability
ESSENTIAL PRE-EXISTING KNOWLEDGE Experience with games of chance like coin flipping or rock-paper-scissors
TIME REQUIRED Three 60-minute classes
COST Less than $5 for a class of 30 students
SAFETY Take care when using scissors to cut the straw.
Understanding probability or chance, simply defined as the possibility of something happening, is essential for making life decisions and for developing science literacy. According to Stephan Jay Gould, “Misunderstanding of probability may be the greatest of all impediments to scientific literacy” (Gould 1995). For example, would you risk your life on the flip of a coin? Smokers have a 50–50 chance of dying prematurely from tobacco related illnesses (Jamal et al. 2018). The chance of winning the Power Ball lottery is 1 out of 292,000,000. Your chances of being struck by lightning over a lifetime, 1 out of 3,000, are greater than dying in a plane crash, 1 out of 11,000,000. Understanding of probability can help us make informed decisions about the actions we take on a daily basis.
The concept of probability does not explicitly appear in the in the Next Generation Science Standards (NGSS) until middle school (NGSS Lead States 2013). Probability is subsumed under cause and effect, an NGSS crosscutting concept that provides students with intellectual tools that are essential for identifying patterns in nature: Phenomena may have more than one cause, and some cause-and-effect relationships in systems can only be described using probability.
However, students have been informally developing conceptions of chance (probability) with familiar activities prior to middle school. Playing rock-paper-scissors to determine who gets the last piece of cake or flipping coins to determine who has to take out the trash are common games of chance familiar to many students. Yet these games of chance are incomplete experiences that can interfere with the understanding of basic probability concepts. For example, some students may think that a particular outcome can be influenced by prior experiences or outcomes: “I should choose heads because the last four times the coin has landed on tails,” or “I have five brothers in my family, the next sibling will be a girl.” In both cases, they believe that previous outcomes will have an effect on future outcomes. Flipping tails four times in a row or families with five male siblings are not unheard of, which could also reinforce misconceptions (Odom and Bell 2017). A key feature of probability missing from simple games of chance is the law of large numbers. Experience tells us that flipping tails four times in a row is possible, but how many students have flipped a coin 100 or 1,000 times in a row?
Probability can be a challenge to intuition because it requires learners to incorporate two contradictory ideas: (a) individual outcomes, such as the result of flipping a coin, and (b) sets of outcomes (samples) collected over time, such as the results of flipping a coin 1,000 times. Collecting observational data and examining outcomes are important processes that might help students to avoid misconceptions about randomness and better understand why certain outcomes are more likely than others (Van de Walle, Karp, and Bay-Williams 2019). When students gather enough data, they may be able to comprehend the quality of randomness and subsequently be able to estimate the probability of the occurrence of an event. The greater the number of observations, the more confident they can be in their estimations.
The purpose of this learning cycle lesson is to share an inquiry approach to constructing knowledge of probability and developing scientific skills with middle school students that emphasize problem solving while modeling effective pedagogical practices and introducing the concepts of random outcome, sample size, estimated mean, and the law of large numbers.
Engagement
During the engagement phase, students work in small groups to discuss previous experiences with games of chance based on the following questions:
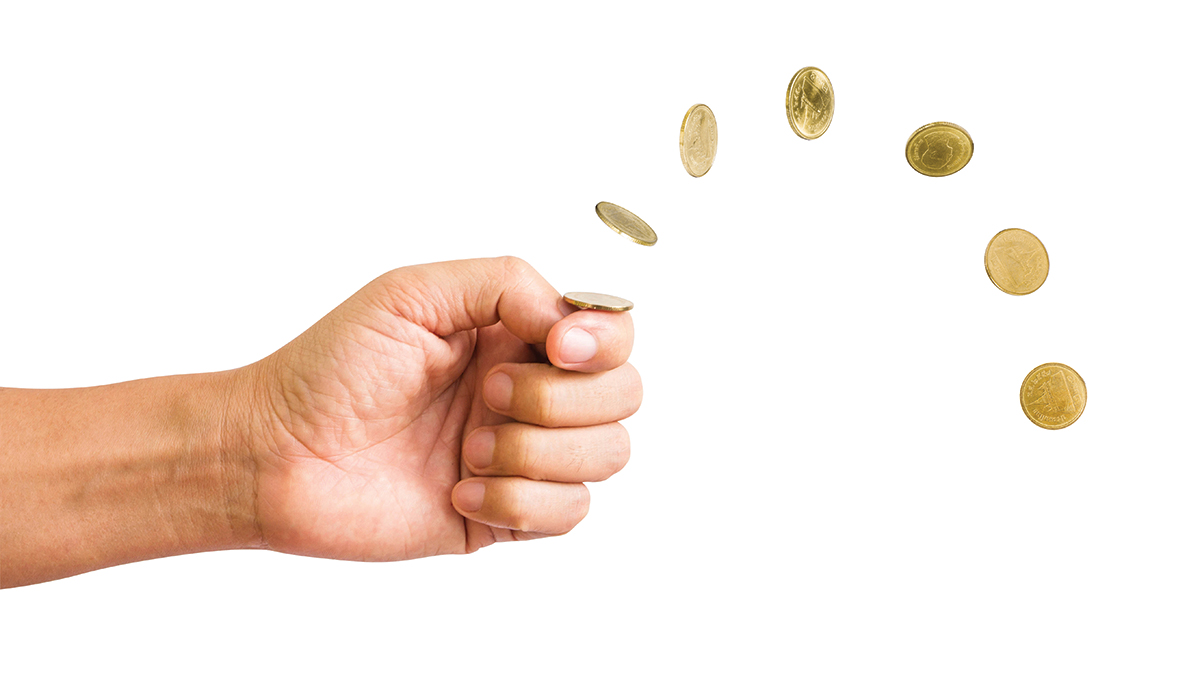
- Is it possible to predict if the flip of a coin will land on heads or tails?
- Is it possible to get heads three times in a row?
- Suppose you are able to get heads three times in a row, what are the chances of it being heads on the fourth flip?
- If you flipped a coin 100 times, how many would land on heads?
- Whole-class discussion can then focus on whether you can predict the outcome of a single flip versus 100 flips of a coin.
Exploration
The goal of the exploration phase is to investigate probability through data collection and data analysis. Students are guided to estimate the length of a piece of coffee straw by gathering and analyzing data. Data analysis will illustrate the effectiveness of the law of large numbers. A HTML5 model is available to assist with preparation of this phase (see Monte Carlo model in Online Resources). The model is fully functional but should not be used to replace the experience (Odom and Bell 2012). The question students are investigating is: Is it possible to accurately estimate the length of a straw using random sampling and the law of large numbers?
Materials
Index cards (3 × 5 inches), rulers, pencils, scissors, coffee straws, computers with Excel or other spreadsheet software.
Sequence of steps
1. Hand out one index card and a ruler to each team of two students. Ask students to draw lines an equal distance apart, such as one centimeter, across the index card (parallel to the shorter edge) and then fold the index card in half to form a fold line that is perpendicular to the lines they just drew (“hot dog” fold; see Figure 1). Tell students that they will use the index card to estimate the length of a piece of coffee straw to a high degree of accuracy.
2. Hand out coffee straws and ask students to cut off a portion and place it in the folded index card. Students should cut off a piece of straw between 0.5 to 1.5 inches long.
3. In their pairs, students should each take on one of two possible roles: (1) the designated “shaker” or (2) the line counter and recorder of data. Direct students in the role of shaker to hold their folded index cards with two fingers at each end of the fold, shake the card back and forth for a couple of seconds (see Figure 1), and then pause. (To ensure a random outcome, the designated shaker should not look at the index card and piece of coffee straw and should also avoid stopping the shaking action with the piece of coffee straw touching either finger.) After each instance of a shake and pause (a random trial), the line counter/recorder should determine the number of lines intersected by the piece of coffee straw and record that number. Ask the students to repeat this procedure 50 times. If computers are available, the line counter/recorder can enter data into a spreadsheet, which may be preformatted if desired. The line counter/recorder can easily keep a running total and a running average of the number of line intersections in the spreadsheet as data are collected (see Figure 2). In other words, the card is shaken, the number of line and straw intersections is recorded (column 2), and a running total of overall intersections is recorded (column 3). Notice that during random trial 10, the straw and line intersected one time and the total number of intersections over 10 trials was three.
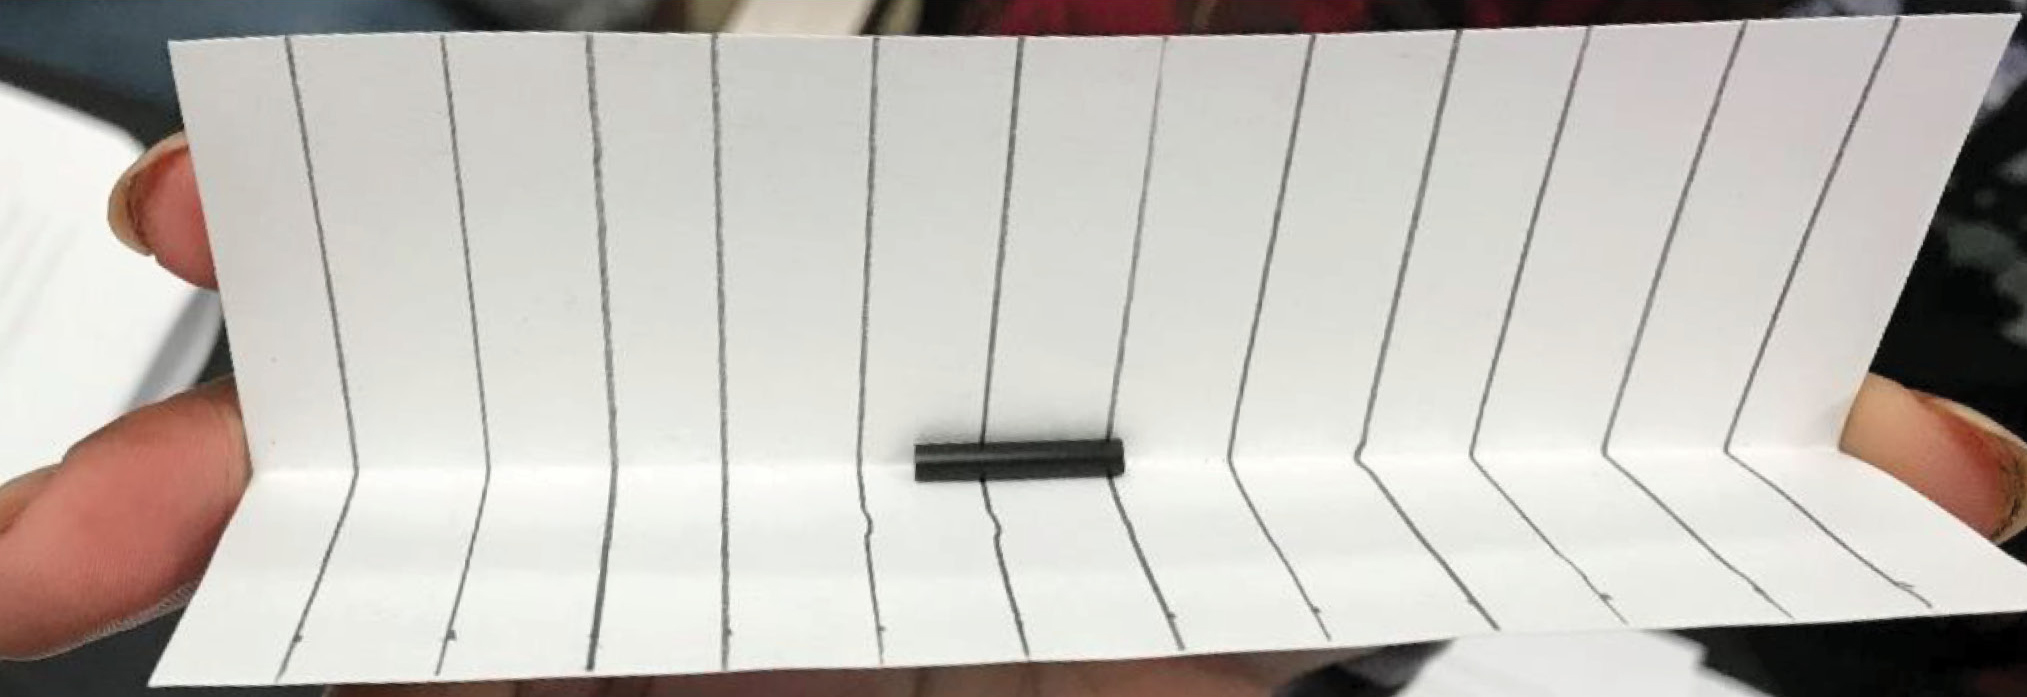
Example student index card and piece of coffee straw.
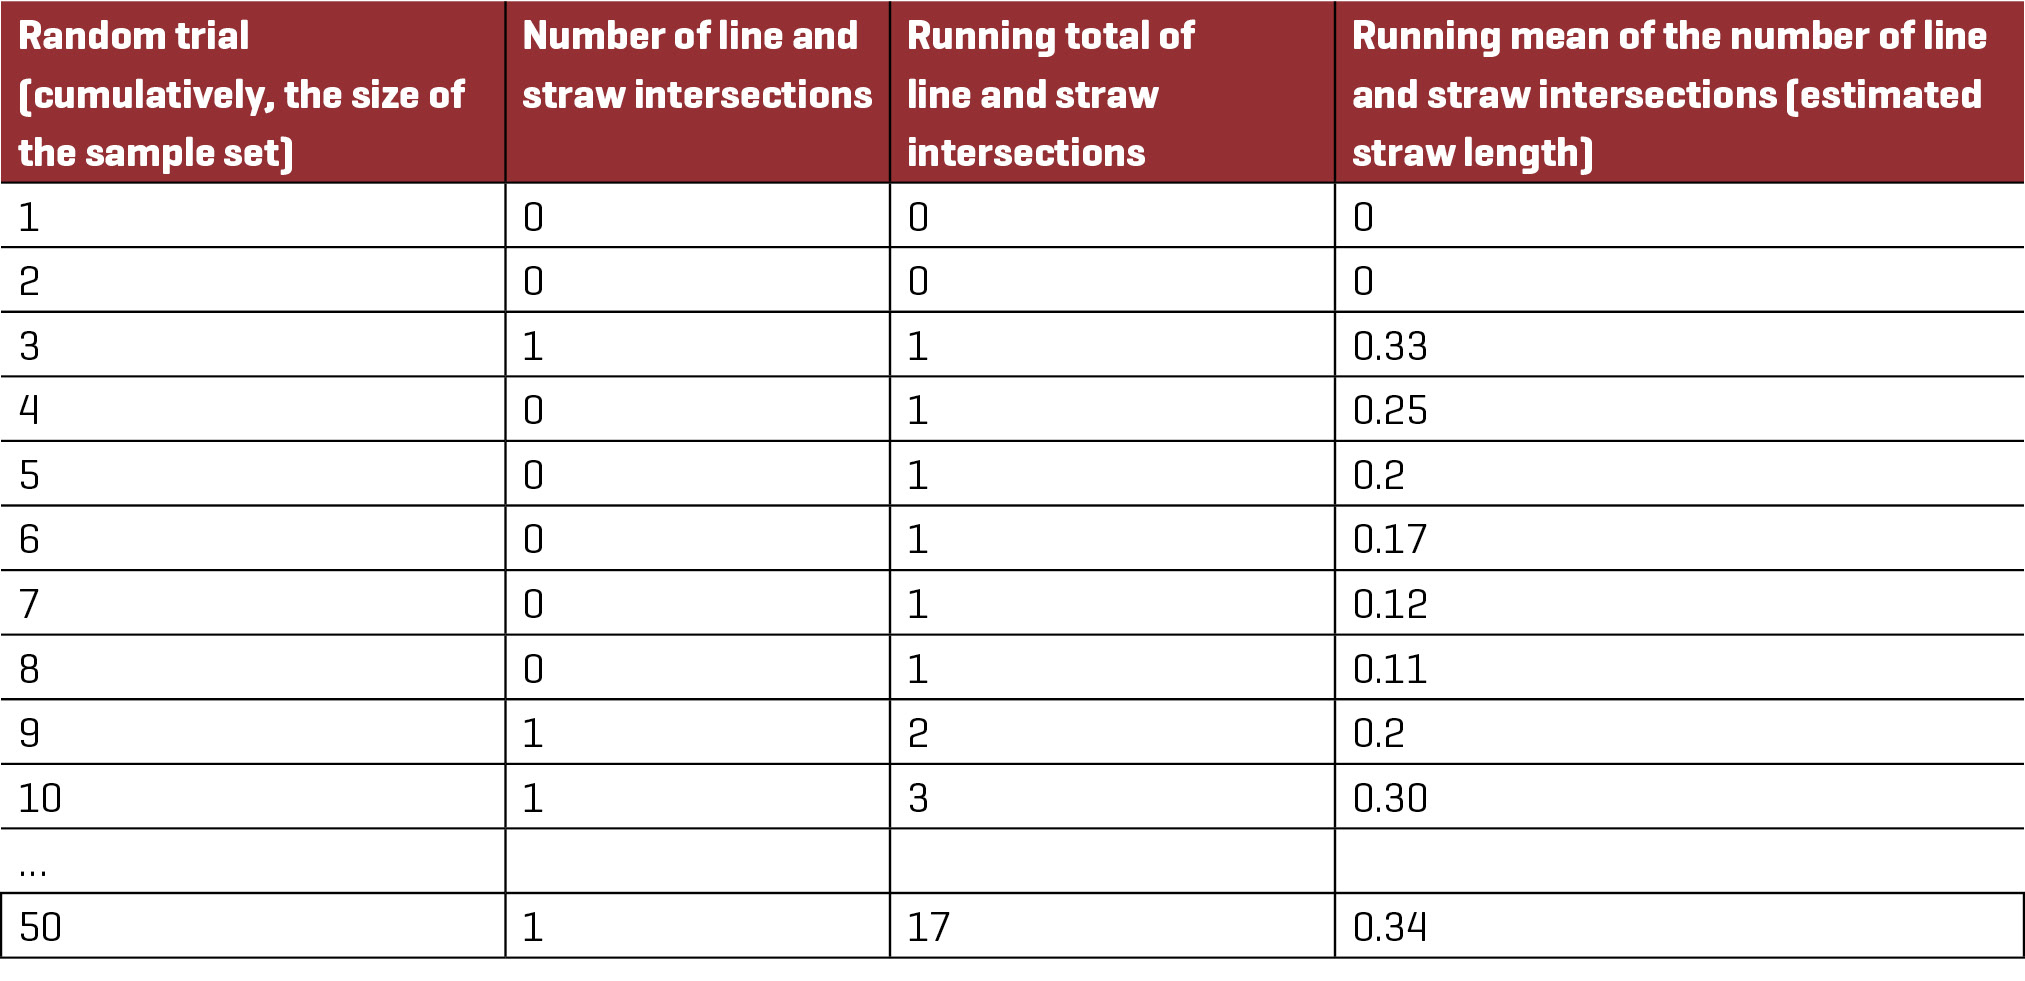
Example student record (created in Excel).
4. After they have recorded the results of 50 random trials, ask students to measure the length of the straw with a ruler and compare the observed straw length as determined with a ruler to the estimated length as determined by the mean of the numbers (counts) of line and straw intersections. After 50 trials the straw intersected the line 17 times, resulting in an estimated length of 17/50 = 0.34 (see Figure 2).
Explanation
The goal of the explanation phase is to connect terminology to the patterns in phenomena observed during the exploration phase. Students will be guided to conceptualize random outcome, sample size, and estimated mean (experienced as the running mean).
Materials
Data tables or spreadsheets from the exploration phase.
Sequence of steps
1. Have students compare the data in their Excel spreadsheets with each other and other groups. Challenge students to think about their data with guiding questions:
- How were the straw length data generated? Possible answer: By shaking the card and counting the number of lines the straw touched.
- How does the mean estimate of the straw length change as the size of the sample set increases? Possible answer: As more data points were collected, the estimated length became closer to the measured length.
2. Give students the following terms to incorporate into their data analysis: random outcome, sample size, and estimated mean. Ask students to write a general statement about each term based on the experiences with the exploration and then compare their statements and discuss the comparisons. After students express ideas about their data that incorporate the terms, you might choose to introduce a definition, if needed, of the terms or an interpretation of the data. This would occur only after students have an opportunity to debate, argue, and discuss the meanings of the data and/or terms. Following are sample student responses:
- Collecting random samples estimating the length of the straw, we collected a sample size of 50 measurements. We determined the estimated mean got more consistent. This was an experiment to determine statistics.
- The sample needs to be random to more accurately depict the length. The sample size should be proportional to the size of the population you are measuring in such a way it also accurately represents the length. As sample size increases, the estimated mean becomes more accurate because the error decreases.
3. Introduce the law of large numbers. Guide students to compare random smaller data sets (random subsets of the sample set) to the larger data set (the complete sample set) to help them understand that the size of the sample set matters when using a sample to describe a characteristic of a data set.
Elaboration
The goal of the elaboration phase is to apply the concepts of random sample, sample size, and the law of large numbers in a new context, such as estimating the diameter of a coin. A HTML5 model is available to assist with preparation of this phase (see Coin Pusher model in Online Resources). The model is fully functional but should not be used to replace the experience (Odom and Bell 2012).
Materials
Plain copy paper (8½ × 11 inches), rulers, pencils, coins.
Sequence of steps
1. Ask students, working in pairs, to devise a way to measure the diameter of a coin to the nearest tenth of a centimeter. (Suggest thinking about the method used in the exploration phase.) Possible solution: Use a ruler and pencil to draw lines 1 cm apart on piece of plain copy paper (see Figure 3). Toss, spin, or “scoot” the coin to find out how many lines it touches on the paper.
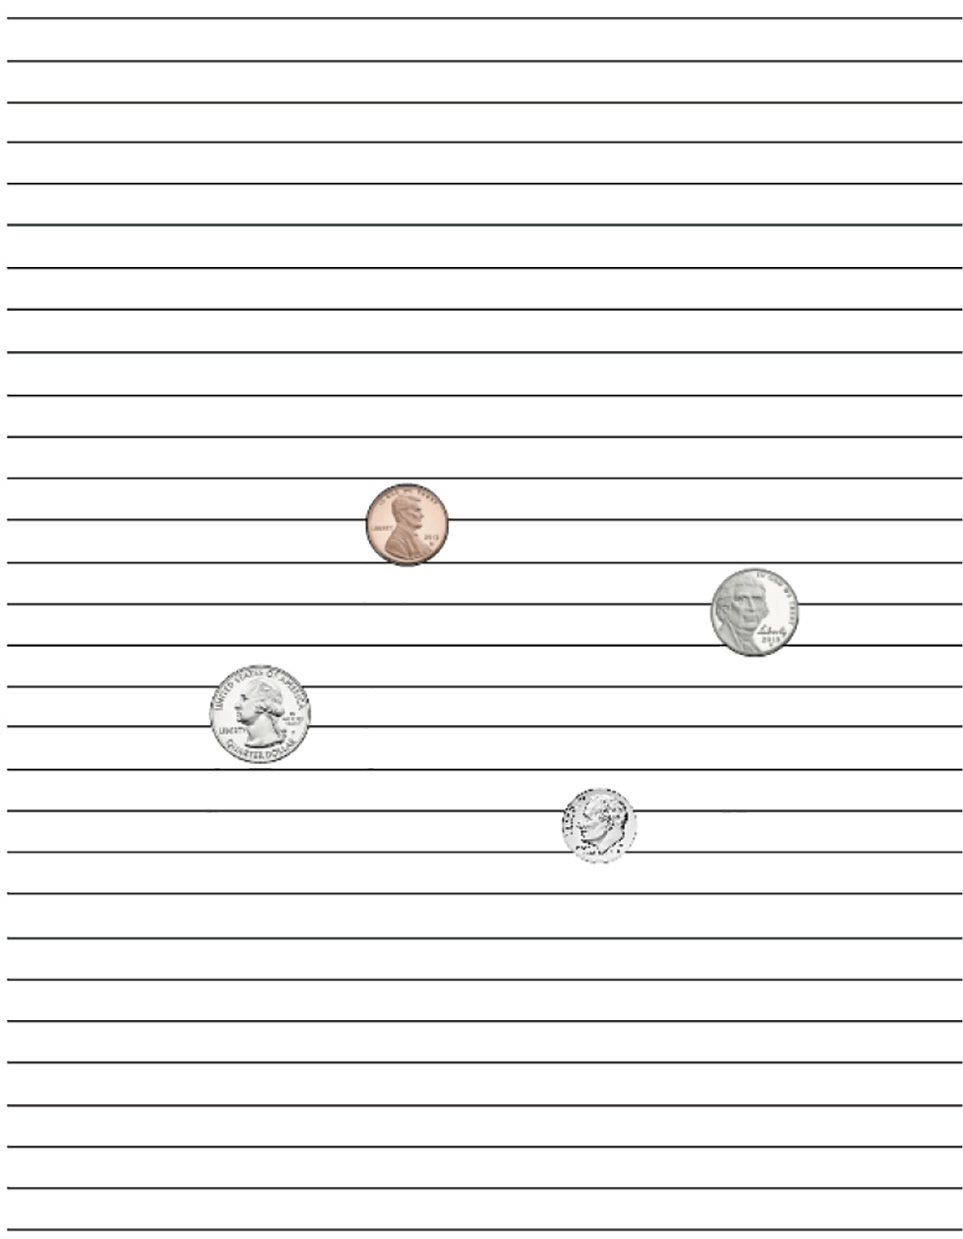
Paper with lines and coins.
2. Ask students to discuss the number of samples necessary to accurately estimate the diameter of the coin and then prepare a data collection table. Encourage them to refer to the exploration phase for ideas on sample size and table organization. Then, ask them how they will ensure that the samples will be random. Possible solution: One student pushes the coin across the paper without looking. The other student counts and records the number of lines the coin touches (see Figure 4).
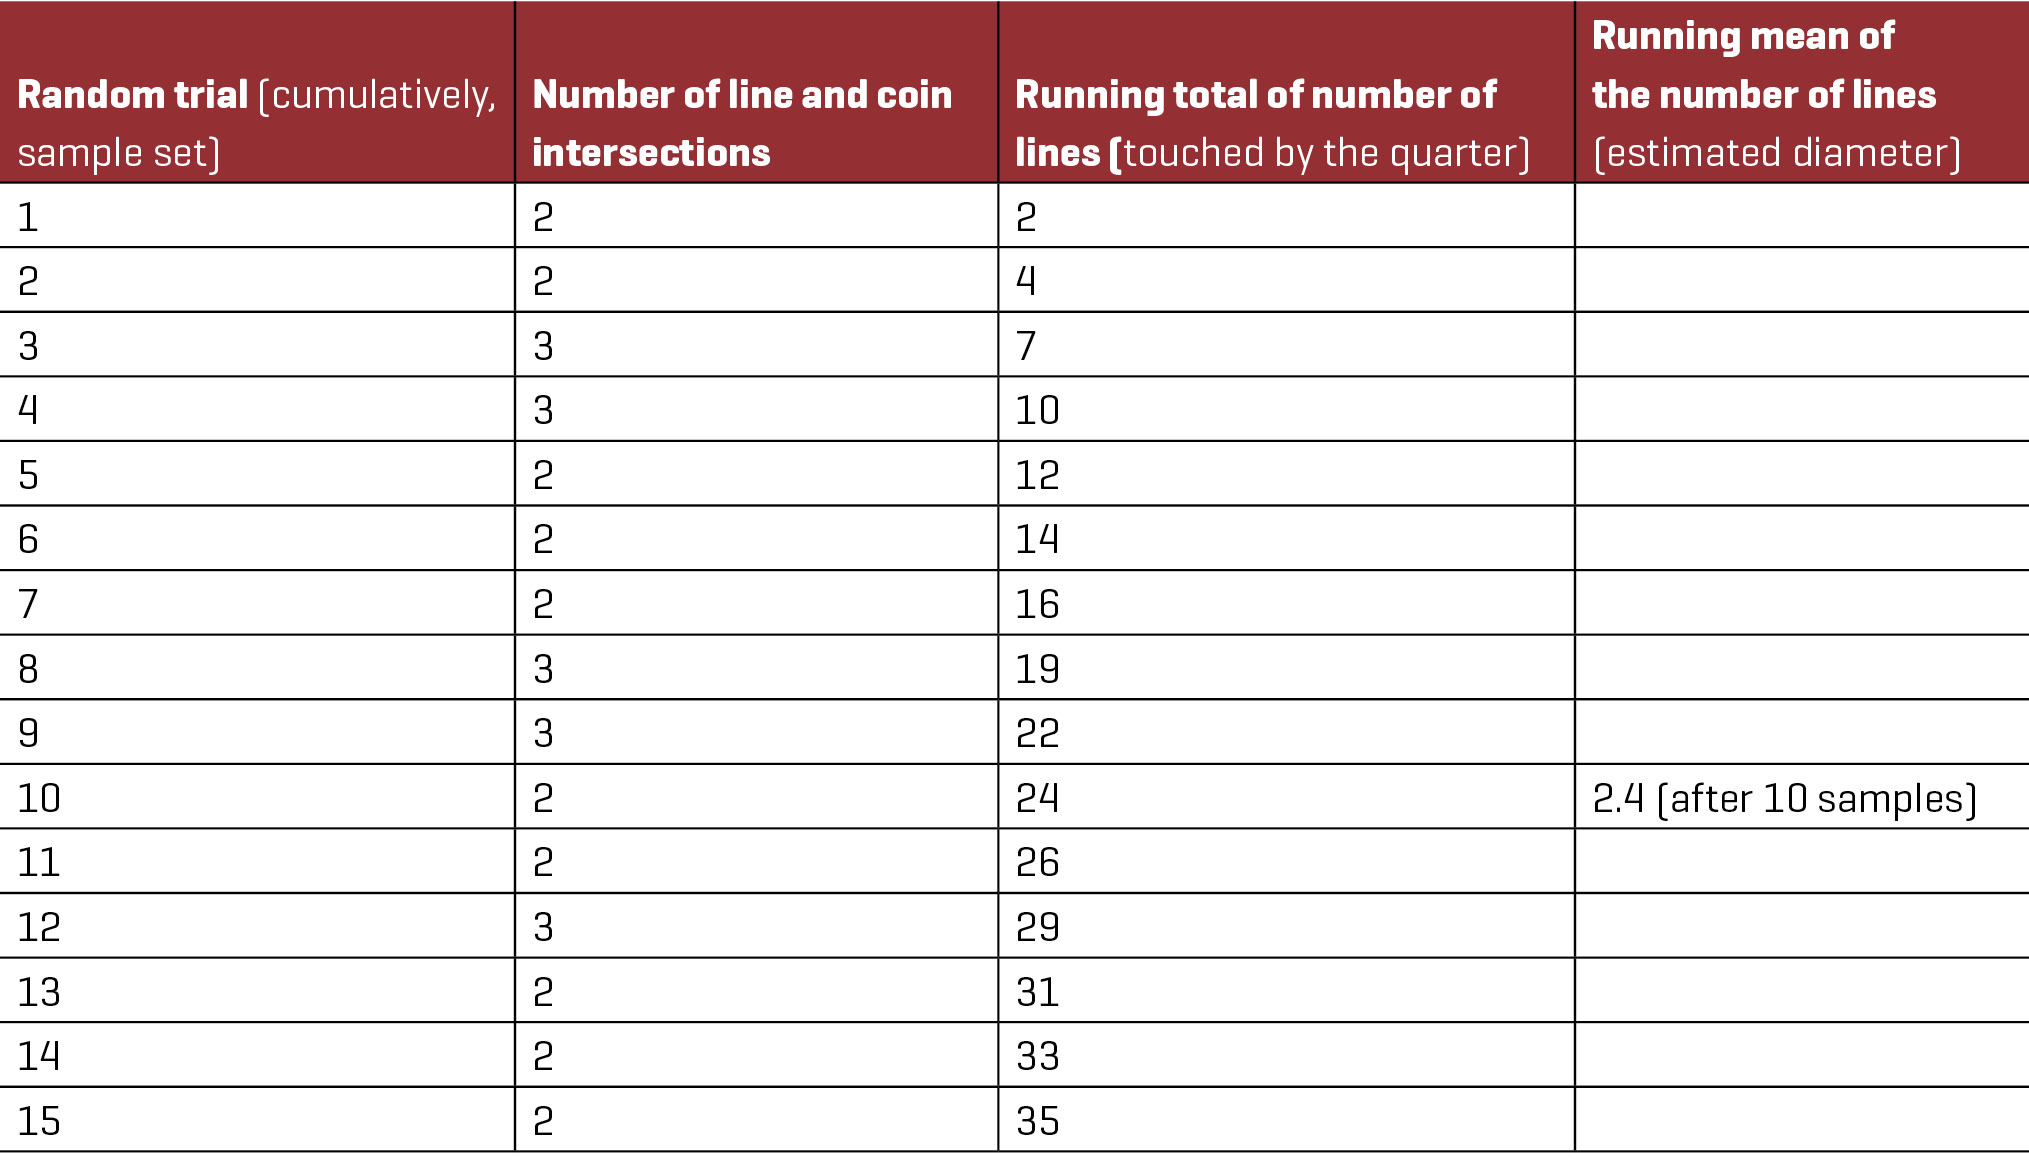
Example student record created in Excel.
3. Ask students to carry out their coin measurement procedure and record the outcomes.
4. After they have recorded the results of 50 random samples, ask students to measure the diameter of the coin with a ruler and then compare the resulting measurement to the estimated diameter as determined by the mean of the numbers (counts) of coin and line intersections. This activity takes about 10–15 minutes.
5. Guide students to compare the results of the coin measurement activity to the straw measurement activity. Ask students how the estimated means of the measurements changed as the number of samples increased. Possible solution: In both cases the estimated mean drew closer to the measured width of the coin. Ask students how random outcome and the law of large numbers could be applied to other types of measurement. Possible solutions: surveys, polls, Mendelian genetics.
Evaluation
Formative evaluation data can be observed and recorded throughout all phases of the learning cycle. For example, the engagement phase provides a view of students’ prior conceptual knowledge, such as predicting outcomes of a single coin flip as compared with predicting 100 coin flips. The exploration phase provides insight into students’ skills in collecting data and drawing conclusions. Within the explanation phase, students share reflections on how data were generated and how the mean changes as data were generated. The elaboration phase provides evidence of students’ developing knowledge as students are given an opportunity to devise a way to measure the diameter of a coin.
As an overall evaluation, ask students to construct and share a concept map about the concepts derived from the learning cycle activities. Concept map construction provides opportunities for students to compare their ideas with others and perhaps revise their thinking. The following terms can be provided to students for inclusion in concept maps: probability, patterns, individual outcomes, sets of outcomes, random outcome, sample size, and estimated mean. Another valuable benefit of concept mapping relates to teacher self-assessment. While students are constructing concept maps, the teacher will be able to see whether there were weaknesses in the lesson activities. Figure 5 is a criterion concept map.
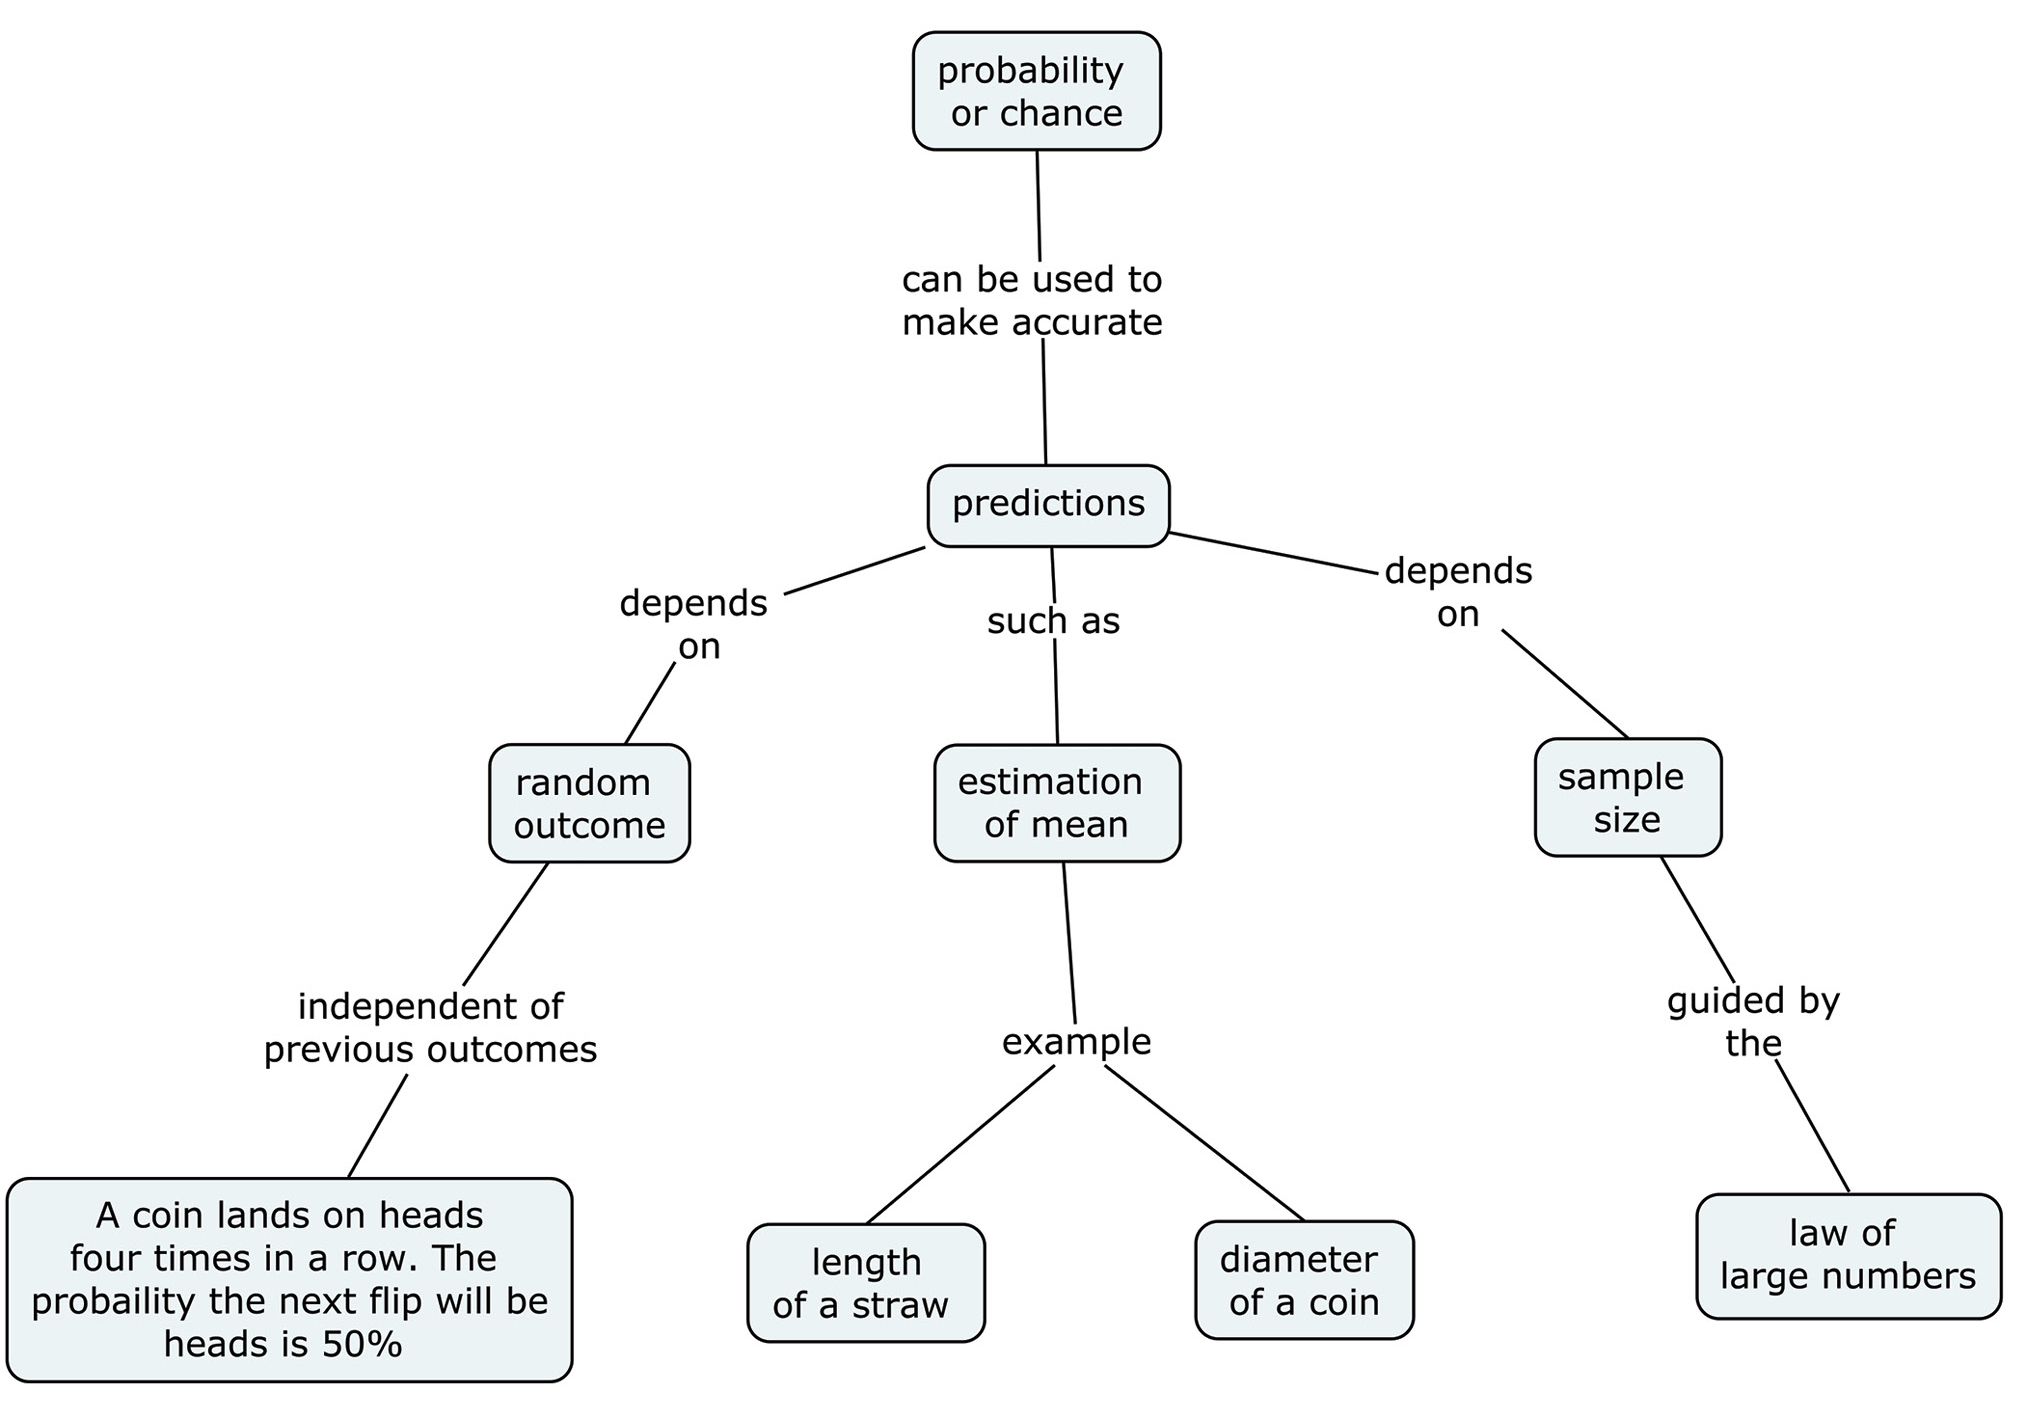
Criterion concept map on probability.
Conclusion
The straw and coin measurement activities were deliberately designed as random experiments. The collection of data over large numbers of trials and the comparison of events within the data provide an illustration of the law of large numbers—“the phenomenon in which the relative frequency of an event becomes a closer approximation of the actual probability or theoretical probability as the size of the data set (sample) increases” (Van de Walle, Karp, and Bay-Williams 2019, p. 590). The lesson described here provides conceptually intensive experiences with probability.
Online Resources
Monte Carlo model—
http://php2.umkc.edu/education/alodom/html5/montecarlo/montecarlo.html
Coin Pusher model—
http://php2.umkc.edu/education/alodom/html5/coinpusher/coinpusher.html
Arthur Louis Odom (alodom@umkc.edu) is a professor and Clare V. Bell is an associate professor, both in the Department of Teacher Education and Curriculum Studies at the University of Missouri–Kansas City.
5E Crosscutting Concepts Mathematics Middle School