
Feature
Weathering the Virtual Storm
Using Computational Thinking to Make a Forecast
Science Scope—May/June 2021 (Volume 44, Issue 5)
By Joyce Massicotte, Carolyn J. Staudt, and Cynthia McIntyre
CONTENT AREA Earth/Environmental Science
GRADE LEVEL 6–8
BIG IDEA/UNIT Weather can be forecast through computational thinking skills.
ESSENTIAL PRE-EXISTING KNOWLEDGE Use and share observations of local weather conditions to describe patterns over time; understand the purpose of weather forecasting.
TIME REQUIRED Approximately 13 class periods (45 minutes each)
COST No cost
SAFETY No safety issues
From the Farmers’ Almanac of yesteryear to modern computational models and forecasting software, our ability to make weather predictions has greatly improved, thanks to a fusion of math, science, and computing (Luoma, Mathiesen, and Kleissl 2014). Weather is an ideal platform to merge mathematics and computational thinking within real-world science activities and is included throughout the Next Generation Science Standards (NGSS) from kindergarten through grade 12 (NGSS Lead States 2013).
Authentic tasks, such as predicting the weather and preparing a forecast for a special event, are essential for promoting student learning and reflection (Sandoval and Reiser 2004). Technology-based modeling and simulation environments can support such complex activities (Chinn and Malhotra 2002) and have shown significant promise for supporting learners in moving from novice to more expert perspectives (Zhang, Liu, and Krajcik 2006). They can also help students learn crucial aspects of computational thinking (Weintrop et al. 2015).
The Concord Consortium and our partners have developed a free seven-lesson middle school curriculum unit as part of our Precipitating Change project (Staudt, Moher, and Massicotte 2019). Students actively employ computational thinking skills and science and mathematics understanding as they collect and analyze data, run and refine weather models, and make and evaluate predictions while doing tasks similar to those of a professional meteorologist.
Computational thinking skills encourage students to think about new information and problems with a logical structure that can be transferred to other complex situations later on. Throughout the unit, these skills are carefully integrated into each activity as students complete each lesson’s weather science challenge, though the explicit vocabulary for each skill is not introduced until the final lesson. At the end of the unit, students review all the terms for the computational thinking skills used throughout the unit (see Figure 1) in a reflection activity that serves as confirmation that they were engaged in higher level authentic tasks.
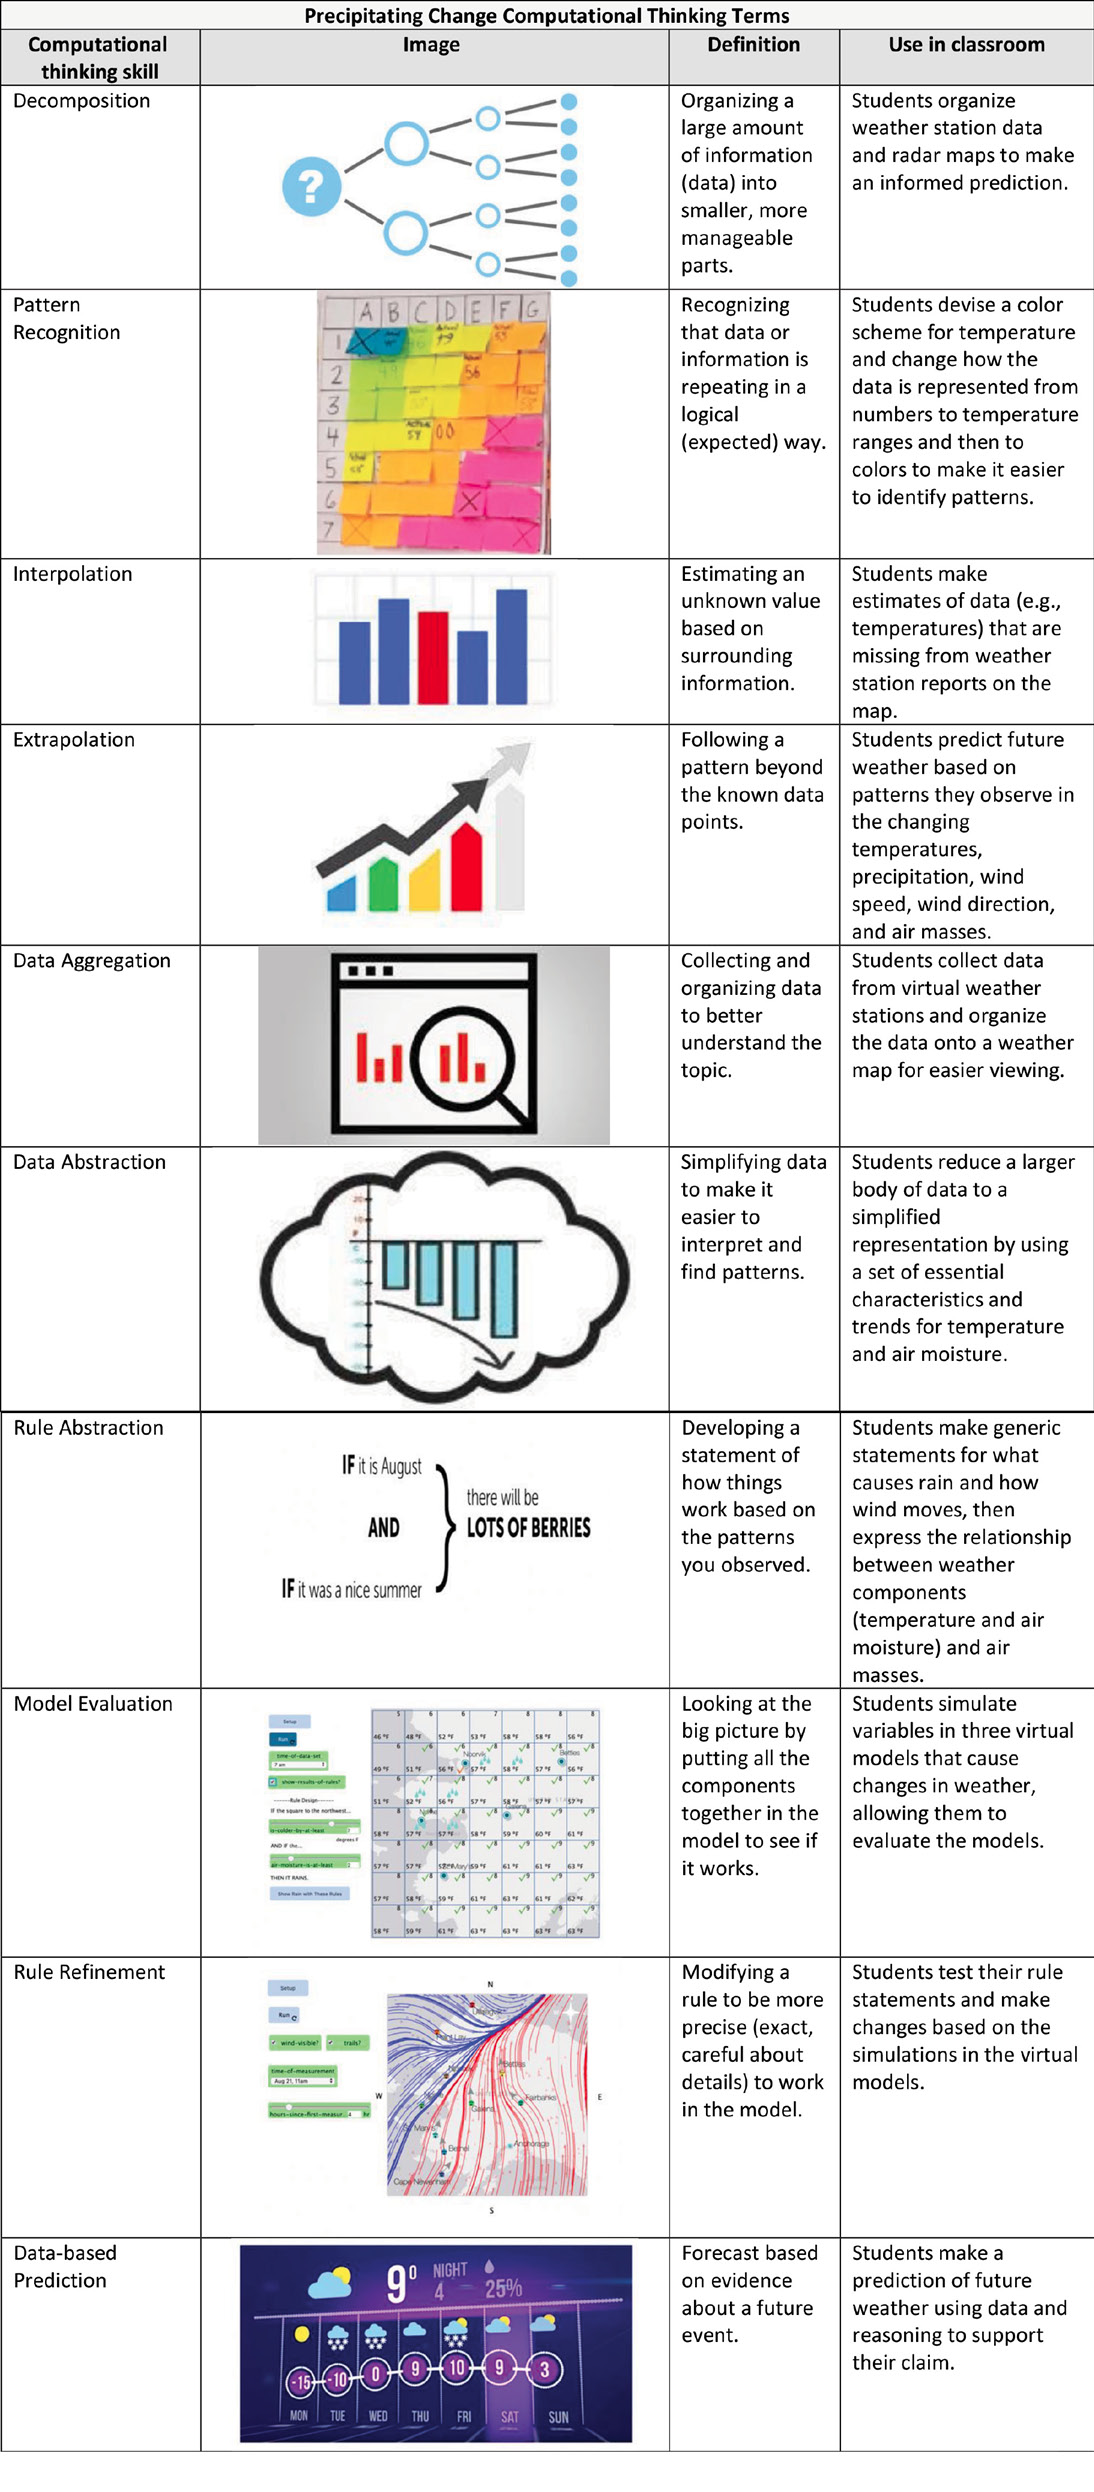
Computational thinking skills integrated into the classroom activities in the Precipitating Change project.
Because vocabulary can help students make sense of and describe their learning as well as connect with experts, students have access to a glossary linked from key terms in context, where they can learn more about various weather-related terms (e.g., precipitation) and view them as pictures or diagrams or watch a short movie about the context of the words.
The curriculum was designed to be empowering for Alaskan Native students by recognizing and valuing their local culture to boost learning. (Glossary terms were also translated into three Native languages: Inupiaq, Yugtun, and Gwich’in.) Each lesson includes a short informational video from a well-known Alaskan meteorologist, Jackie Purcell, in which she highlights different facets of her job and describes how the same content, skills, and vocabulary that students are learning are used in the weather forecast. Additional informational videos are included from Indigenous Elders who provide their perspective on the importance of weather to their livelihoods. Highlighting positive mentors that students can relate to adds relevancy to what they are learning and opens the window of possibility for them in their lives.
Precipitating Change weather curriculum
The curriculum targets two main NGSS standards: MS-ESS2-5 (Collect data to provide evidence for how the motions and complex interactions of air masses results in changes in weather conditions) and MS-ESS3-2 (Analyze and interpret data on natural hazards to forecast future catastrophic events and inform the development of technologies to mitigate their effects). The curriculum design uses an “embedded phenomena” framework in which a simulated scientific phenomenon is mapped onto the physical space of a classroom (Moher 2006). In Precipitating Change, a virtual cold front moves across the state of Alaska, bringing heavy precipitation as it meets a warmer air mass moving in from the south. This weather event is scaled to classroom size by a grid representing the area of Alaska on which students report temperature, air moisture, and precipitation data from virtual weather stations in various locations in the classroom. Transforming the classroom into a physical representation of their state gives students a shared object of collaborative inquiry (Moher 2006).
Students throughout the United States can use the Precipitating Change curriculum to learn about weather, weather prediction, and place-based learning from an interesting geographical part of the country. Students in the lower 48 states may be intrigued by Alaska’s extreme climatic conditions. Teachers may describe other important local events for their own community and how local weather forecasters play a role in deciding whether to hold these events. For example, Massachusetts and Chicago teachers focused on predicting the weather for a November fun run event.
Making a weather prediction
Engage (Lessons 1–3, approximately four class periods, 180 minutes)
Students begin by taking on the role of a meteorologist asked to make a preliminary recommendation on whether to hold, postpone, or cancel the Native Youth Olympics (NYO) in Anchorage, Alaska, based on an initial analysis of weather radar maps. The annual NYO is a national competition that attracts youth and families from remote villages throughout the large state. Native Alaskans train for months to compete in activities that have a rich history in local traditions. For example, in the “seal hop,” contestants mimic a seal’s movement on the ice, which was traditionally practiced to improve hunting skills. The weather plays a critical role in determining if school groups and families can safely fly into Anchorage for this central cultural event.
In Lesson 1, students look at weather station data from five major cities across the state as well as five radar maps of the sky every four hours during the 24-period before the start of the NYO. In this early activity, students have their first opportunity to read data tables with temperature, moisture, and wind direction and see precipitation on a map in their science notebooks in order to make an initial weather prediction for the day of the planned event. Students may notice that they do not have enough information at this point to be completely confident of their prediction.
In Lesson 2, students work in small research teams to track a virtual storm, based on historical records of actual measured weather conditions collected by Argonne National Laboratory. Using a weather station dashboard (see Figure 2), the teacher initiates the virtual storm simulation and sends changing temperature, air moisture, and precipitation readings to students’ mobile devices as they stand in different locations in their classroom (see Figure 3), which has been turned into a 7 × 7 grid representing a large area spreading from Nome to Anchorage. The goal is to fill in approximately 10 cells in the grid and have the class interpolate and extrapolate the rest of the data to replicate the same process used by weather scientists, so student team sizes may vary. With their teams, students select their location on the grid, in which each cell represents a weather station, and gather data at three different times (7 a.m., 11 a.m., 3 p.m.). Students who are data recorders transcribe the data from the weather stations onto weather map posters for the whole class to be able to view the temperature data changing over time and location.
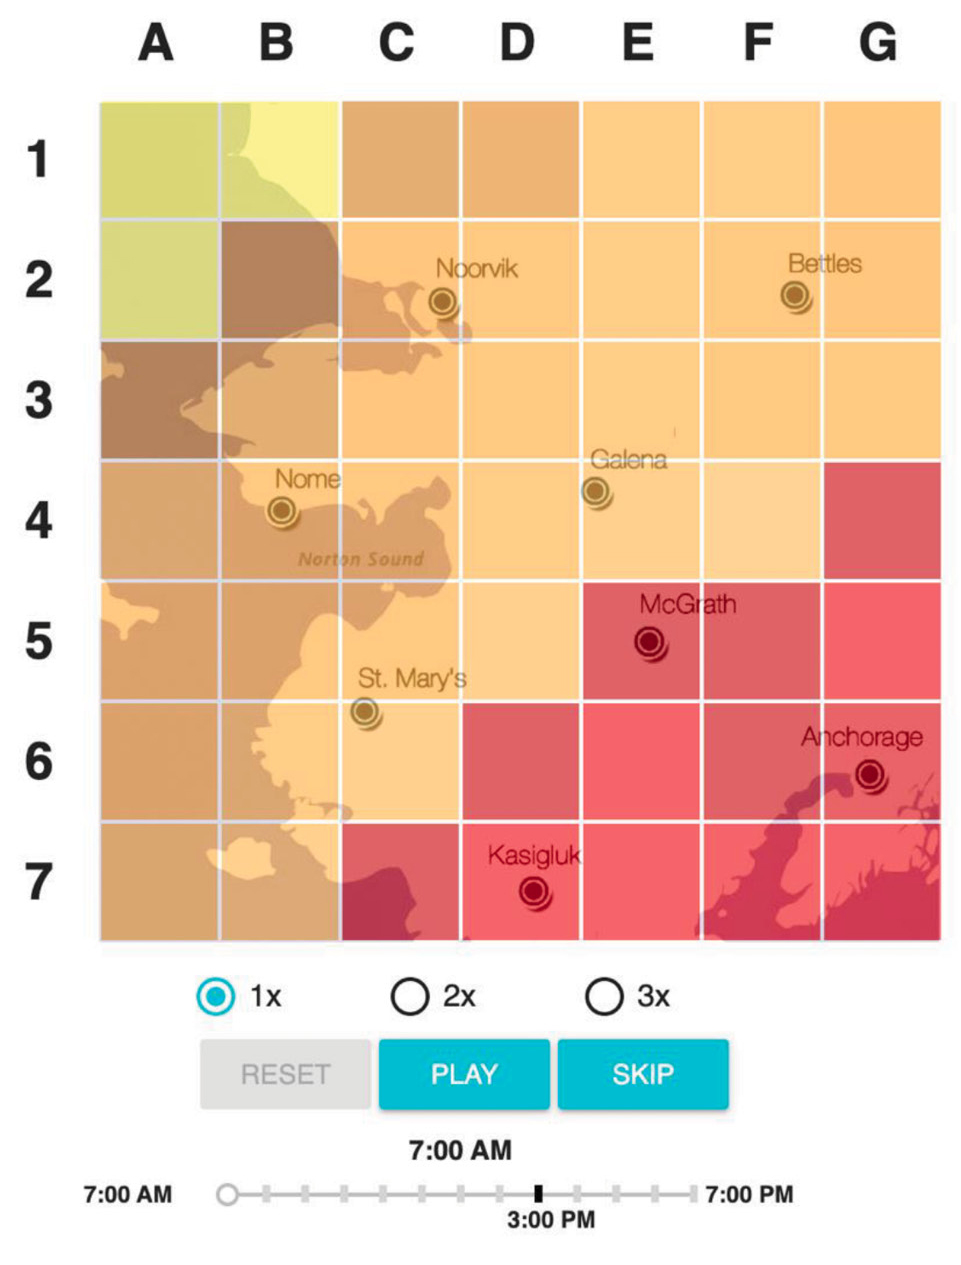
Teacher weather station dashboard for Alaska showing the larger map of the region.
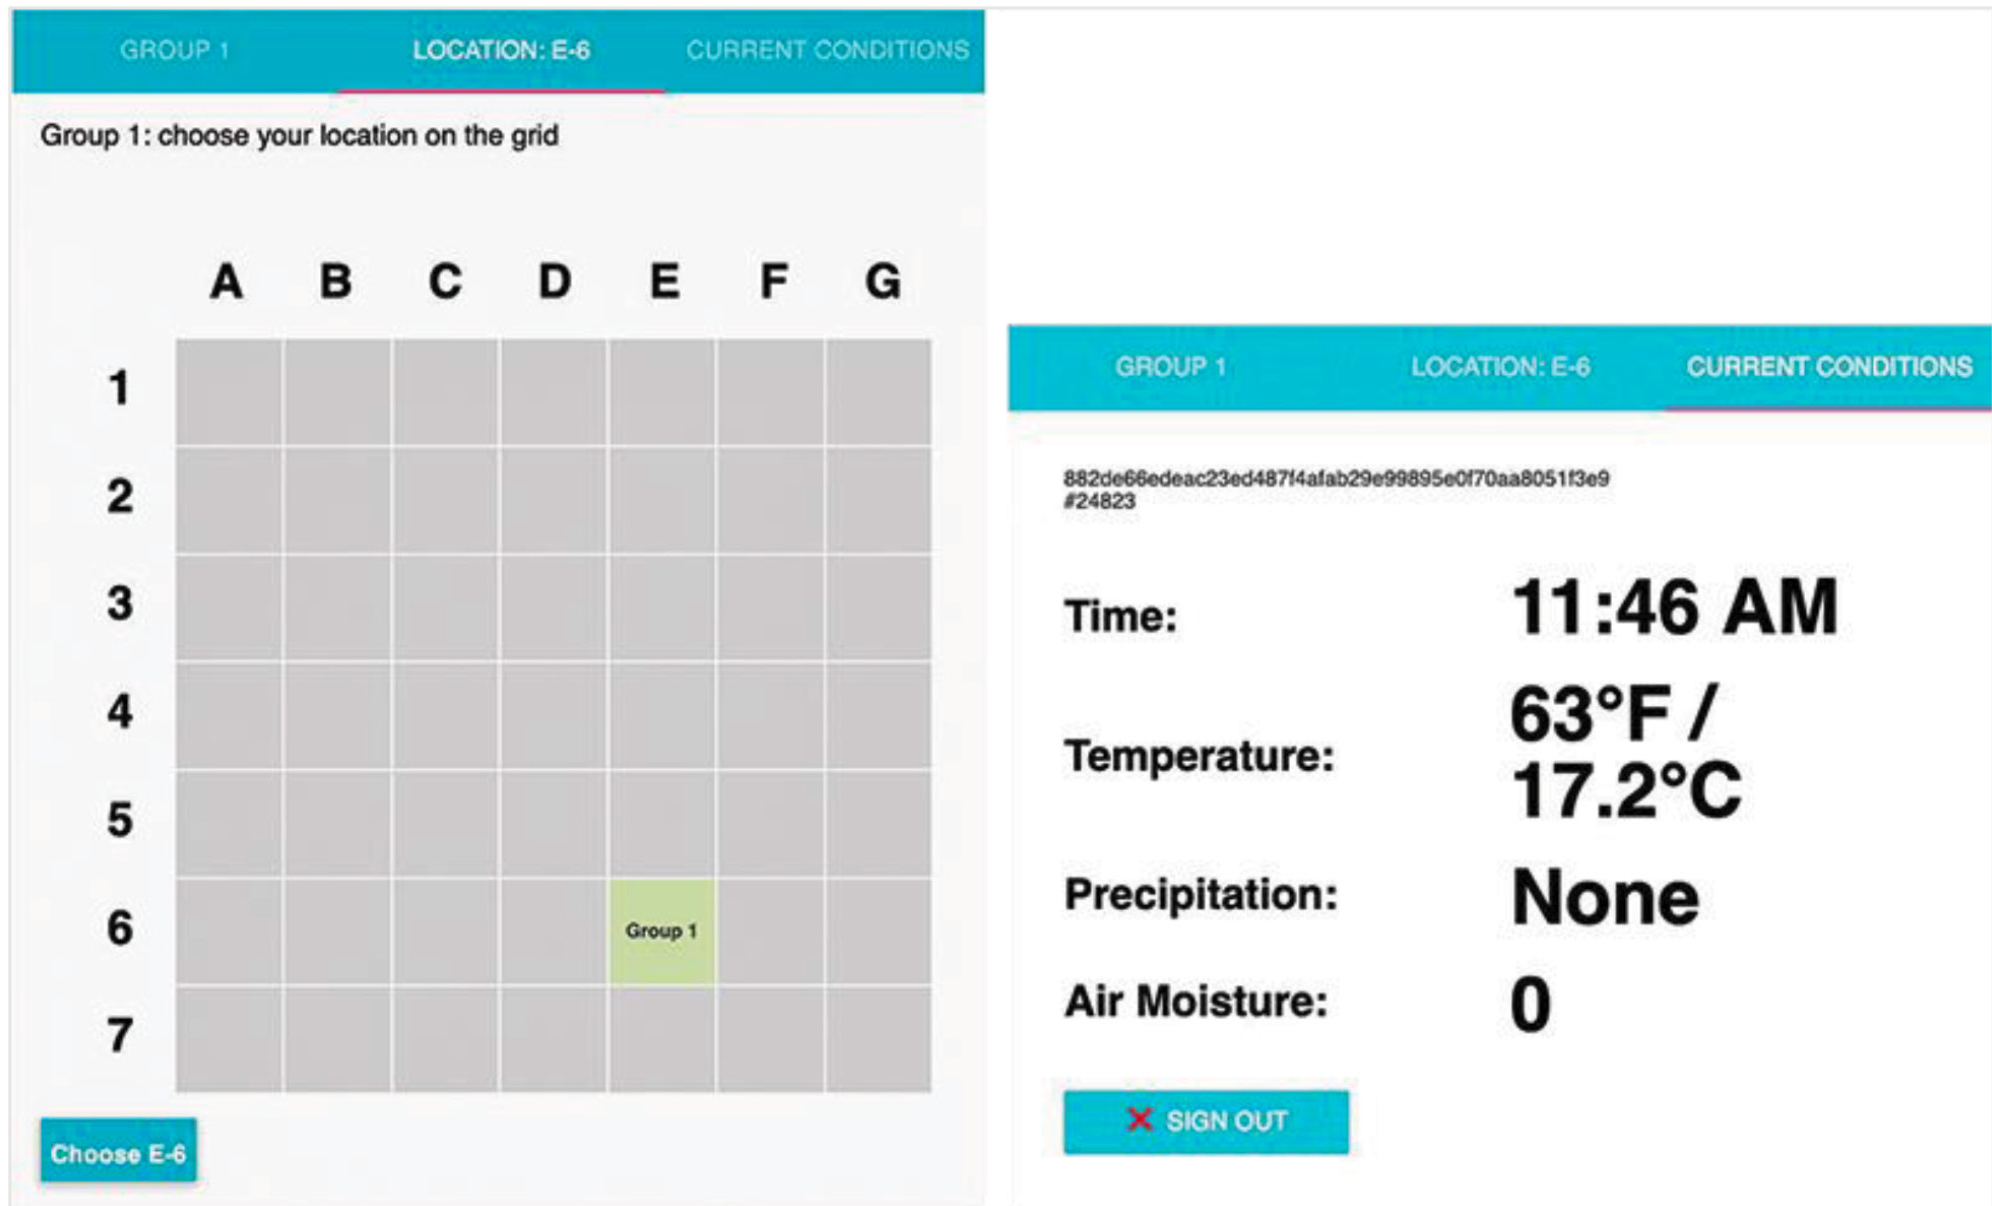
Student group weather station display for grid E6
To make sense of the numerical temperature data and look for patterns, the whole class engages in the next activity during which students change the data representation from single temperature values to a color associated with a range of values. They assign a colored sticky note to each temperature range. For example, a yellow sticky note may represent 60–70°F and orange 50–60°F. Once a color scheme is developed, students place the colored sticky notes over the raw data to create a more abstract representation that allows them to see emerging patterns (see Figure 4), as well as the movement of the storm over time on their classroom weather maps. Students then consider what meteorologists do in areas where there are no weather station readings.
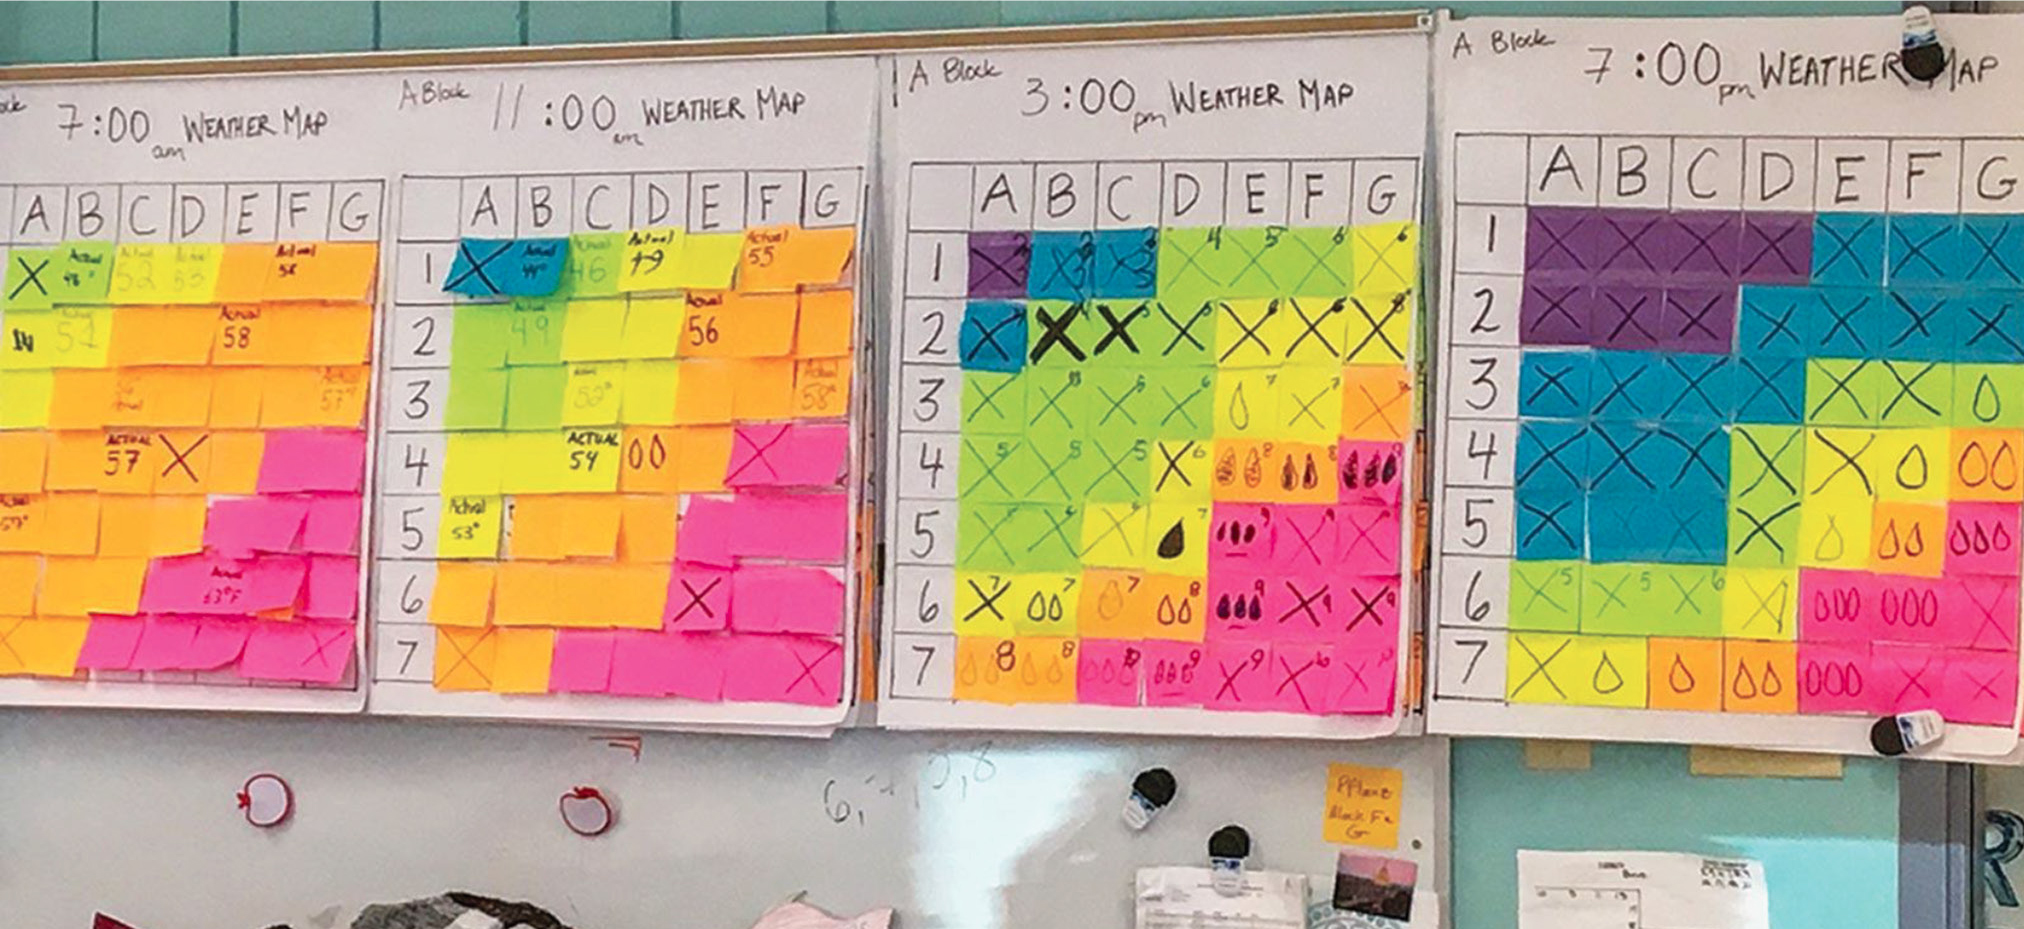
The whole class records data and patterns from different time stamps in the weather stations.
Weather scientists are able to make predictions for areas as large as Alaska by interpolating or estimating an unknown value based on surrounding information. Likewise, students estimate the values of missing data in areas of the grid where they do not have weather station data yet using multiple interpolation methods (linear, nearest neighbor, and weighted average interpolation). Students then create a visual storyline with the time series of weather maps to be able to extrapolate patterns and construct simple predictions of future weather conditions.
In Lesson 3, students revisit the weather map posters they constructed earlier and add precipitation and air moisture data for one time point in order to explore the patterns and relationships they see between temperature, air moisture, and rain. For example, it rains when the temperatures get warmer and there is more moisture in the air. The virtual phenomenon format allows students to actively engage in their own learning as they work within their research teams to replicate the real-world task of tracking a storm.
Building rules based on data
Explore (Lessons 4–5, approximately three class periods, 135 minutes)
In the first three lessons, students build a foundational set of computational thinking skills and learn how data is acquired, synthesized, and formulated in different ways for better analysis. They are now equipped to test their understanding of the relationships between natural phenomena of temperature, air moisture, and wind with the help of both virtual models and a hands-on wind tunnel.
Using the virtual models, students can test their understanding of how weather works. In Lesson 4, the model allows students to enter different variables to try to identify a rule for weather conditions that produce precipitation. Students are asked to create specific two-part “IF _ and IF_ THEN_” statements in order for the model to run. For example, IF the temperature difference between two locations is 5°F and IF the air moisture is high, THEN it rains.
In Lesson 5, students explore how the weather is affected by wind direction with an optional hands-on wind table they construct with simple materials. Using fans outfitted with cardboard wind tunnels and miniature wind vanes, students plot where two air masses collide on their graph paper, which represents the large land area where they live (see Figure 5). The fans are placed perpendicular to each other and students learn to record the wind by showing the direction the wind (i.e., the air blown from the fan) is coming from. Students can place a wind vane anywhere on the graph paper, observe which way the wind vane is pointing, and draw a matching arrow on the grid. Students may notice the wind vane spins as the two fronts meet, making it difficult to decide which direction the wind is coming from. In that case, students can leave that area blank. The blank squares should leave a visible delineation between the two air masses, signifying how a front is formed. Students can also place a Styrofoam ball on the wind table to see the interaction between the two air masses. If it is placed at the intersection of the two air masses, the ball will tend to curve.
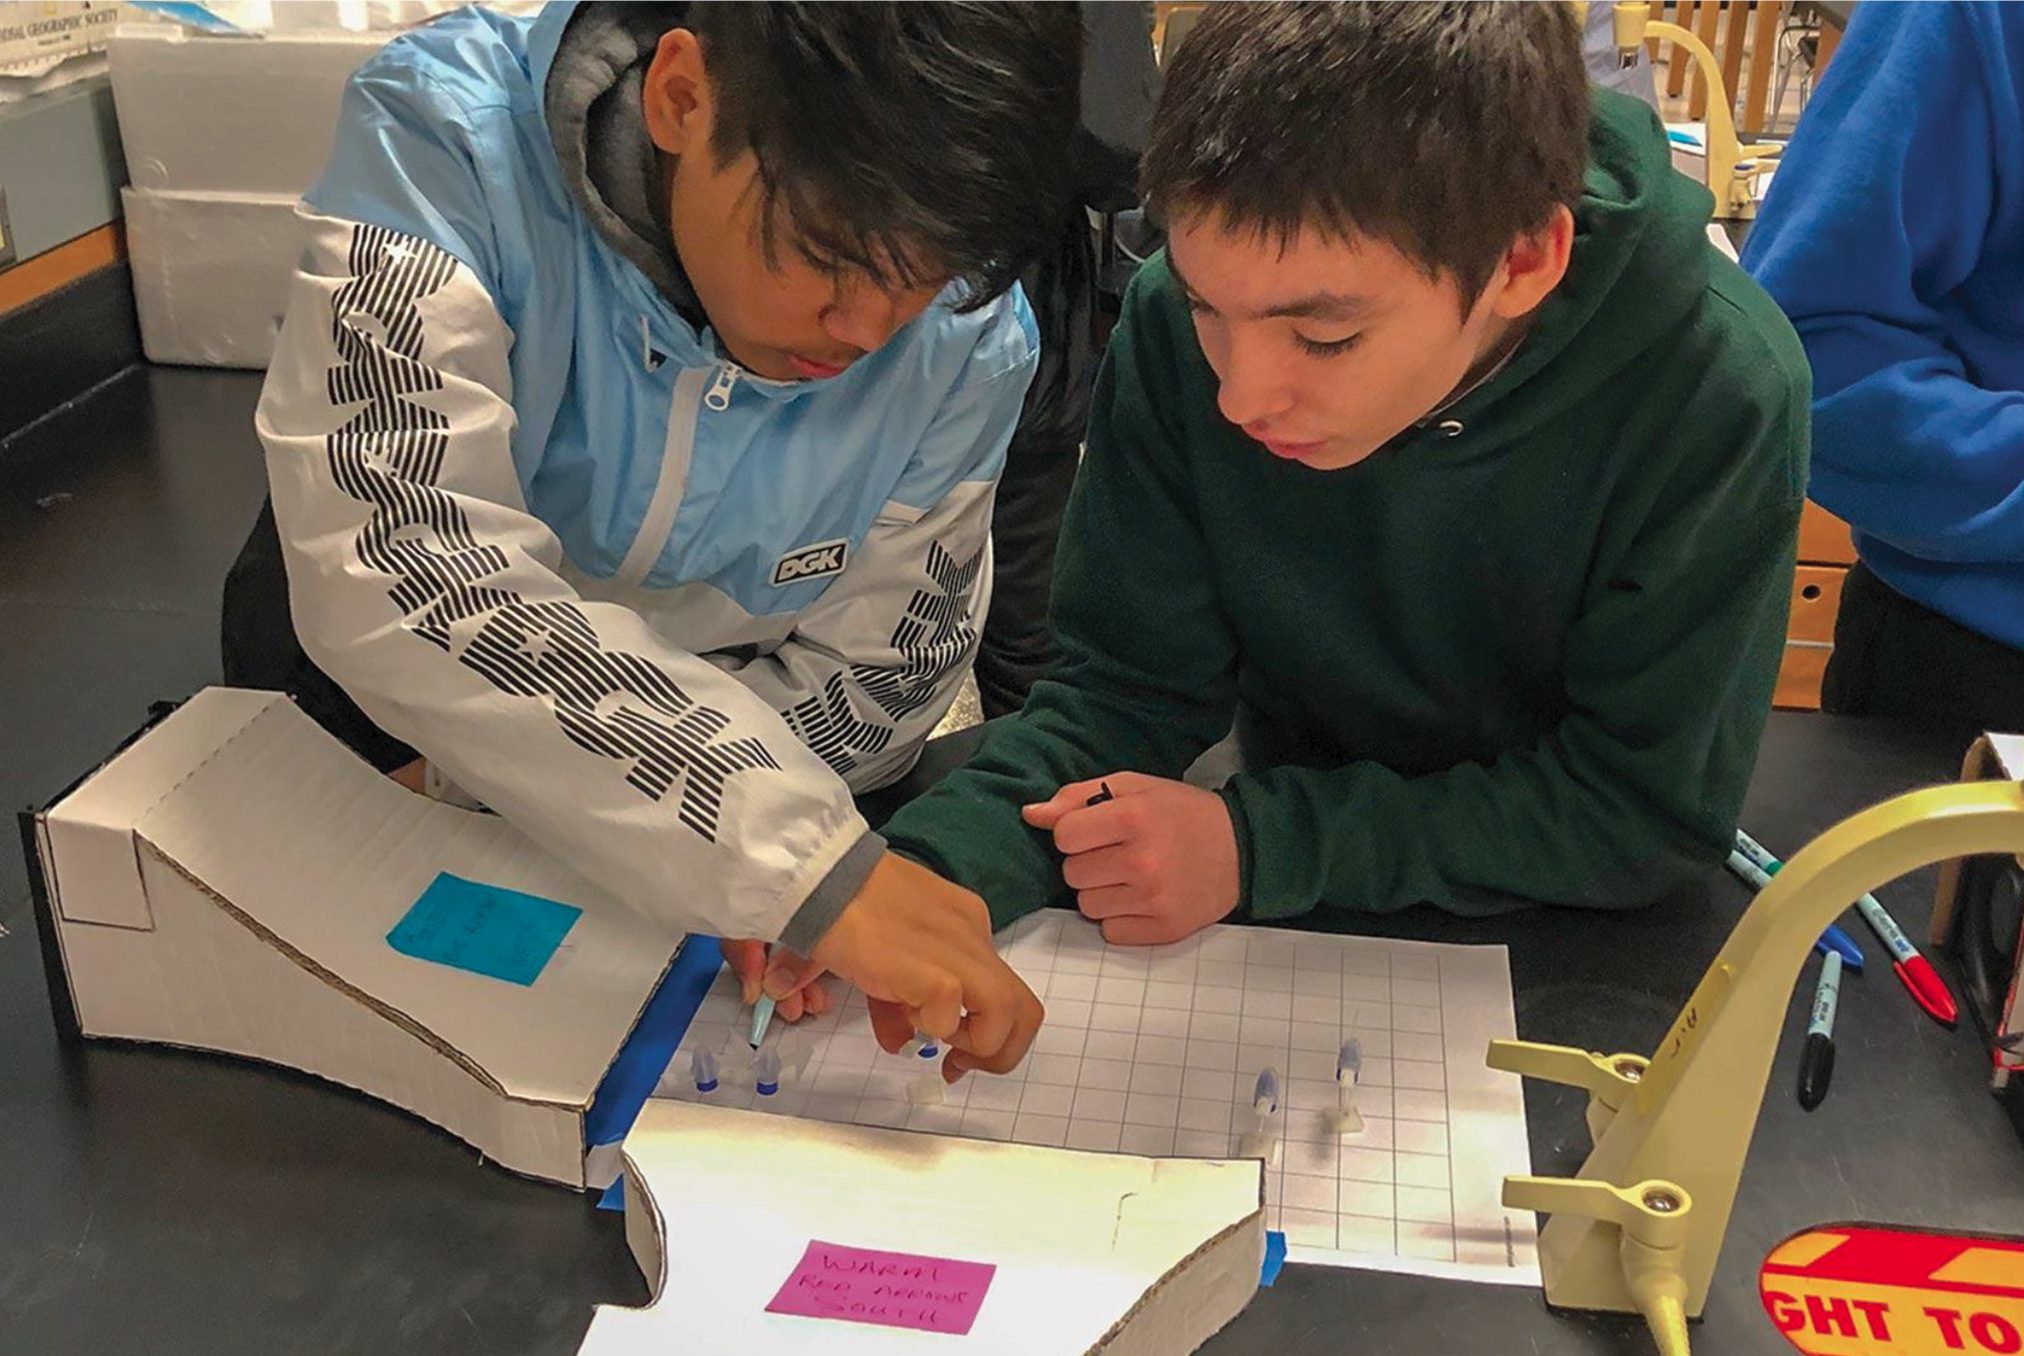
Students use a wind tunnel to investigate wind direction.
Next, students apply what they learned from this hands-on activity and test their theories in a virtual model that offers enhanced abilities to control the temperature and moisture of air masses. Their challenge is to integrate what they have learned from the modeling environment and develop a statement to answer the question, “How do air masses affect where it rains?” Students may discover that precipitation generally occurs along the front if there is a difference in temperature between the two air masses and tends to form on the warmer side of the front. Teachers may need to scaffold these lessons with whole-class discussions to elicit ideas about air masses, as student conceptions about air may not be fully formed (e.g., because air is invisible, students may not understand that it is a substance that can move). Students will also see that precipitation forms in other places. If the air masses are quite dry, they may not produce precipitation. On the other hand, the warmer the air, the more moisture it can hold before precipitation appears. Very warm air can hold a lot of moisture, producing a humid day without any rain.
Integrating three-dimensional learning
Explain (Lesson 6, approximately two class periods, 90 minutes)
In Lesson 6, students complete the final analysis to develop a scientifically based prediction of whether a storm front will cause havoc on the day of the National Youth Olympics. Students review the weather station data and radar maps from Lesson 1 and integrate new weather simulation data detailing the position of the storm front the day before the event (see Figure 6). Students learn how the model can be used to produce the position of the front based on the wind direction data from the weather stations. They are provided with data from the simulated fronts from 11 a.m. and 9 p.m. two days before the event and 7 a.m. on the day before the event, which they use to determine how fast the front is moving. Students explain and support their final recommendation to the planning committee to hold, cancel, or postpone the Native Youth Olympics.
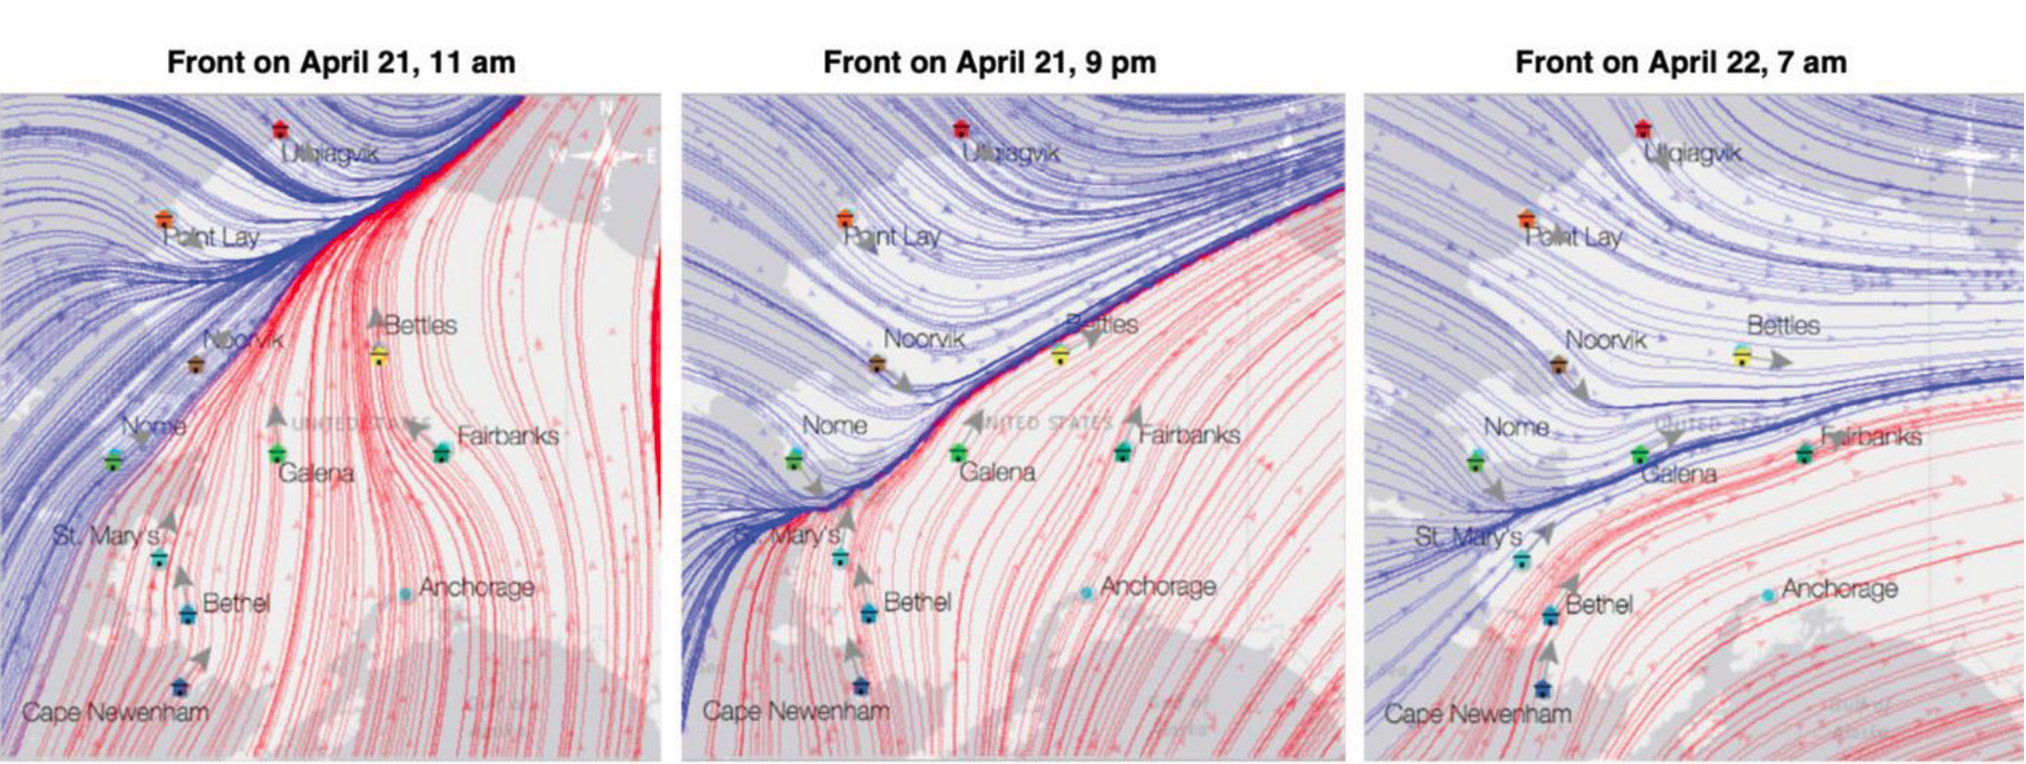
Virtual simulation displaying the position of the storm front.
Elaborate (Lesson 7, four class periods, approximately 180 minutes)
In Lesson 7, students reflect on the computational thinking skills they practiced throughout the Precipitating Change unit: decomposition, pattern recognition, interpolation, extrapolation, data aggregation, data abstraction, rule abstraction, model evaluation, rule refinement, and data-based prediction. They are introduced to these vocabulary terms and may recognize artifacts (e.g., the sticky note representation as an example of pattern recognition). As a class, they recall when they used the different skills throughout the lesson. This can also serve as a good time for teachers to engage students in a lively classroom discussion about computational thinking and how these skills will be important for future careers.
In the culminating project, students work in their small teams to produce a presentation combining the evidence they have collected from all prior lessons, including radar maps and virtual simulations, into a final forecast and recommendation to the event planning committee. Students are provided with sentence starters in their science notebooks to guide them on what to include in their forecast (e.g., “The rule we created to test in the model is . . .” and “The front is estimated to be moving at a speed of . . .”). They can develop their own presentation or use a template provided in Keynote, Google, and PowerPoint (the template is also available to teachers when they create an account and sign in on the Concord Consortium’s Precipitating Change website; see Online Resources). Each team also writes a script before sharing their presentation with the class, which is assessed in the final evaluation.
Evaluate
The online curriculum includes multiple-choice and open-response questions for students. Questions in each lesson are specifically designed to highlight student learning gains in both disciplinary core ideas and computational thinking skills. Teachers are encouraged to provide feedback on individual student answers and are able to evaluate student progress throughout the Precipitating Change curriculum using a teacher dashboard. Exemplar student responses are provided in a teacher edition next to the questions, and a rubric to assess the final project is available (see Supplemental Materials).
Students can also keep track of their own progress by taking notes in a printable Precipitating Change Science Notebook (see Supplemental Materials). Finally, working in research teams provides opportunities for peer-to-peer feedback.
Classroom management
All curriculum resources are freely available on the Concord Consortium’s Precipitating Change website (see Online Resources). Teachers who are logged in with a free account can access step-by-step teacher guides that include learning objectives, material lists, how-to tutorials for creating the classroom grid and running the embedded phenomena dashboard for the virtual storm, discussion prompts, and exemplar student answers.
The Precipitating Change curriculum is online and accessible from any modern web browser on desktop computers and tablets. The virtual storm must be initiated by the teacher for the whole classroom, though students who are absent from class can access most assignments from home or during out-of-school time.
Conclusion
Using Mathematics and Computational Thinking is one of the eight science and engineering practices highlighted in the NGSS. Using a virtual storm as a highly engaging, participatory phenomenon and weather prediction as an important and relevant skill, the Precipitating Change curriculum offers students the chance to engage in computational thinking involving data and modeling and experience real-world science like a meteorologist. •
Acknowledgments
This material is based on work supported by the National Science Foundation under Grant No. DRL-1640088. Any opinions, findings, and conclusions or recommendations expressed in this material are those of the author(s) and do not necessarily reflect the views of the National Science Foundation.
Online Resources
Concord Consortium’s Precipitating Change—https://learn.concord.org/precipitating-change
Supplemental Materials
Joyce Massicotte (injoy5683@gmail.com) is an education and curriculum development consultant. Carolyn J. Staudt is a senior scientist and Cynthia McIntyre is the communications director, both at the Concord Consortium in Concord, Massachusetts.
Earth & Space Science Environmental Science Phenomena Technology Middle School