
feature
Cancer and Formaldehyde
A Culturally Responsive Science Unit
CONTENT AREA Life Science
GRADE LEVEL 8
BIG IDEA/UNIT Cancer and formaldehyde
ESSENTIAL PRE-EXISTING KNOWLEDGE Structure and function of a cell and cell division
TIME REQUIRED 4–5 days, 50–90-minute class periods
COST $50 to $150 for digital air quality monitor; other classroom supplies are minimal
SAFETY Gloves, goggles, and masks should be worn by the students while making and observing air quality simulators
As science teachers, we have a duty to our students to engage them in relevant learning that is connected to their lives outside of school and natural phenomena. This sentiment is supported by the literature on culturally responsive (CR) science teaching (Byrd 2016; Lanier and Glasson 2014; Wallace and Brand 2012; Xu, Coats, and Davidson 2012). To effectively meet the needs of our diverse students, teachers must develop a critical view of teaching situated within the sociocultural contexts of their students (Wallace and Brand 2012). Beyond this, we must also use class time to acknowledge and address issues of social inequities that are faced by our students and their families (Byrd 2016; Lanier and Glasson 2014).
Background for the teacher
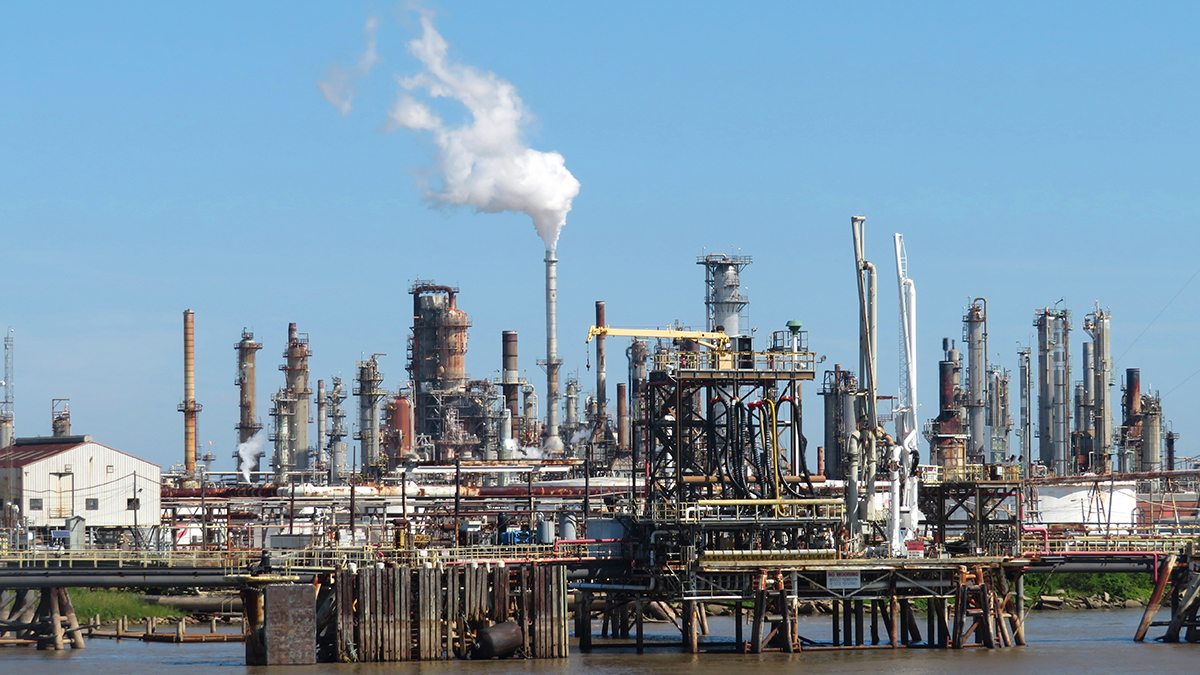
For this unit’s connection to our students’ community, we focus on Cancer Alley, which is located on the Mississippi River in Louisiana. Although our local school district is not located in Cancer Alley, many students within it have visited and/or have family from Louisiana and are familiar with the communities surrounding the Mississippi River. As its name suggests, the population experiences higher rates of cancer than both the United States as a whole and the entire state of Louisiana. The risk level of getting cancer in Cancer Alley is 30.3 per million higher than the national level and 37.1 per million higher than Louisiana’s (James, Jia, and Kedia 2012). This is due to the population of this region having a greater exposure to carcinogens, such as formaldehyde (James, Jia, and Kedia 2012). Currently, over 150 petrochemical factories are located in Cancer Alley (see UN News article in Online Resources). Emissions from these factories impact the community’s air quality and contribute to these higher-than-normal cancer rates.
To connect science standards to issues of social injustice, we also focus on Cancer Alley’s population makeup. The study by James, Jia, and Kedia (2012) found 62 “high risks tracks” and, of these, “35 of which are black dominant (75% black or greater), 17 are white dominant” (p. 4374). Meaning, Black communities are more likely to reside within high-risk areas.
This unit centers on the relationship between formaldehyde and race and ethnicity in Cancer Alley. For our student objective, we modified MS-LS1-4 from “construct an argument supported by empirical evidence” to create a social media post that is “supported by empirical evidence that changes to physical or biological components of an ecosystem affect populations.” Specifically, “. . . based on evidence for how environmental and genetic factors influence the growth of organisms” (MS-LS1-5).
MS-LS2-4 and MS-LS1-5
Day 1—Air quality monitor, simulator, and “What I Wonder”
To begin, we place our students into pairs to create air quality simulators by taping a section of graphing paper to construction paper and covering the front with petroleum jelly. The reason we are calling these air quality simulators is that we want to emphasize to students the differences in the scale of the dirt and debris that they would collect compared with the submicroscopic scale of carcinogenic molecules such as formaldehyde. Student pairs then place their air quality simulators anywhere in or near the classroom. As students construct and place their air quality simulators, we ask: Why do you think we are placing petroleum jelly on our notecard? What do you expect to see on your notecard over the next few days? Is there an area that is especially dusty in our classroom? Where do you think this dust comes from? What is in “dust”? Will we be able to see individual molecules? Why or why not?
To better visualize the difference between particles we can see in relation to molecules we cannot see, we display a simulator on the smartboard and guide the students through a discussion as we zoom in and out (see Simulator in Online Resources).
Then, we will introduce our students to a digital air quality monitor, which can be purchased online for approximately $50 to $150. Just be sure that it detects formaldehyde. Before showing the digital reading on the device, we discuss what molecules the device detects, specifically formaldehyde, and where it is typically found. After our discussion, we display “Facts About Formaldehyde” (see Online Resources) and prompt student volunteers to read sections out loud. Based on the article, we ask students to brainstorm where they think the most formaldehyde would be detected near the school, guiding them to areas such as the bus stop. Formaldehyde is released during combustion; therefore, it is a component of automobile emissions. It is is also directly linked to the research in Cancer Alley. As noted by James, Jia, and Kedia (2012), “formaldehyde and benzene were the two largest contributors to the disparities” in Cancer Alley (p. 4365).
Because buses are only present at the beginning and end of the day, we explain to students that we will collect data before and after school while buses are present and share the data with the entire class. We also have students collect data in areas they recommend in order to compare that data with the “bus stop” data. At the end of our discussion, we require students to contribute at least one question to our online “What I Wonder” chart. We then have our students communicate their “What I Wonder” using the free online resource, Padlet (see Online Resources). This permits students to see each other’s questions and ideas while allowing the teacher to track how much each student contributes. Padlet can also be easily linked to Google Slides. We use a Google Slide presentation that contains the link to Padlet, data collection tables, online resources, the social media post example, and the rubric. Students are instructed to make a copy of the Google slide presentation “Cancer and Formaldehyde” (see link in Online Resources) into their Google Drive to work from. They are asked to share their copy with the classroom teachers so we may monitor their progress. They can access the Padlet and Google Slide presentations from their Chromebooks. For classes without one-to-one technology for students, a large sheet of paper and sticky notes could be substituted for the Padlet. Data collection could also be done using a notebook. The online resources, the social media post, and the rubric could either be displayed on the board or combined to make a student handout.
Day 2—Observations, physician interview, and Cancer Alley
Prior to the start of the second day, we use the digital air quality monitor that we purchased to record the presence of formaldehyde near the bus stop and other areas our students recommend. This data is recorded so we can share it with our students on the board in class.
We begin our second day with students working in their previously assigned pairs to make observations of their air quality simulator. Each pair is provided with a hand lens and, as an entire class, students review the difference between quantitative and qualitative data. Although students work in pairs, each student uses their Google Chromebook to record their qualitative and quantitative data on their copy of the Google Slide presentation. If students will not be using a digital platform, data may also be collected within a notebook.
After students record data from their air quality simulator, we then share the data collected from the digital air quality monitor. Based on the data, we ask students questions such as: Are the results what you expected them to be? Why or why not? Do you think waiting at the bus stop may have an impact on your health? Why or why not based on this data? What about the other areas we tested? How do they differ from the bus stop?
Eighth-grade students should be familiar with cells and cell division from their previous science classes. If not, we recommend adding an additional video and/or article to review the information before connecting students with a local expert. The article we recommend reading as a class is titled “What is a cell?” and the video we recommend is titled “The Cell Cycle (and cancer)!” Links for both the article and video can be found under Online Resources.
For our local expert, the first author reached out to a friend of a friend who is a physician. Because our local physician may be unable to visit all classes in person, we recorded our Zoom interview to then play for the class. To connect your own classroom to your unique community, we recommend connecting with a local expert within the related sciences to either visit your class or participate in a recorded interview as well. If you are not personally connected with a person in the medical field, check with your colleagues or your school nurse. During our recording, the classroom teacher asks the physician to explain the difference between visible particulate matter and nonvisible components within the air. We also ask the expert to describe how living organisms, including humans, are comprised of cells. Our expert explains that most of our cells are continually being replaced through a process called mitosis. If, during this process, the cell is exposed to known carcinogens, the cells may mutate into cancerous cells. Some of the questions we asked our physician were: How does the environment impact human health? What are some examples of illnesses or diseases humans may experience due to air pollution? Are some people more susceptible to air pollution, and if so, why? What can we do to protect ourselves from air pollution?
After watching and discussing the recorded interview, we introduce our students to Cancer Alley using the UN News article “Environmental racism in Louisiana’s ‘Cancer Alley’, must end, say UN human rights experts” (see UN News article in Online Resources). We ask student volunteers to take turns reading the article out loud. As we read, we stop to discuss any terms students are unfamiliar with, such as petrochemical plants, environmental racism, and parish.
Students may not have heard of Cancer Alley, and this may prompt questions about why so many commercial petrochemical plants are in one area. We then guide our students in a discussion regarding the water transportation made possible by the Mississippi River and the job opportunities the companies presented to the population. We ask: Why do you think people continue to live here despite the potential health risks? What would you do in this situation? Do you think it would be easy to leave your current community? Why or why not?
To push them in the direction of social justice and activism, we next move on to a discussion of activist Margie Eugene-Richard. The first African American Goldman Environmental Prize recipient, Eugene-Richard won in 2004 for her advocacy work in Cancer Alley (Goldman Environmental Prize, 2004). We explain that like Ms. Eugene-Richard, our overall goal for this week is to create more awareness about student-selected topics around formaldehyde, cancer, and how Black and Brown communities are disproportionately impacted. We ask: Do you think our communities of Black and Brown students have more exposure to formaldehyde in our community as well? Why or why not? At the conclusion of our discussion, students are asked to add to our Padlet, “What I Wonder.” If this activity is being done without Chromebooks, instruct students to add their thoughts to an additional sticky note and place it on the original large piece of paper. We also ask them to discuss cancer, formaldehyde, and activism with their families that evening.
Day 3—Social justice and activism
Just as the previous day, the class begins with observations and data collection of the air quality simulators. For students who are visually impaired, you may describe what the air quality simulator looks like by listing what is visible in each square while moving from top to bottom, left to right. This may be done by the teacher, an aide, or another student. Once all data has been recorded, students share any additional thoughts they may have based on their discussions with their families. We then show the video “Margie Richard: 2004 Goldman Prize Winner, USA” (see link in Online Resources). The purpose of this video is to demonstrate the impact local activists have on their communities. After the video, we prompted a whole-class discussion by asking: “Do you know of any activists? What impact did this activist have on their community? Is there something you would like to change about our community? Have you considered being an activist? After our discussion on their additional ideas and the video, students are invited to record them and add them to the “What I Wonder” Padlet. For classrooms without Chromebooks and/or the internet, this could be done with additional sticky notes on the large piece of paper in the classroom.
Before beginning our project, students are directed to view the post by the United Nations (see Figure 1) and the assessment rubric (see Table 1). While referencing the image and the rubric, we ask students to use the grading rubric to assess the post by the UN. That way, the students could see how the rubric would be used to assess their social media posts. After discussing our evaluations and the requirements, we direct students to select one idea or question from Padlet’s “What I Wonder” that they were most interested in exploring. If working from the sticky notes on a large piece of paper, we recommend that the teacher display the questions on the board for the students to select from so they do not need to remove sticky notes as they work. Students are permitted to work with one other student if they wish to do so.
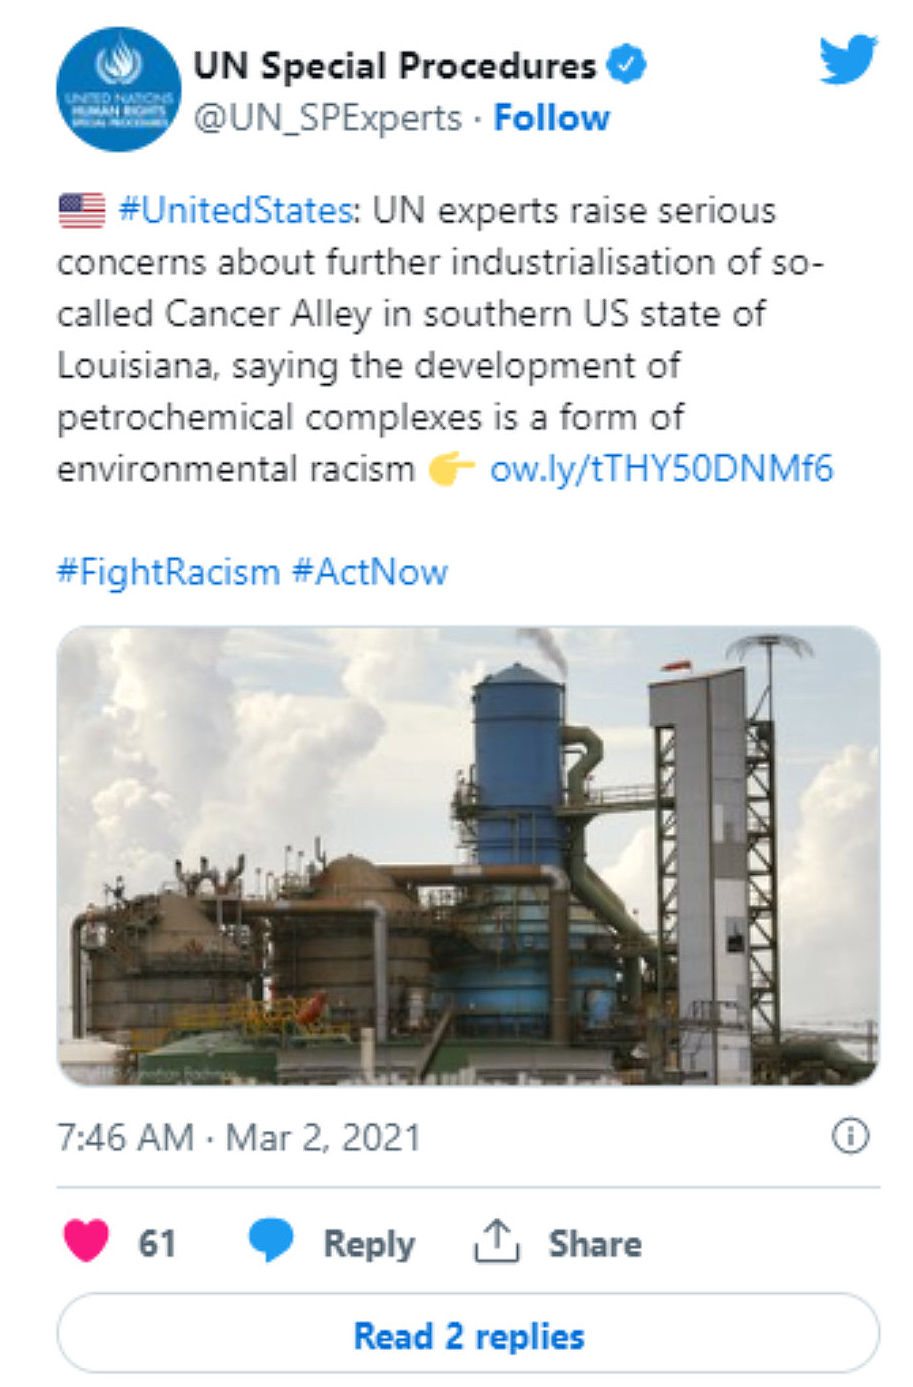
Example social media post (source: https://bit.ly/3ZIltAl).
| Table 1. Social media post rubric. | ||||||||||||||
|---|---|---|---|---|---|---|---|---|---|---|---|---|---|---|
|
Days 4 and 5—Research, activist post, and presentations
Days 4 and 5 begin with air quality simulators observations and data recording. Students are then permitted to use the entire fourth day to create a social media post to communicate their responses to their question. Like authentic social media posts, students will need to include images, emojis, links, and hashtags. Once students’ posts are complete, they evaluate their post with the rubric (see Table 1) and can make any additional changes. For the final day, each student or student pair stands at the front of the class to discuss their post. All students’ posts are displayed in one Google Slide presentation so students can view each other’s work and share it with their families. If Google Slide is not available, we recommend that student work be posted on large pieces of construction paper using old magazines for images. The hardcopy posts should be displayed around the classroom and school building to raise awareness (see example of student work in Figure 2).
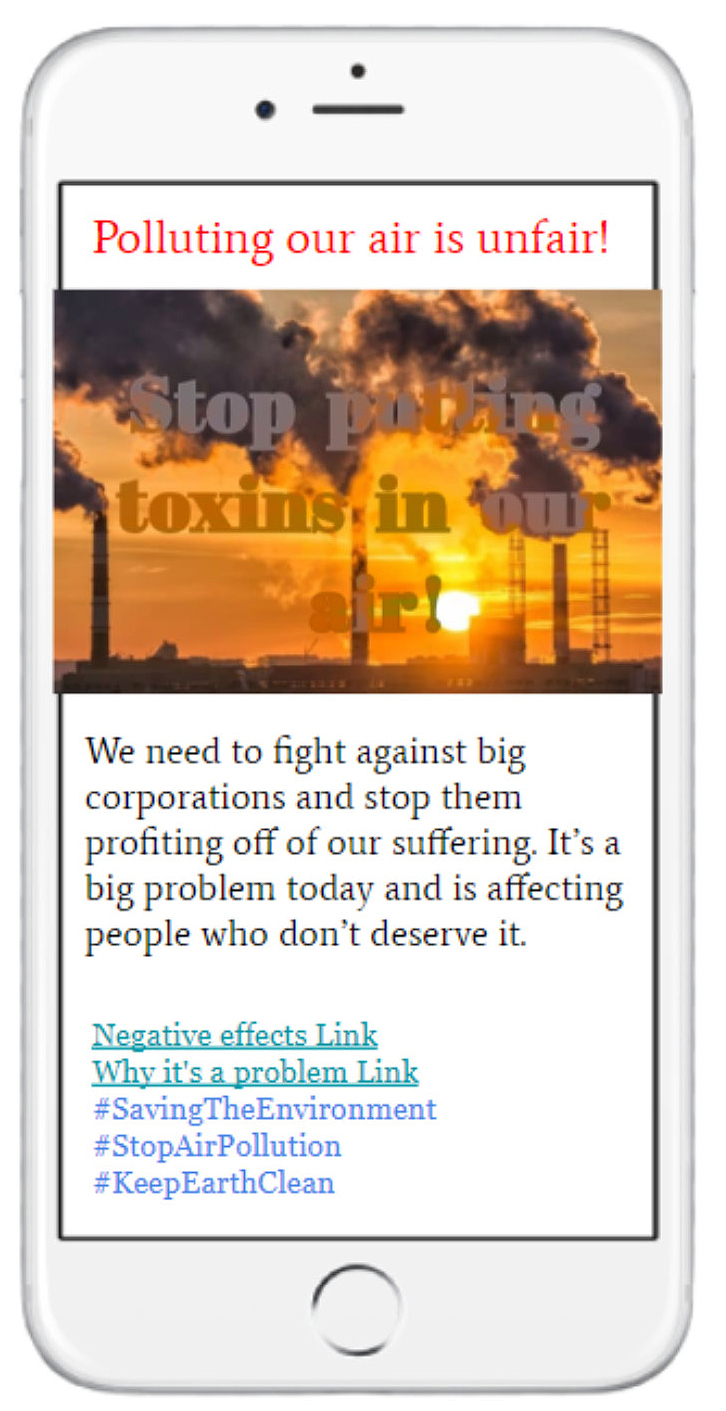
Example of a student-created social media post.
Conclusion
As science teachers, we have a duty to appeal to all our students, keeping their ethnic/racial backgrounds in mind. By acknowledging differences, valuing students’ perspectives, and connecting these to the content, science becomes personal and more exciting for all students. We must also acknowledge students’ experiences outside of the classroom, explicitly bridging the science content with their lives outside of school. The lesson presented in this article is just one example. We challenge you to implement this, or other CR science lessons, into your classroom and to see for yourself the impact it will have on your middle school students.
ONLINE RESOURCES
Air pollution: Everything you need to know—https://on.nrdc.org/3JBjTuf
Air quality by zip code—https://www.airnow.gov/
“Cancer and Formaldehyde” Google slide presentation—https://bit.ly/40DaM27
Environmental justice—https://bit.ly/3mMrsWe
Facts about formaldehyde—https://bit.ly/3l2hDD6
Padlet—https://padlet.com/
Simulator—https://learn.genetics.utah.edu/content/cells/scale/
UN News article “Environmental racism in Louisiana’s ‘Cancer Alley’ must end”—https://bit.ly/3ZIltAl
Video: “Margie Richard: 2004 Goldman Prize Winner, USA”—https://bit.ly/3TdYVER
Video: “The Cell Cycle (and cancer)!”—https://bit.ly/2HBQtOs
“What is a cell?”—https://bit.ly/2opXVzy
“Why indoor air quality is important to schools”—https://bit.ly/3Jd6Bmu
Lundon A. Pinneo (lapinneo@ualr.edu) is an assistant professor in the School of Education at the University of Arkansas at Little Rock. Stephen R. Burgin is an associate professor in the Department of Curriculum & Instruction at the University of Arkansas in Fayetteville.
Equity Life Science Phenomena Middle School