
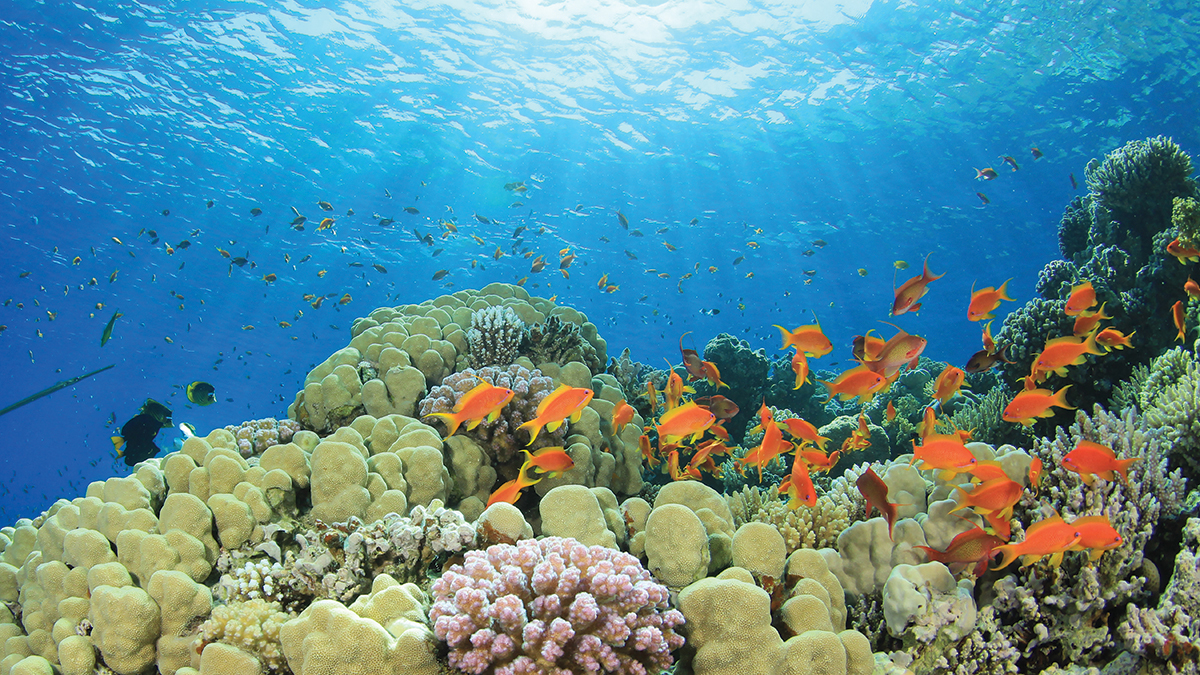
Feature
How Many Fish are Really in the Sea?
Estimating reef fish abundance using trawl and underwater video data
Fisheries scientists make sure that fish populations (fisheries) are managed properly, neither over- or under-utilized, to maintain long-term economic and ecological stability. Scientists collect data and conduct surveys to determine fish populations, and then make recommendations about how many fish may be caught by commercial and recreational fishermen. In this lab, students tackle this type of applied science by becoming fisheries scientists who must collect, analyze, and interpret fish population data. They then make informed conclusions about the populations they have surveyed and analyzed to provide information needed for managers to make decisions about how to keep these populations healthy.
Over the last 30 years, the equipment used in fisheries assessments has evolved. Historically, extractive measures, such as traps, hook and line, and trawls were the most common. These methods can unfortunately result in lethal catches of non-target species (by-catch) and habitat damage (Chuenpagdee et al. 2003). Though these sampling methods do possess some unique advantages over non-extractive techniques (e.g., exact fish lengths, sex determination, disease presence, tissue samples), visual-based approaches are increasingly used to supplement fish population assessments.
Visual methods range from using scuba diving in shallow waters to relying on advanced technology that can reach deeper areas, survey longer, and collect data more frequently (Murphy and Jenkins 2010). Though there are many ways in which data can be collected for fisheries assessments, this activity will only focus on two: trawling and a towed video camera system called C-BASS (Figure 1; Lembke et al. 2017).
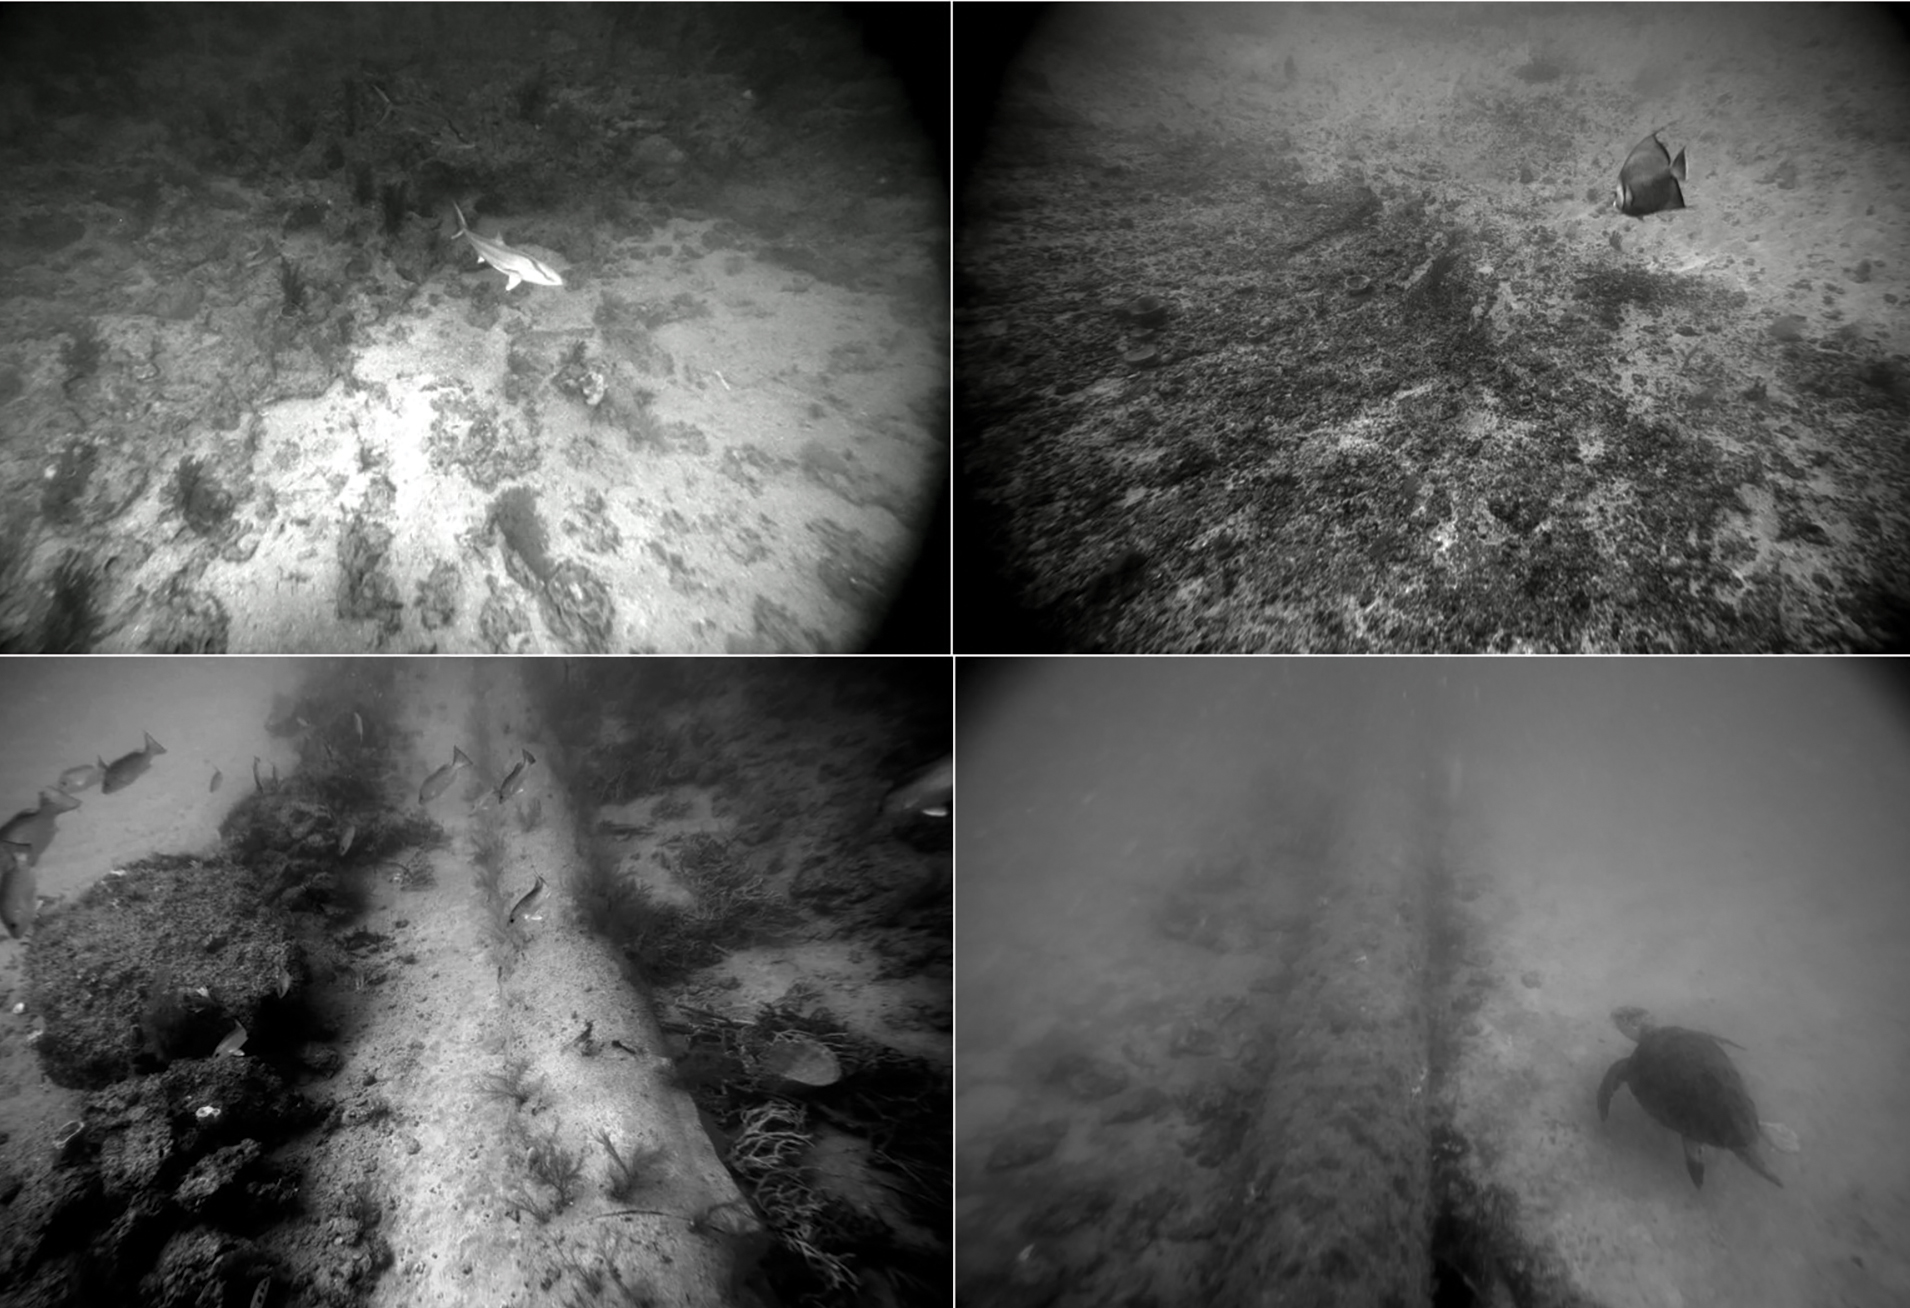
Examples of imagery from the towed camera system, C-BASS. Developed by scientists and engineers at the University of South Florida’s College of Marine Science, this instrument is used to survey reef fish, sea turtle, and habitats in the eastern Gulf of Mexico in water depths of 20 to 200 m (60 to 600 ft.).
Students begin the lab by assessing reef fish populations in the offshore (20 to 200 m depth) region of the eastern Gulf of Mexico using data from a towed camera system, then work their way through analysis and interpretation by relying heavily on using a geographic information systems (GIS) program. They then use data from a trawl survey to make comparisons with the camera-based results. Completion of this lab will expose students to some of the practical skills necessary to complete scientific fieldwork, analyze data, and present findings.
This activity relies heavily on active learning to ensure that students better understand the lab’s concepts (Taraban et al. 2007). This work also facilitates critical thinking and higher-level problem solving (Gillies 2008), both of which are required to successfully complete the lab and subsequent assessment tasks. This activity can be used with grade levels 9–12 but is more suitable for 11th and 12th graders who may have more experience with GIS, spreadsheet work, and independent learning.
This activity is computer-intensive, so it works best when students work in pairs or small groups of no more than three to ensure everyone can contribute and stay involved. The estimated amount of time needed for this project is approximately four hours. There are natural break points to extend the lab over multiple days. The two-part assessment portion can be completed as homework or done in-class with another 1.5 hours of time. A concise overview of the concepts taught in this activity can be found in Figure 2.
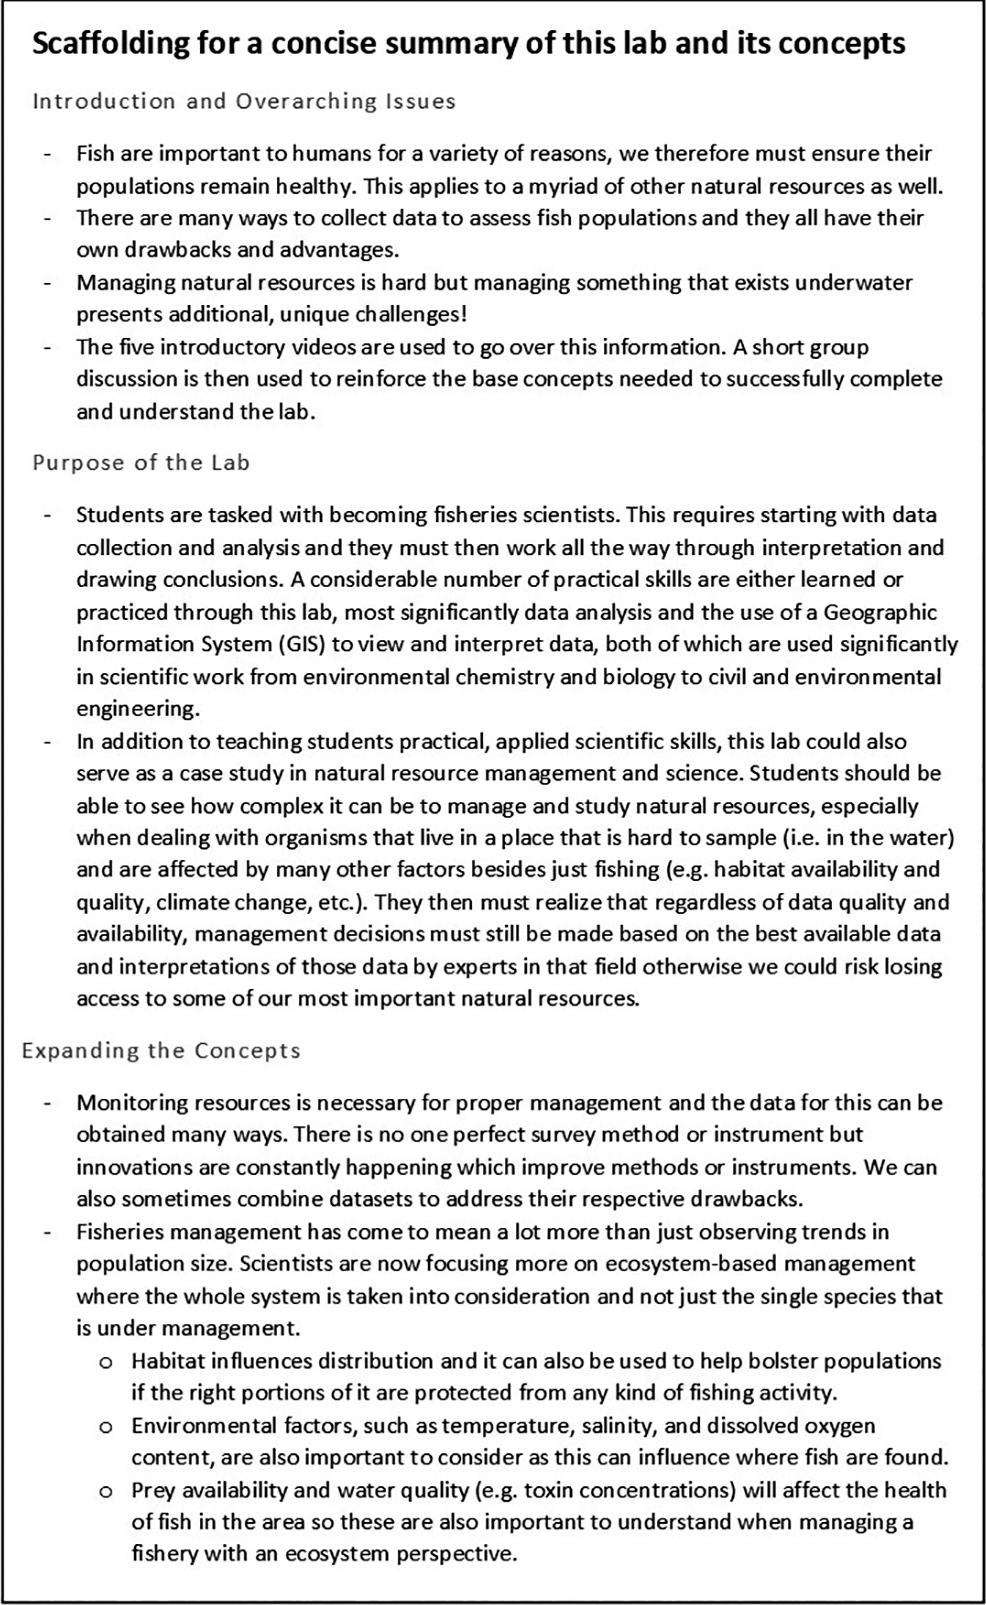
Scaffolding for a concise summary of this lab and its concepts.
Background Information Video Series and Discussion (25–30 min)
To kick off the lab, show the class a series of YouTube videos and discuss as a group to make sure that all students understand the background information needed to execute the lab. All videos are linked on the Resources page of the lab website and are in the correct viewing order.
Fisheries management is an all-encompassing term and can mean a lot of different things depending on what the management needs are for a certain fishery. The first video in the series, Fisheries Economics & Policy: Intro to Fisheries Management (4 m 44 sec), provides students with information about what fisheries management is and why it is important.
The next video, The ABCs of Stock Assessments (4 m 13 sec), gives context on stock assessment science using a fishery in the Pacific Northwest. In this lab, the students focus on two stock assessment data collection approaches: trawl and camera-based data. The video Fisheries Independent Monitoring: Reef Fish Video Survey shows how scientists from the Florida Fish and Wildlife Research Institute collect camera-based data for fisheries assessments (2 m 11 sec).
The students will be working with video data from a system similar to that depicted in the video, but instead of stationary video they “use” a towed (mobile) video system. Further context on this type of instrument is provided in the next video, C-SCAMP Overview (4 m 42 sec). Finally, a video from Seafood Watch titled How Seafood Is Caught: Bottom Trawling (52 sec) shows students what a trawl is and how it catches fish.
After viewing the introductory videos, students should have a good understanding of what fisheries management is and how the data used by managers are collected. To check for comprehension, five to ten minutes are used for a short group discussion led by the teacher, and students fill in the flow chart (Figure 3) with information learned from the four videos.
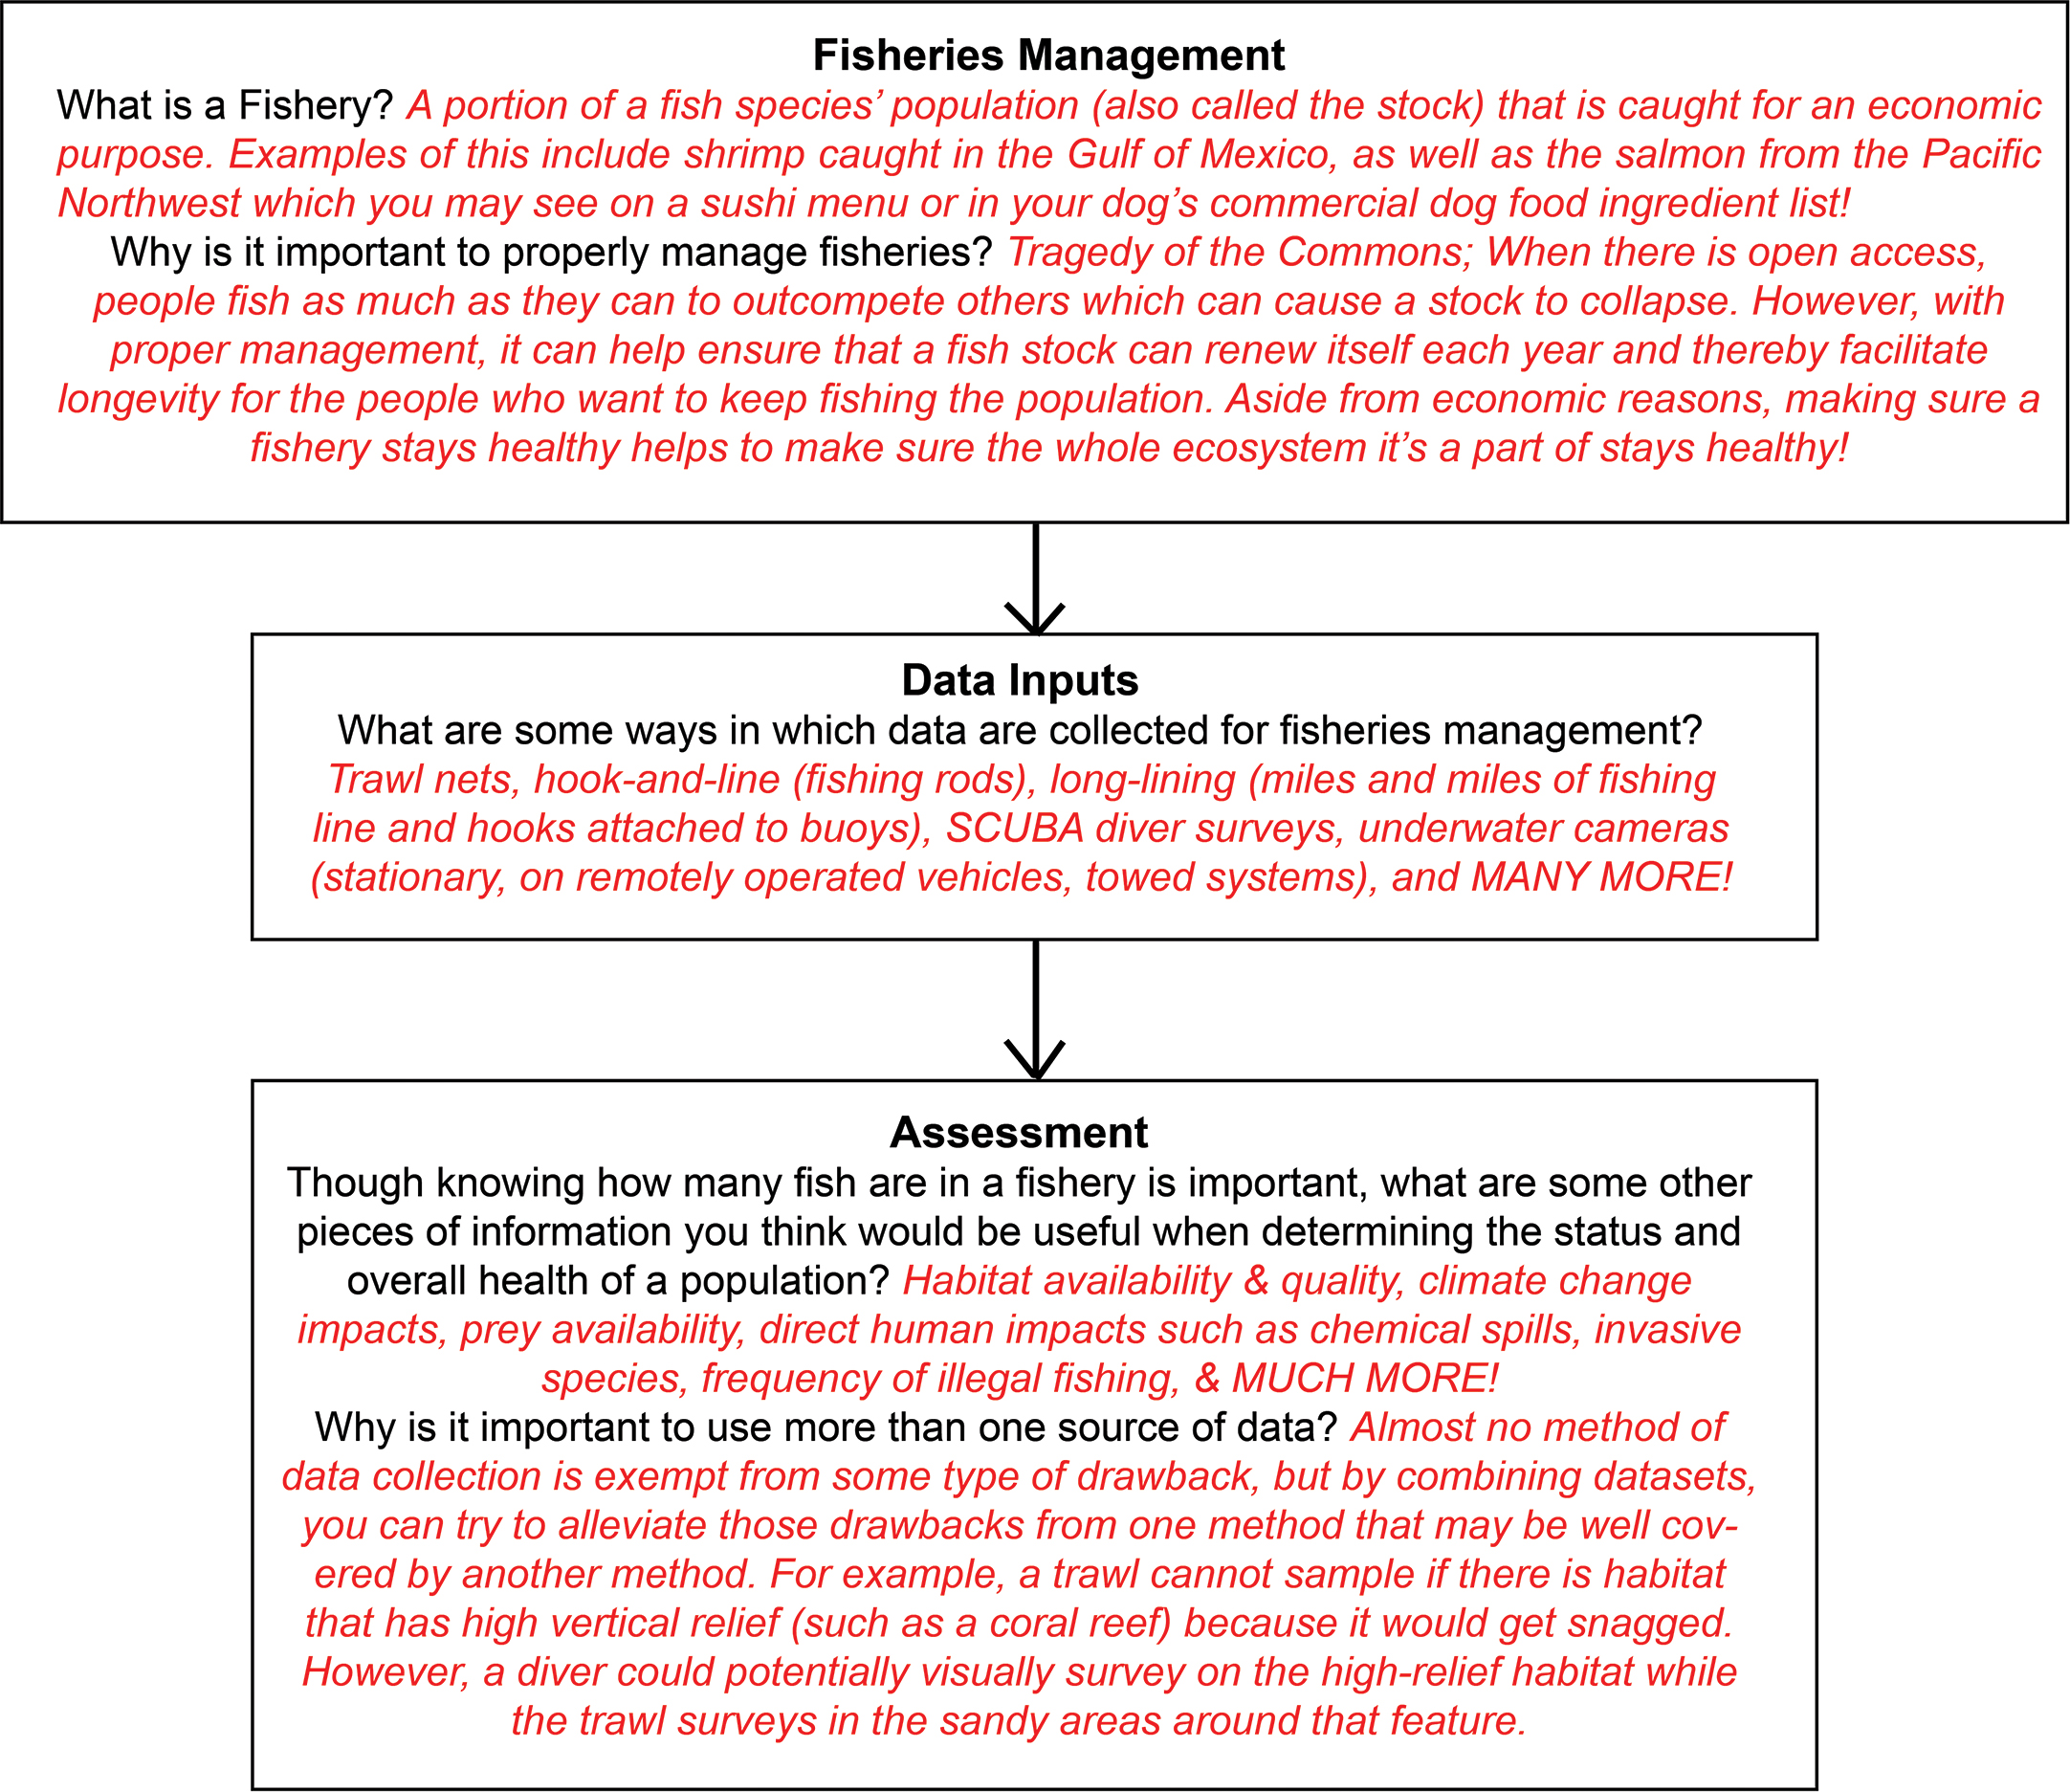
Flow chart to facilitate a short group discussion on fisheries management. The black text in each box are the prompts for the students while the red, italicized information is a guide for the teacher or facilitator of the lab to make sure that the brainstorm session reinforces the key concepts needed for the lab.
Once this is completed, students are ready to perform the lab. Each group should be provided copies of the Lab Guide handout, which describes the scenario they will follow, as well as how to choose the location they want to sample.
Materials
- Projector or TV connected to a computer with internet to show the introduction videos.
- Computers or Laptops with 64-bit processing, ≥ 8GB of RAM, internet, and ≥25 GB of storage space for each group; QGIS, SMPlayer (Windows Media or Quicktime would be sufficient but they have less functionality and control), and Microsoft Excel. Ensure that access to these computers is available for the duration of the activity.
- Zip file of lab data files. This contains all necessary GIS files, video data sets, and video analysis data sheet. All materials are located at https://sites.google.com/view/howmanyfish (Be sure that access to this website from your school’s network is allowed.)
- Printed copies of the Lab Guide for each student.
Lab Activity
Part 1: Planning the Towed Video Camera Survey (20–30 min)
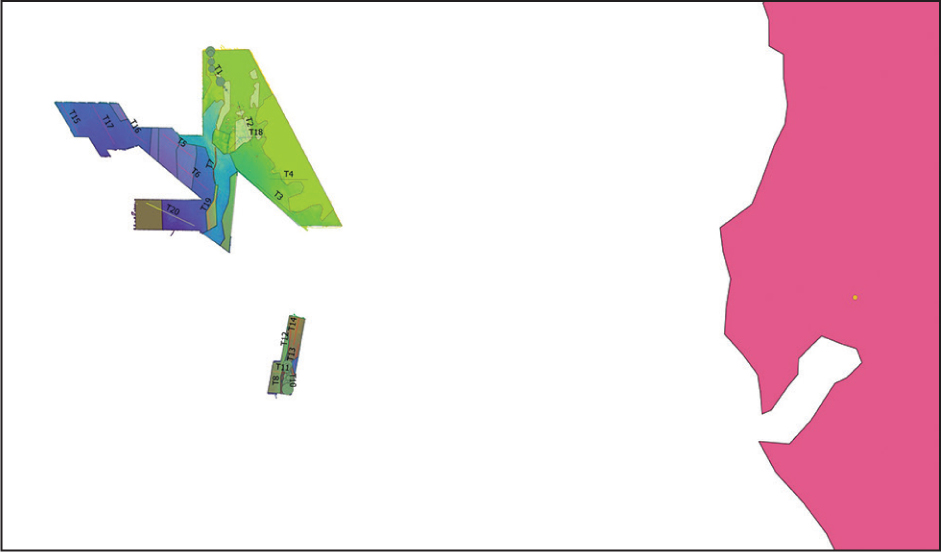
The first step in planning a towed camera survey is to determine where to deploy the system. This often requires a cost-benefit analysis between the high cost of research vessel time and how far away the places of interest are located. Researchers often plan fieldwork using a GIS program to view information about very specific locations.
Part 2: Video Data Analysis (1–1.5 hours)
The subsets of video that each group will analyze depend on the transects they choose. For example, if a group chooses transects 5, 8, 10, and 11, they would select those folders from the Master folder (“Video Data Sets”), then copy and paste them into the “Selected” folder (Lab Files\Video Datasets\Selected Transects) then work out of that directory.
In the video analysis spreadsheet, students completely fill out each row. Some of these inputs are important metadata about each video, such as transect number, the video number, and georeferencing ID. This information is necessary to relate the data back to the GIS map and see what areas had which fish.
Though just the counts of fish can tell researchers some information about the populations being surveyed, it is much more useful when the data are standardized so that they can be compared with other data sets, in this case with trawl data. This means that both data sets will have numbers that are directly comparable, regardless of the equipment used for collection. Students will convert their counts into densities, or number of fish observed per unit area.
Part 3: Analyzing Catch Data from a Trawl Survey (20–30 min)
Students then do some analysis on the trawl data before they can make comparisons to the trends observed using the towed camera data set. To do this, they will need to carry out a very similar process to what they did for the video analysis by converting fish counts from the trawls to densities.
Part 4: Wrap-Up and Comparing the Data Sets (30–45 min)
Once the students finish the fish counts for their selected transects, the next step is to link those counts to where the video was recorded using the QGIS map for both the video-based and trawl-based data sets (Figure 4). This is known as georeferencing. This portion of the lab is somewhat complicated so students may need assistance, but if the Lab Guide is followed step-by-step, they will be able to display their data on the map and interpret how different habitats support varying numbers and species of fish. This allows students to visually interpret their findings; any patterns in the data should be easily observable, and the students will be able to determine if the densities estimated from trawl and video data are comparable or appear to be telling different “stories.”
Example of what the map will look like in QGIS as the students complete the lab.
Assessment
When most scientific fieldwork ends, scientists must write a report. An example of such a report is linked on the Resources page (Example of C-BASS Cruise Report—see Lab Materials and Resources “On the Web”). As part of the assessment for this lesson, groups will perform a similar write-up summarizing the background introduced at the beginning of the lab, what they did, how they made their planning decisions, and their findings. This can be done as homework or additional in-class work, and each group needs to submit only one report.
To engage more critical thinking, each student then submits short-essay responses to the Wrap-Up Questions (see “On the Web”). These questions are designed to make students draw conclusions based on their data, versus just simply presenting the data from the report, just as a scientist would have to do when making recommendations to fisheries managers. Answers to these questions may vary widely and as such, the answers provided on the sample are meant only to check that students have grasped the main point of the question. The report and responses to the wrap-up questions can be evaluated using the rubrics in Tables 1 and 2 (see “On the Web”).
| Sample rubric for a group report where students are expected to produce a professional summary of their findings. | ||||||||||||||||
|---|---|---|---|---|---|---|---|---|---|---|---|---|---|---|---|---|
|
||||||||||||||||
Teacher feedback
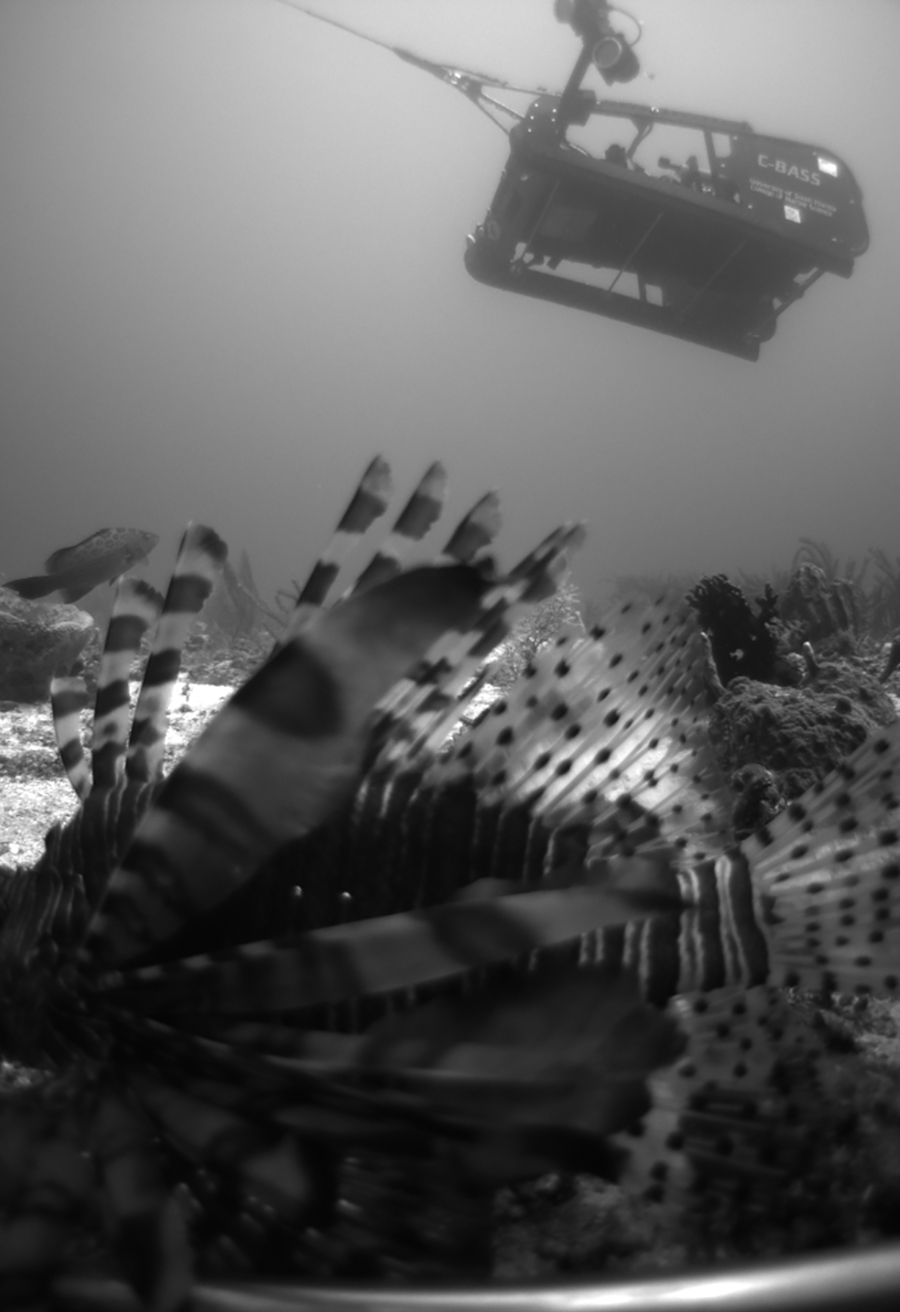
C-BASS underwater camera
Conclusion
This lab takes students through a simplified process of how fisheries scientists must integrate data from multiple sources to determine the status of fished populations. The tasks encourage critical thinking and problem solving while also teaching students basic geographic information system (GIS) skills. At the end of the activity, students use the data they collected and analyzed to observe fish trends over different habitat types, and they must draw conclusions about what the data are telling them so that they may make recommendations to fisheries managers. By the end of the activity, students should:
- Have a basic understanding of fisheries management and why it’s important.
- Possess basic GIS skills and an understanding of why it’s an important tool in science.
- Be able to explain the decision-making process for the conclusions they make.
Acknowledgments
The author would like to thank the National Fish and Wildlife Foundation (GEBF Grant #45892) for funding the collection of the data used to supplement this lab, as well as the Principal Investigator and lead of the project, Dr. Steven Murawski.
Sarah Grasty (grastys@usf.edu) is a senior biological scientist at University of South Florida – College of Marine Science in St. Petersburg, Florida.
Fisheries Economics & Policy: Intro to Fisheries Management
The ABC’s of Stock Assessments
Fisheries Independent Monitoring
How Seafood Is Caught: Bottom Trawling
Biology Environmental Science Instructional Materials Teaching Strategies High School