
feature
Media Literacy in the Age of COVID and Climate Change
The Science Teacher—July/August 2021 (Volume 88, Issue 6)
By Jocelyn Miller, Linda Rost, Connor Bryant, Robyn Embry, Shazia Iqbal, Claire Lannoye-Hall, and Missie Olson

In March of 2020, the world of education was upended. Teachers and students across the globe abruptly left their classrooms. Once taught in abstraction, science concepts became national headlines, no longer relegated to textbooks. Misinformation began spreading faster than any virus, and for many science teachers, addressing scientific untruths became the primary focus of their profession. Telling students a source is not credible, or reviewing the Nature of Science is only a temporary fix—we must recognize the urgency of providing students the ability to make scientifically informed decisions by addressing data and media literacy.
Battling half-truths and conspiracy theories is not new to science education—as any climate science teacher can confirm—but the pandemic is unique to this generation. For the first time, a global crisis affects every student worldwide simultaneously, and its impacts are immediate. The slurry of misinformation students and communities believe, share, and politicize has prompted a team of seven teachers from six states—Georgia, Indiana, Michigan, Minnesota, Montana, and Texas—to develop a unit addressing media literacy.
It was essential to design the unit so that it could be taught virtually, blended, hybrid, or in-person, and could be applicable both to the pandemic and to other ongoing misinformation crises like climate change. For the sake of simplicity, we will describe the unit in two parts, Media Literacy and Scientific Literacy. Linda Rost, our facilitator in Baker, Montana, conducted the unit primarily in-person, with some students participating virtually.
Part I: Media literacy
People often lament the loss of validity among media sources with the onset of 24-hour news programming. While that may be the case for previous generations, today’s students face a constant deluge of algorithmically curated information systematically validated by clicks and shares. To ensure media relevancy, Rost obtained all media sources for this unit in a digital format.
The unit opens with an abridged version of “The Unraveling of America,” a political commentary by anthropologist Wade Davis featured in Rolling Stone (see Online Connections). Students reflect on ways the pandemic has affected them personally, and then expand their scope and describe the impact of epidemic on society at large. To scaffold student responses, Rost provided a table (see Table 1). Students submit responses anonymously in a Google Doc, allowing them to share their thoughts free from judgment while providing Rost with an awareness of misconceptions they may possess. Anonymous sharing is a useful way for teachers and students to communicate about topics that could be politically charged or uncomfortable to discuss in an open forum.
Rost found that many of the 10th-grade students had difficulty understanding the nature of COVID-19 and the extreme measures needed to reduce the spread of infection. However, most 11th- and 12th-grade students appeared to have a deeper understanding of the disease characteristics and expressed concern that too few measures had been enacted and enforced. Both groups struggled to understand how COVID may have affected society, but were able to explore those concepts more deeply after additional facilitation from Rost.
Correlation vs. causation
After the initial class discussion and anonymous responses, Rost recognized that many misconceptions students held were due to misinterpreted and biased data obtained from various media sources. This realization prompted her to provide a lesson focused explicitly on determining the difference between correlation and causation. Beyond merely defining the terms, Rost discussed lurking variables that, while unseen and unmeasured, could be the reason for the relationship between the measured variables. For example, an outside observer may see a group of people standing in the rain holding umbrellas and conclude that holding an umbrella will make it rain. However, we know the lurking variable in this scenario is atmospheric conditions.
The umbrella scenario is easy for students to understand, and it prepared them to understand complex relationships in the case of COVID-19. For example, according to one study, states with restaurant closures had a reduction in COVID-19 cases. From that information, one could conclude restaurants were causing outbreaks when, in fact, it was the act of people congregating indoors that increased the spread of the virus. Rost then provided students with a list of words shown in Table 2 to identify whether the author is describing a correlative or a causal relationship. Students practiced identifying the terms in headlines of articles and classified them as correlation or causation.
Evaluating Scientific Studies Packaged for Public Consumption
Most people consume media from sources that describe scientific studies, but they rarely access the primary source itself. Studies published in reputable journals include pertinent information to address the validity of findings, while also recognizing a study’s limitations. On the other hand, media sources tend to gloss over research details and present more conclusive assumptions than intended by the researchers. High school students may find it challenging to recognize these differences.
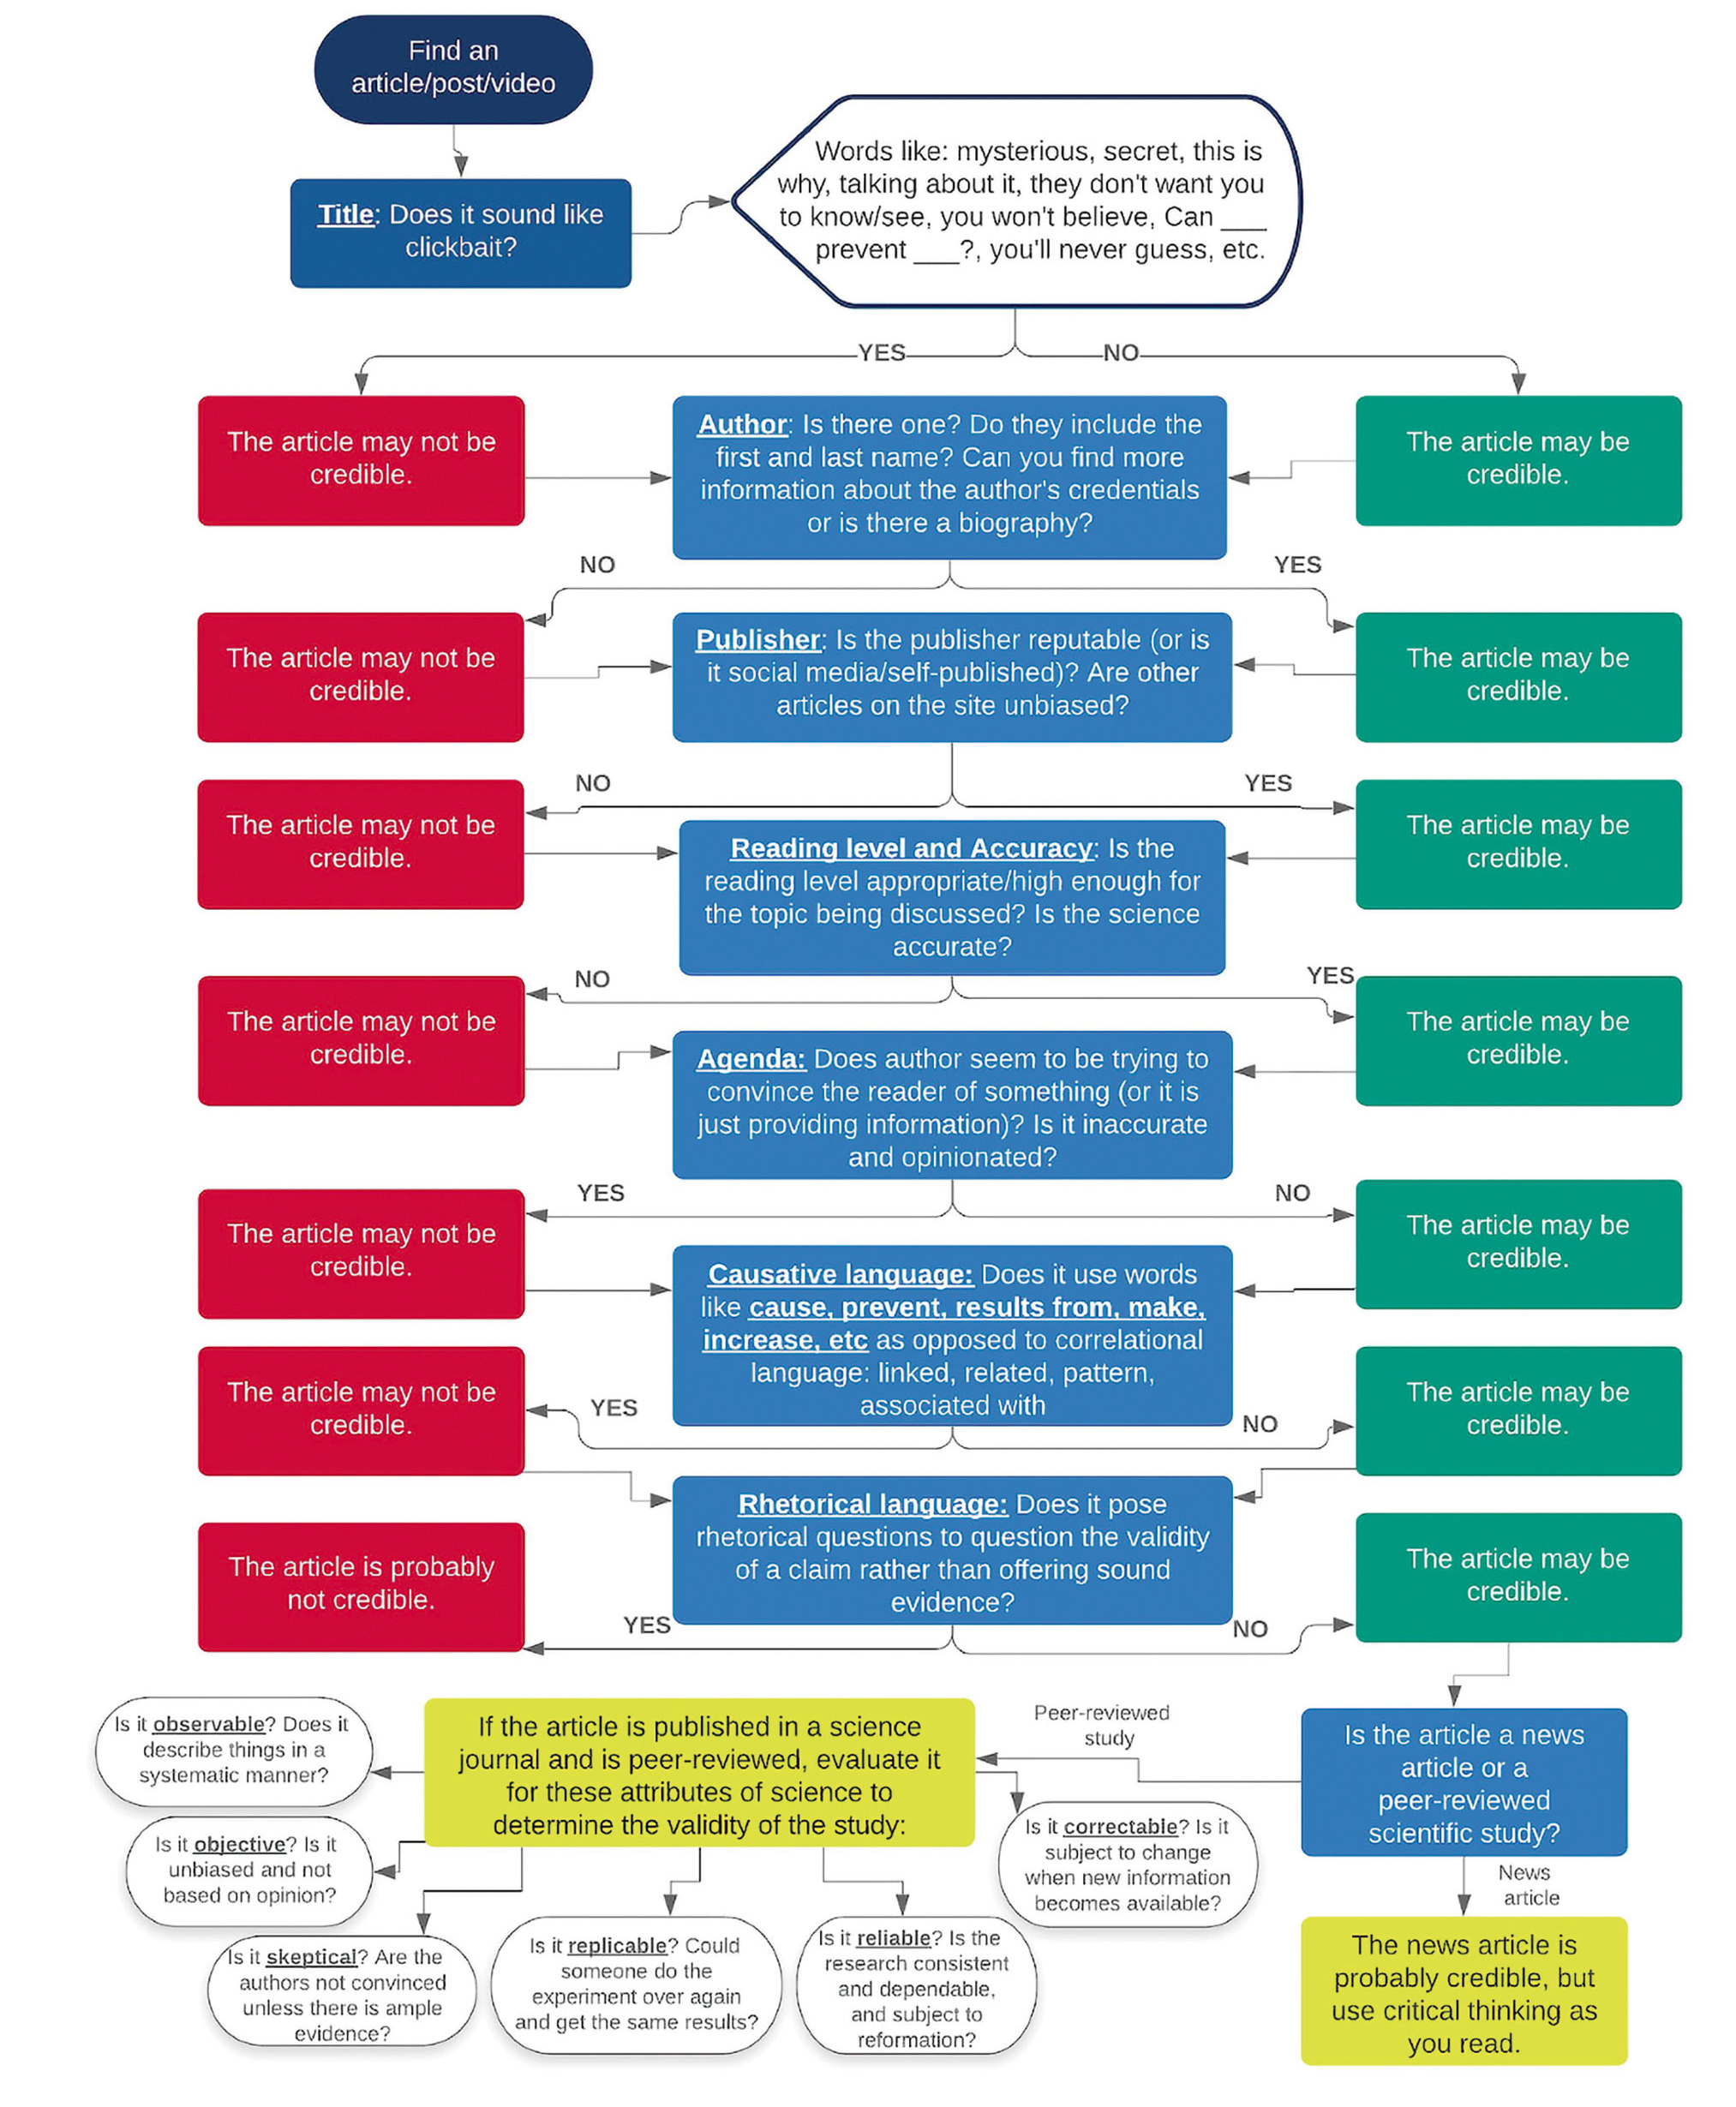
To combat the confusion, Rost developed the Article Validity Flowchart shown in Figure 1. It provides a structured analytical approach to evaluating media. Students navigate through the chart to address a series of yes or no questions, ranging from identifying clickbait terminology to recognizing biased and rhetorical language. The top portion of the flowchart is designed for assessing media sources written for a general audience. The lower part provides a specific set of questions relating to the experimental design and validity of a scientific study. Novice students are encouraged to begin their evaluative process at the top of the flowchart, regardless of the type of media they are assessing.
| Table 1A. Reflections on “The Unraveling of America” How has the pandemic affected you personally/as a society? How have the changes due to the pandemic affected you/society? | ||||||||||||||||||
|---|---|---|---|---|---|---|---|---|---|---|---|---|---|---|---|---|---|---|
|
| Table 1B. Reflections on “2020: A Critical Year for our Future and the Climate” How has climate change affected you personally? How has climate change affected society? | ||||||||||||||||||
|---|---|---|---|---|---|---|---|---|---|---|---|---|---|---|---|---|---|---|
|
Rost then provides students with sets of media articles paired with a corresponding scientific study. The articles cover many scientific concerns related to COVID-19, including air circulation in classrooms, transmission in children, viral shedding and mask-wearing, and children as COVID-19 spreaders (Table 3; see Online Connections). For learners requiring additional support, Rost provides abbreviated versions of the research articles and one-on-one assistance as students encounter difficult or unfamiliar terminology.
Students use the Article Validity Flowchart and Table 4 provided in Google Slides to scaffold their evaluative responses. Students discovered that media articles make claims unsupported by evidence and use unwarranted causation language. The peer-reviewed studies are longer and contain more complex vocabulary, but do not make unsubstantiated claims without evidence obtained from the research or citations from previous studies. The studies occasionally use causation language, but only when explaining a controlled experiment performed by the researchers.
Midunit assessment
At the midpoint of the unit, students have the opportunity to show off their new investigative skills by assuming the role of media journalists. Students select a COVID-19–centric study from an academic journal and reframe the content so that it remains valid and also intelligible by members of the general public. Students produce news articles following the guidelines specified in Rubric 1 (see Online Connections). This mini project serves as a formative assessment, allowing Rost to address any misconceptions students may have before progressing to more in-depth applications of scientific literacy.
Part II: Scientific literacy in experimental design and research studies
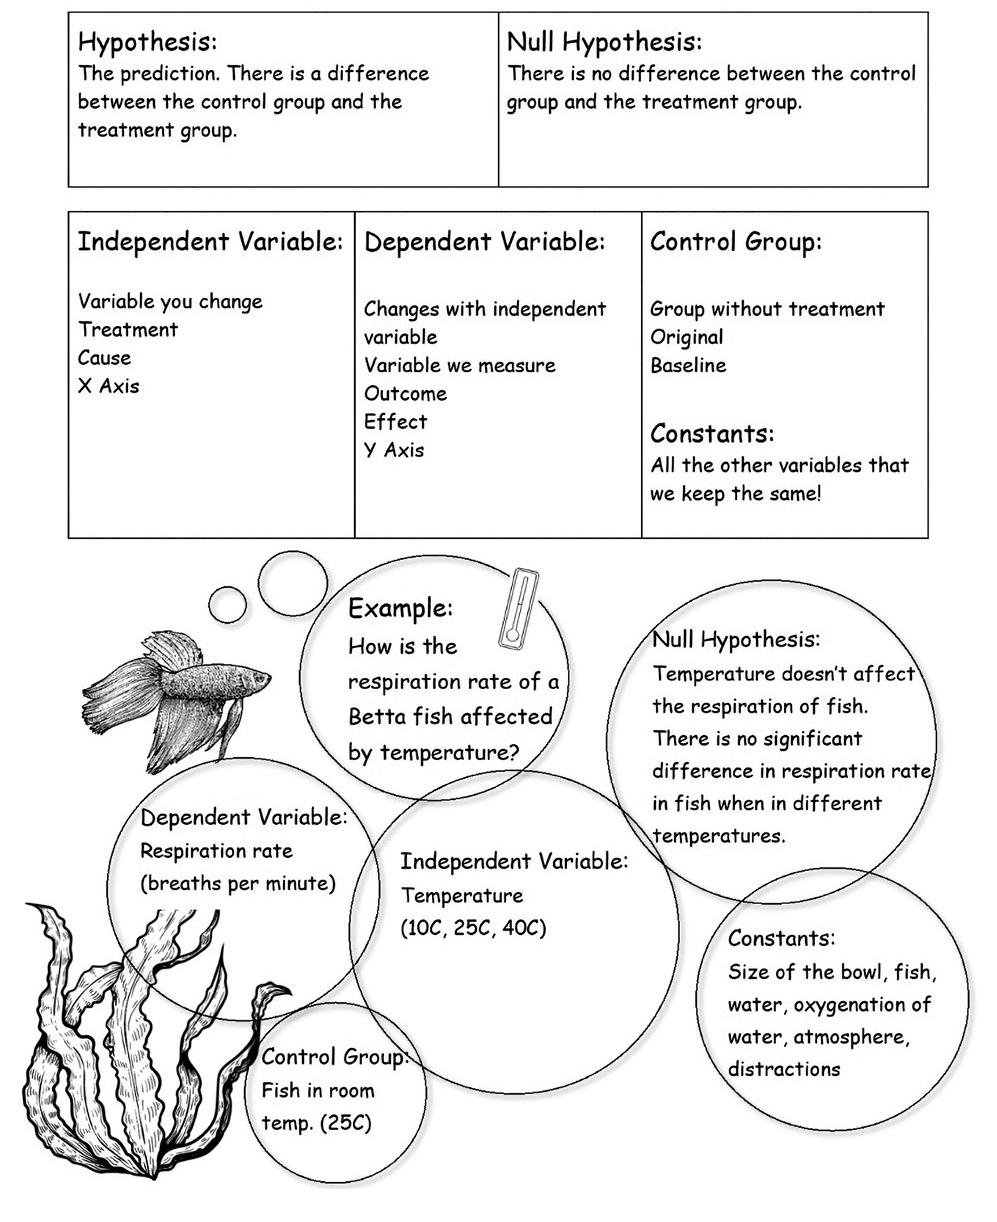
The first half of the unit centered around media sources produced for the consumption of casual readers. The second half pivots to address the efficacy of experimental design described in research studies, and culminates in creating an open-ended, student-led research project. To ensure all students have a basic understanding of experimental design, Rost facilitates a class discussion of a simple experiment shown in Figure 2. Students, working in small groups, produce a simple experimental design using a template (Figures 3A and 3B) and share their plans via Google Slides. Through peer collaboration, students gain practice in evaluating experimental designs and have the opportunity to gain insights from their peers to improve their experiments.
Student design template and example.
|
A. Experimental Design Template |
|
Design a sample experiment with masks or some other COVID topic. |
|
Purpose: Hypotheses Null:Alternative:Independent Variable: Dependent Variable:Control: |
|
B. Student Created Example (COVID-19) |
|
COVID-19 Experimental Design |
|
|
Climate Change Experimental Design |
|
| Table 2. Correlations do NOT imply causation. Words to watch for. | ||||||||||||||||||||
|---|---|---|---|---|---|---|---|---|---|---|---|---|---|---|---|---|---|---|---|---|
|
COVID-19 research and data interpretation
Using the investigative skills acquired in Part I of the unit, students explore publications concerning COVID-19 to produce an informative slide. Some groups were provided with structured questions linked with an associated article, while others were encouraged to identify problems and address them in an open-ended format. Students enter their information into a template to better standardize the content and increase accessibility for all students. Upon completion, all groups present their findings to the class. Examples of student slides are shown in Figure 4.
| Table 4. COVID 19 and climate change article review. Choose from the list of COVID articles with media version and scientific study version, then discuss how the main points are similar and different. | |||||||||||||||
|---|---|---|---|---|---|---|---|---|---|---|---|---|---|---|---|
|
While many scientific studies of COVID-19 mention the use of clinical trials or laboratory experiments, some refer to public health data, a publically-available raw data source. Public health databases provide a unique opportunity for high school students to analyze and manipulate real and relevant data, look for patterns, and form hypotheses. We provided links for two COVID-19 data sources (The COVID Tracking Project and Worldometers) and Rost created a screencast video to ensure students were competent in accessing, filtering, and graphing data. The video allows students to watch at their own pace, re-watch, and return to it if they have questions.
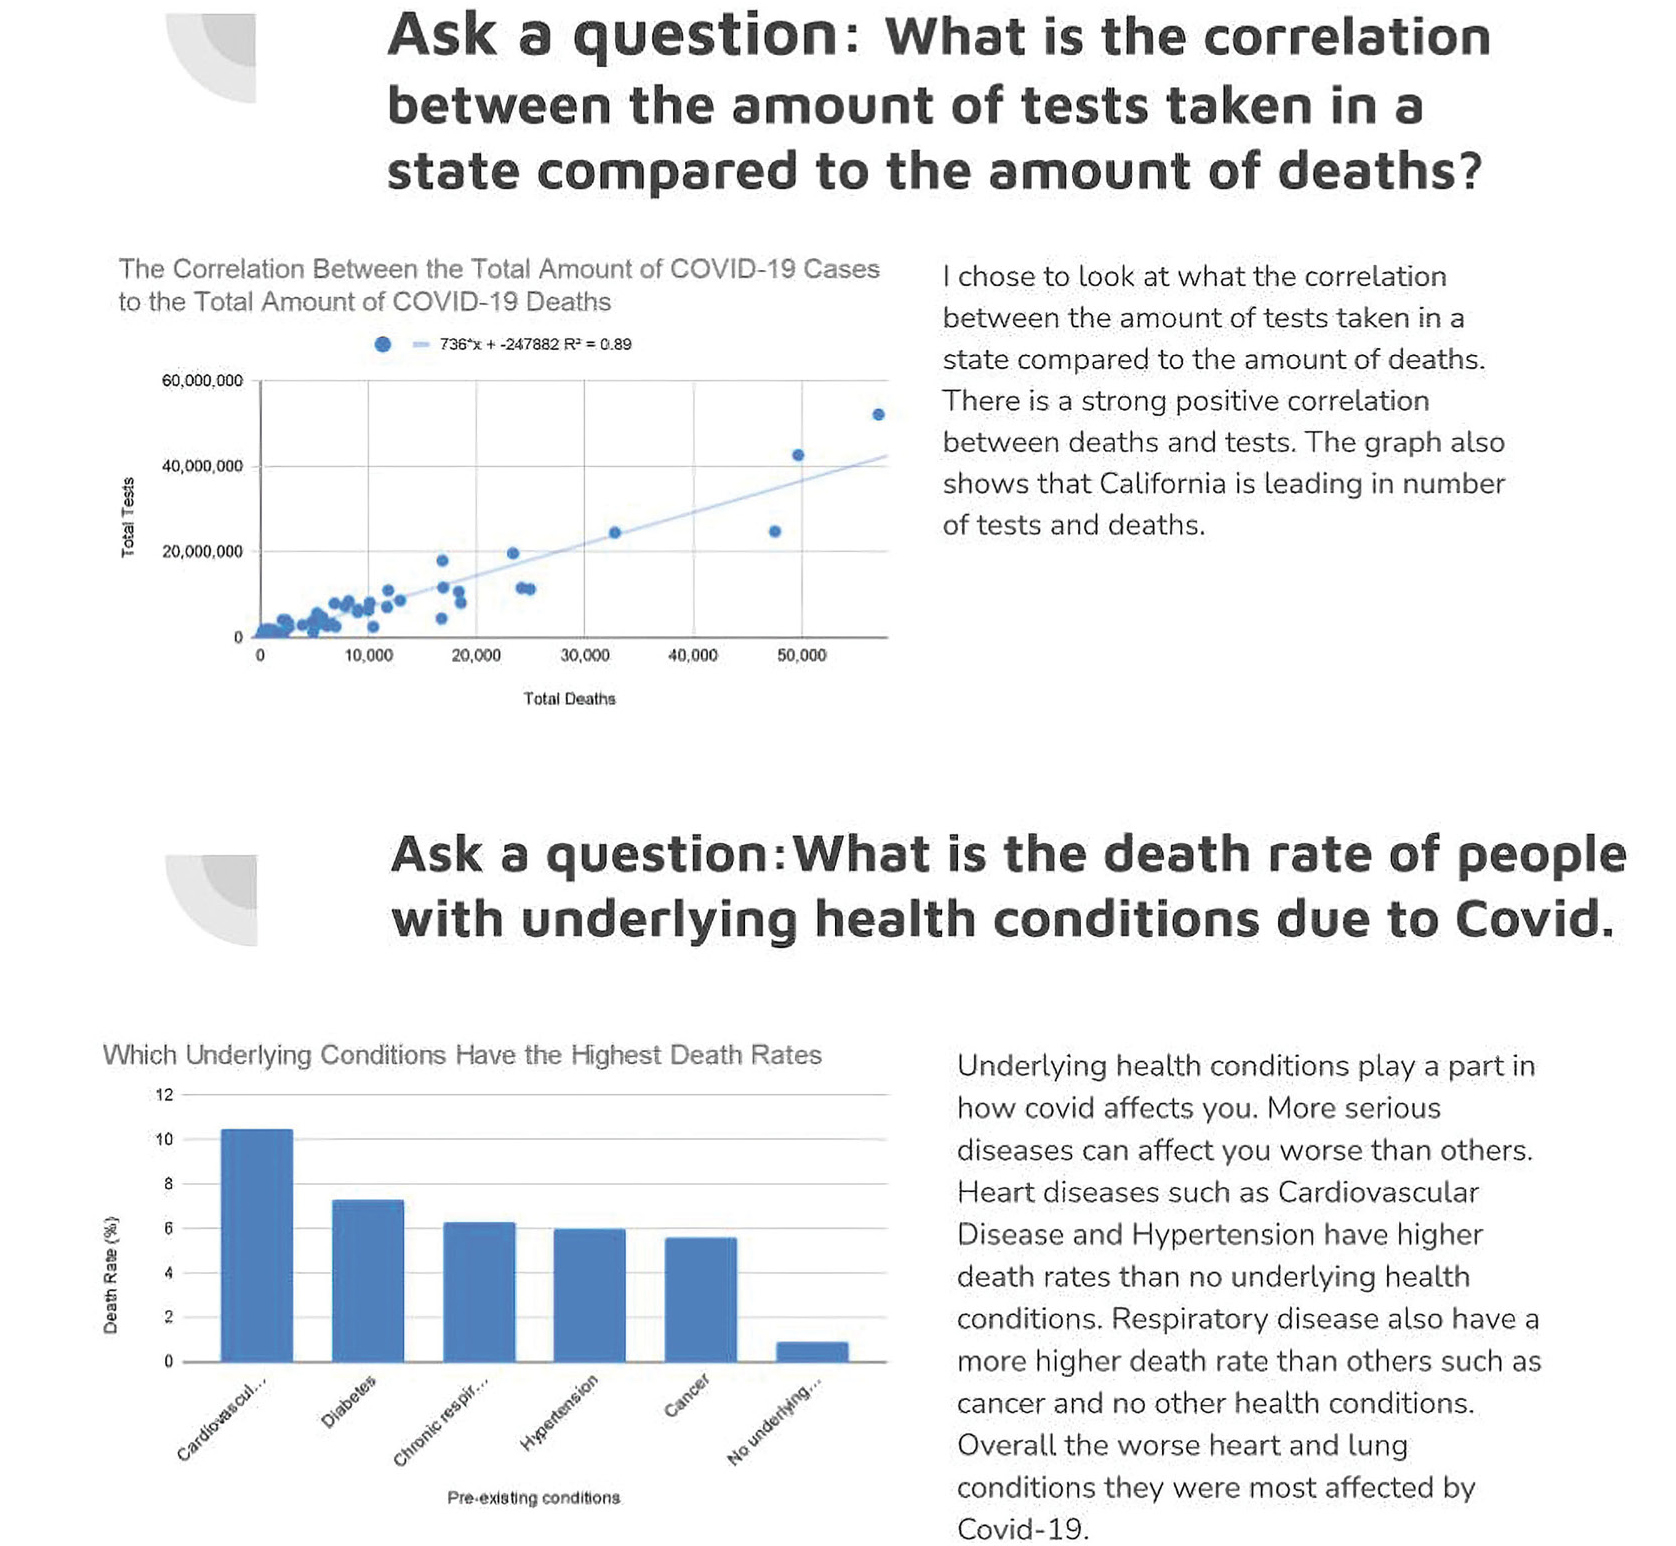
Students explore the data sets and generate questions. Some chose to investigate county-level data, while others focused on state and national data. Advanced students investigated correlations between variables and considered possible relationships. In addition to a class presentation, students share their findings on Google Slides in a standardized template, which allows them to be accessible to every class member. Examples of student slides are shown in Figure 5.
Open-ended COVID-19 research project
As a culminating project and summative assessment for the unit, students engage in open inquiry with the freedom to choose to conduct an experiment or a research project about COVID-19. Students who choose the experimental design are expected to develop a purpose, null and alternative hypotheses, independent and dependent variables, the controls, and the constants. They then describe their procedures, provide graphs, and report their results. Most students choose to design an experiment to determine the efficacy of currently recommended preventative measures.
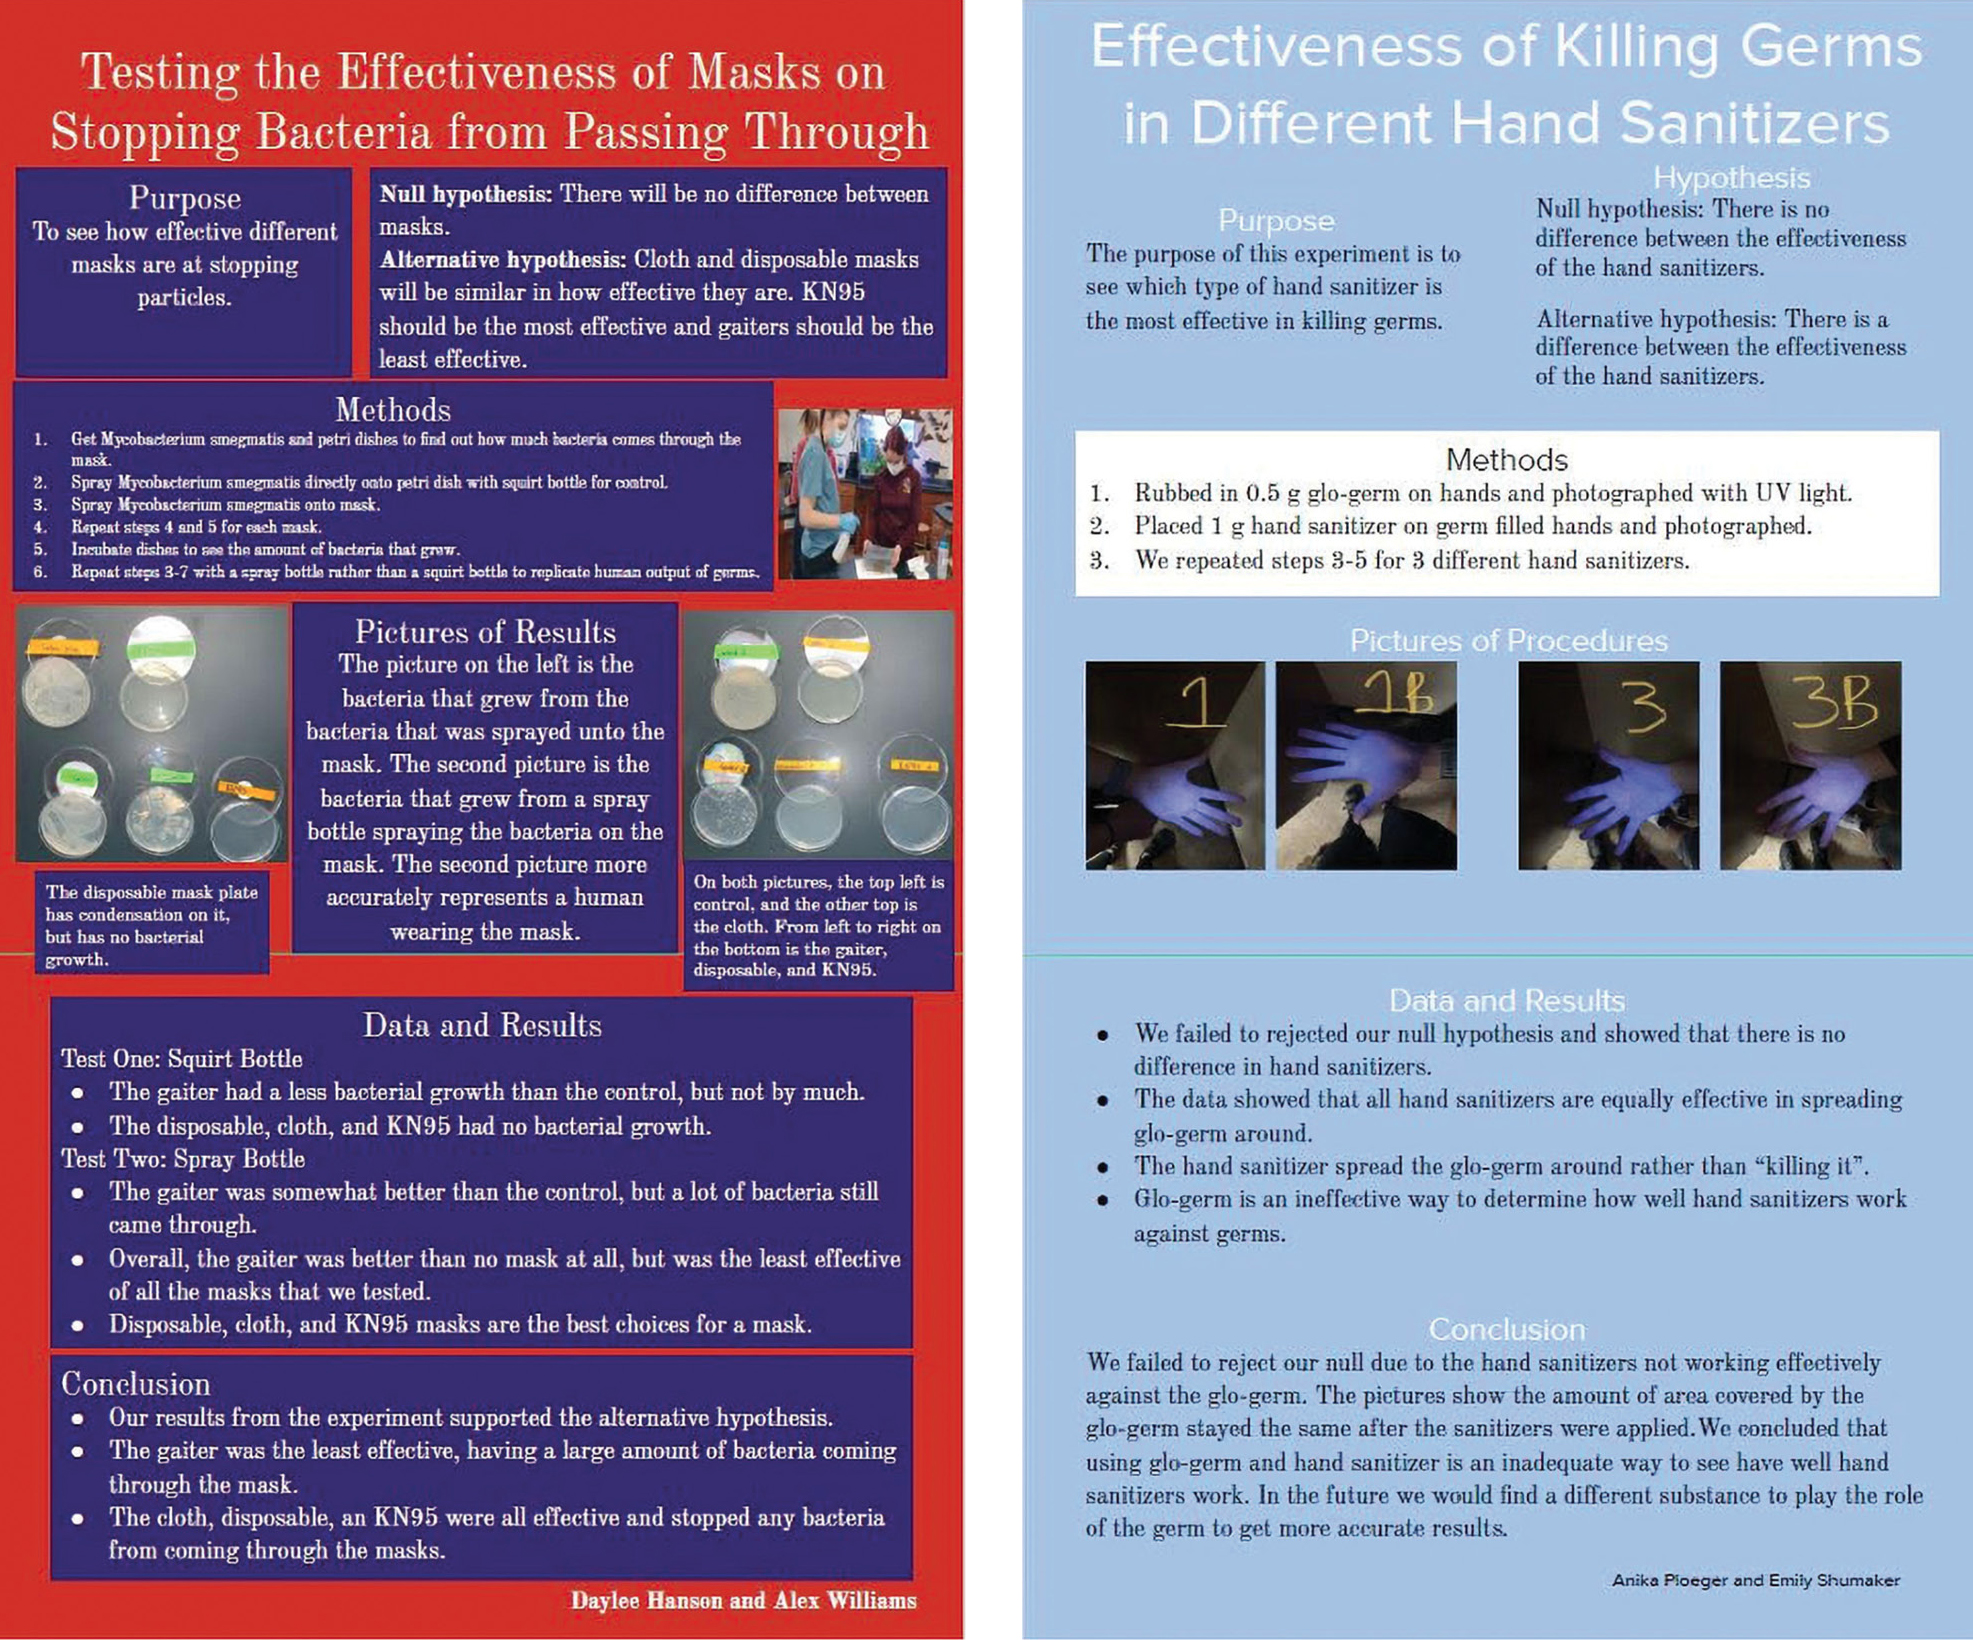
While students are free to develop their own experimental designs, they are required to adhere to lab safety standards, which include wearing both protective eye covering and, in some cases, latex gloves. Students share their experimental design and subsequent results by creating a poster that includes all aspects of the project. Student posters are shown in Figure 6. Rubric 2 (see Online Connections) helps scaffold student work and equitably assess the poster.
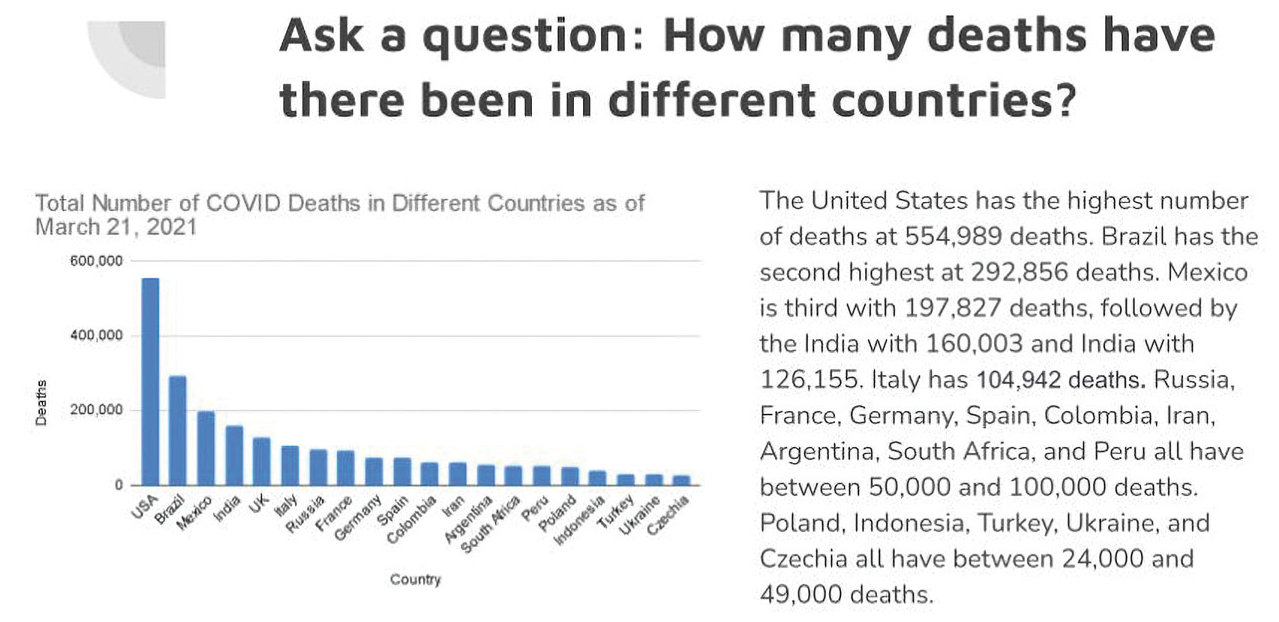
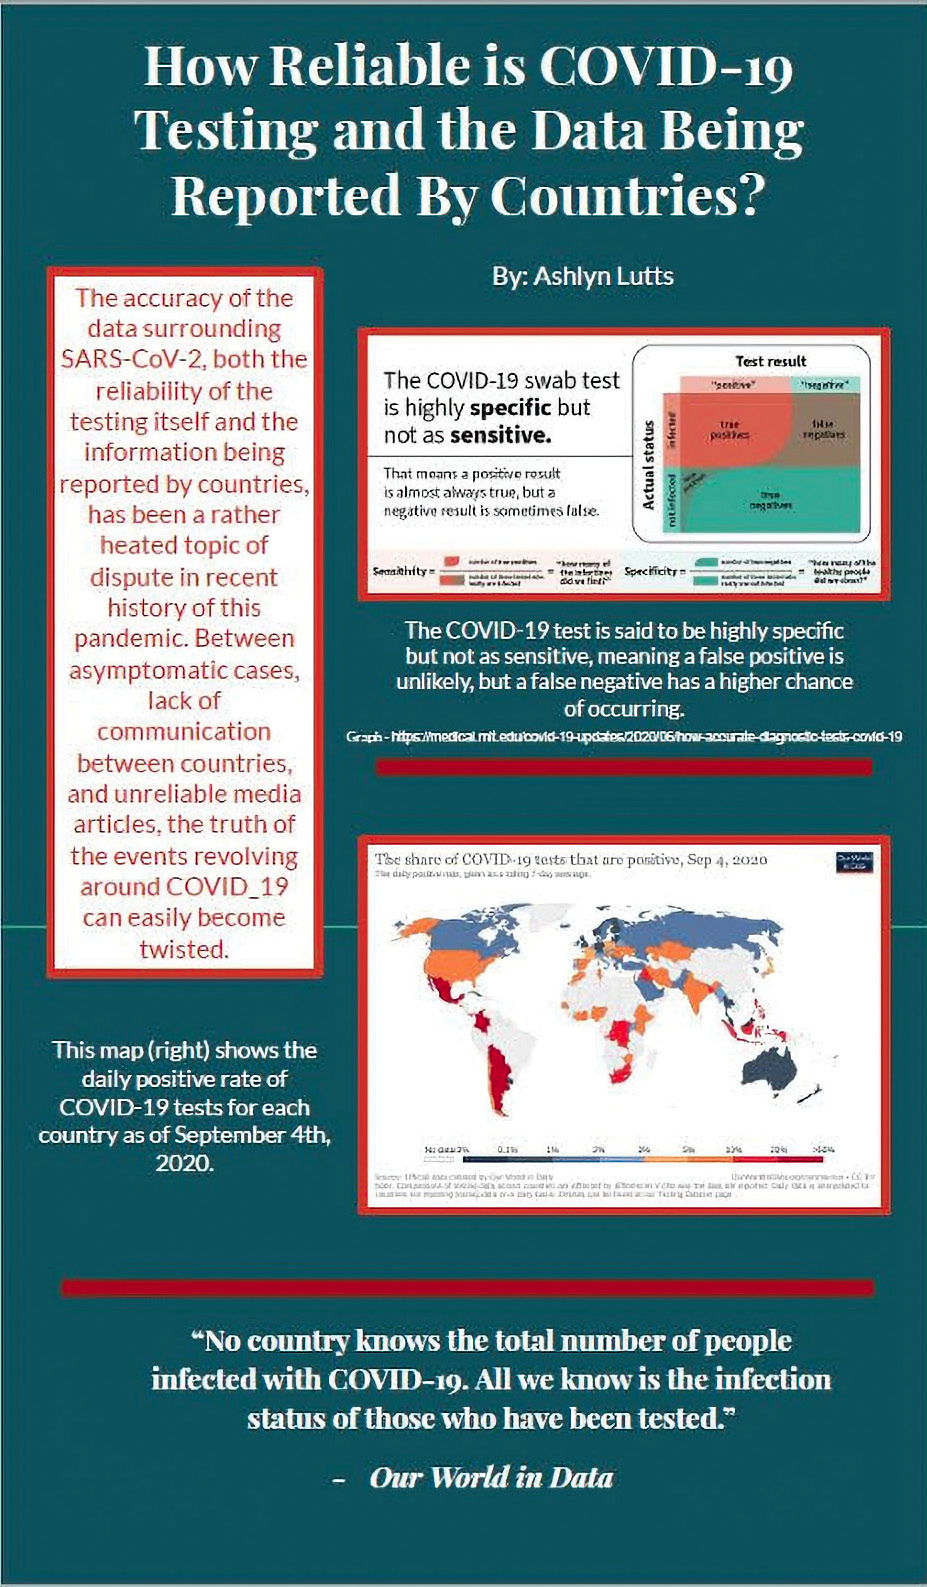
Students who choose the research option are expected to base their research on multiple sources. Like the experimental design group, students have to identify a question. However, instead of experimenting, the research students use data from at least three media and two peer-reviewed journal articles to form a scientifically accurate conclusion. Students who select this form of research tend to be interested in larger-scale aspects of the pandemic, like the impacts of different responses on the spread within countries, and the rate of infectivity across various age groups. A sample student poster is shown in Figure 7, along with the corresponding Rubric 3 (see Online Connections).
| Choose from the list of climate change articles with media version and scientific study version, then discuss how the main points are similar and different. | |||||||||||||||||||||
|---|---|---|---|---|---|---|---|---|---|---|---|---|---|---|---|---|---|---|---|---|---|
|
Conclusion and impact
When Rost began this unit on the second day of school, she shared that students, like frontline workers, have an essential role during the pandemic. In her class, they would develop the knowledge to help their families and their community navigate this pandemic more safely. She explained that if they choose to engage in safe practices, not only will they prevent the spread of disease and save countless lives, but their actions will help keep the school open.
As science teachers, we often gauge our success by the number of our students who pursue careers in science, but the pandemic has taught us that scientists alone cannot combat the threats to modern society. Whether facing a pandemic or climate change, our success lies in the collective actions of a scientifically literate citizenry. Without explicitly teaching media and scientific literacy in our classes, we allow our students to fall prey to the loudest, most convincing voices in the room—who may not be the most scientifically informed. ■
Online Connections
Table 3: https://bit.ly/3vQUG5J
Rubric 1: https://bit.ly/3fLMbDm
Rubric 2: https://bit.ly/3fO8j08
Rubric 3: https://bit.ly/3pqsCUA
COVID-19 Connections
260 sick at camp: CDC says children susceptible to COVID-19. https://www.ksn.com/news/health/coronavirus/260-sick-at-camp-cdc-says-children-susceptible-to-covid-19/?fbclid=IwAR2CN6vjmxex0I1R_Z8Bq6FVauXMzjDMKm7YGnNgfiptZzox2DwZaUZ-KhE
COVID-19 study: School ventilation systems could play role in stopping coronavirus spread (ABC7 Chicago). https://abc7chicago.com/ventilation-covid-spread-covid-19-study/6342910/
Heald-Sargent, T., W.J. Muller, X. Zheng, J. Rippe, A.B. Patel, and L.K. Kociolek. 2020. Age-related differences in nasopharyngeal severe acute respiratory syndrome coronavirus 2 (SARS-CoV-2) levels in patients with mild to moderate coronavirus disease 2019 (COVID-19). JAMA Pediatrics 174 (9): 902–903. https://doi.org/10.1001/jamapediatrics.2020.3651
How Covid-19 Signals the End of the American Era. https://www.rollingstone.com/politics/political-commentary/covid-19-end-of-american-era-wade-davis-1038206/
Letter to the editor: Look at the range of science on face masks. https://triblive.com/opinion/letter-to-the-editor-look-at-the-range-of-science-on-face-masks/
Leung, N.H.L., D.K.W. Chu, E.Y.C. Shiu, et al. 2020. Respiratory virus shedding in exhaled breath and efficacy of face masks. Nature Medicine 26: 676–680. https://doi.org/10.1038/s41591-020-0843-2
NSTA. Safety and School Science Instruction. https://www.nsta.org/nstas-official-positions/safety-and-school-science-instruction
Shao, S., D. Zhou, R. He, J. Li, S. Zou, K. Mallery, S. Kumar, S. Yang, and J. Hong. 2021. Risk assessment of airborne transmission of COVID-19 by asymptomatic individuals under different practical settings. Journal of Aerosol Science 151: 105661. https://doi.org/10.1016/j.jaerosci.2020.105661
Study says that young children carry as much coronavirus in their noses as adults. (n.d.). https://www.nbcnews.com/health/health-news/study-hints-young-children-may-spread-covid-19-easily-adults-n1235301
Szablewski, C.M., et al. 2020. SARS-CoV-2 Transmission and Infection Among Attendees of an Overnight Camp — Georgia, June 2020. MMWR. Morbidity and Mortality Weekly Report 69 (31): 1023–1025. https://doi.org/10.15585/mmwr.mm6931e1
Climate Change Connections
2020: A critical year for our future and for the climate. https://www.worldwildlife.org/stories/2020-a-critical-year-for-our-future-and-for-the-climate
Climate Change: Vital Signs of the Planet. https://climate.nasa.gov/causes/
Climate change: Fake news or global threat? This is the science. https://www.telegraph.co.uk/environment/2019/10/15/climate-change-fake-news-global-threat-science/?WT.mc_id=tmg_share_tw
Climate Feedback—A Scientific Reference to Reliable Information on Climate Change. https://climatefeedback.org/
Global Weirding with Katharine Hayhoe. https://www.youtube.com/channel/UCi6RkdaEqgRVKi3AzidF4ow
NASA Climate Kids. https://climatekids.nasa.gov/
Hurricane Florence isn’t the result of climate change, global warming. https://www.usatoday.com/story/opinion/2018/09/14/hurricane-florence-climate-change-global-warming-weather-greenhouse-flood-column/1289272002/
Intergovernmental Panel on Climate Change. https://www.ipcc.ch/
NASA: Climate Change and Global Warming. https://climate.nasa.gov/
Scientists Prove Man-Made Global Warming Is a Hoax. https://www.breitbart.com/politics/2019/04/09/nolte-scientists-prove-man-made-global-warming-is-a-hoax/
Ornes, S. 2018. How does climate change influence extreme weather? Impact attribution research seeks answers. Proceedings of the National Academy of Sciences of the United States of America 115 (33): 8232–8235. https://doi.org/10.1073/pnas.1811393115
The Sea Is Rising, but Not Because of Climate Change. https://www.wsj.com/articles/the-sea-is-rising-but-not-because-of-climate-change-1526423254
Jocelyn Miller (jocelynamiller@gmail.com) is a graduate student at Texas Tech University, Lubbock, TX. Linda Rost is a science teacher at Baker High School (MT) and a graduate student at Texas Tech University. Connor Bryant is a graduate student at Texas Tech University. Robyn Embry is a science teacher at Mitchell High School (IN) and a graduate student at Texas Tech University. Claire Lannoye-Hall is a graduate student at Texas Tech University. Shazia Iqbal is a graduate student at Texas Tech University. Missie Olson is a science teacher at Becker High School (MN), and a graduate student at Texas Tech University.
Biology Distance Learning Literacy Teaching Strategies High School