
feature
Who Is Most Affected By COVID-19?
Using StoryMaps With Student Investigations
COVID-19 is the first global pandemic in the age of the internet and the world has collectively documented the virus’s spread, offering a unique opportunity to study both the virus and the process of science in real time. Rarely has the scientific process been on such public display. This provides a prime opportunity for students to see how scientific data impacts their lives, as every student has been impacted by COVID-19 and can connect personally with the material. This is also an opportunity for teachers to help students develop into scientifically literate citizens who can differentiate between research and misleading information by engaging in science and engineering practices (SEP) (NRC 2012).
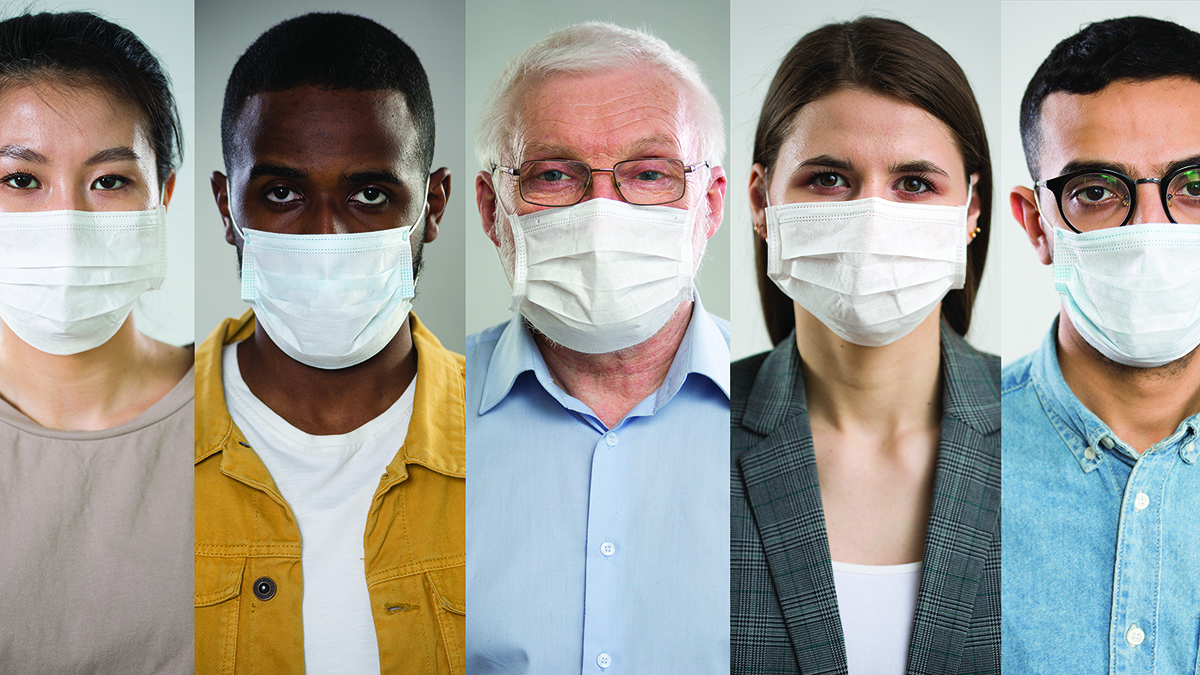
However, not all communities have seen the same impact of COVID-19. According to Joe Neel at National Public Radio, “No groups have been more affected than minority communities, both in terms of illness, death, and financial devastation. These communities were already disproportionately burdened by wage gaps and chronic illnesses before the pandemic” (2020). Hispanics and Native Americans are dying of COVID-19 at 1.5 times the rate of white people, and African Americans are dying at 2.4 times that rate (Wood 2020). The disproportionate impacts of COVID-19 do not stop with race but include other factors such as pre-existing conditions, age, socioeconomic status, and access to health care. The pandemic has highlighted the inequities present in our society and poses a valuable lesson for our students that the science they are learning has implications beyond the classroom. Ladson-Billings (2011) argues that for classrooms to be culturally relevant, they must address socio-political issues affecting students within their own communities. Oftentimes socio-political consciousness is difficult to address in the science classroom, but the applications in the study of the pandemic are clear. By guiding students to engage in scientific practices using a social justice lens, we help them understand how our societal systems continue to disproportionately impact people today.
The Who Is Most Affected By COVID-19? StoryMap investigation described here was implemented in a ninth-grade physics distance-learning class and integrates both current events and student choice for real-time relevancy, builds students’ science literacy, and strengthens socio-political consciousness. Using ArcGIS StoryMaps, students are presented with multiple real data streams related to COVID-19, on topics from testing access to income to race. They develop their own research question to investigate the relationship between COVID-19 and certain topics. When students have a personal or situational vested interest that also includes choice, they are motivated and progress in their learning (Doubet and Hockett 2018). Through an interactive final artifact—easily adapted to either face-to-face (FTF) or distance-learning (DL) environments—students present their results.
This StoryMap investigation allows students to engage in specific SEPs and emphasizes development in asking questions and defining problems; analyzing and interpreting data; and obtaining, evaluating, and communicating information (NRC 2012). Whether students choose to pursue a career in science or not, as citizens they will be making decisions related to their health and well-being around scientific policy. Having knowledge about how scientific knowledge develops and discerning valid scientific research from misleading information will allow them to make informed choices.
ArcGIS StoryMaps
ArcGIS StoryMaps is a web-based application that allows for the development, creation, and use of maps to visualize data, conduct spatial analysis, and investigate relationships through a storytelling narrative. StoryMaps, produced and maintained by the Environmental Systems Research Institute (Esri), provide a variety of templates involving combinations of text, pictures, web pages, and interactive maps to tell a story or lead an investigation. StoryMaps’ online format provides flexibility to teachers and accessibility for students. Through a free public account, teachers can choose from a wide selection of StoryMap collections developed by the Esri team, NOAA, NASA, Harvard University, and others or opt to create their own from the templates provided. On Esri’s website, StoryMap collections cover various topics, such as climate change, environmental racism, sustainability, New York’s street art scene, women’s suffrage, and even retracing the footsteps of James Bond.
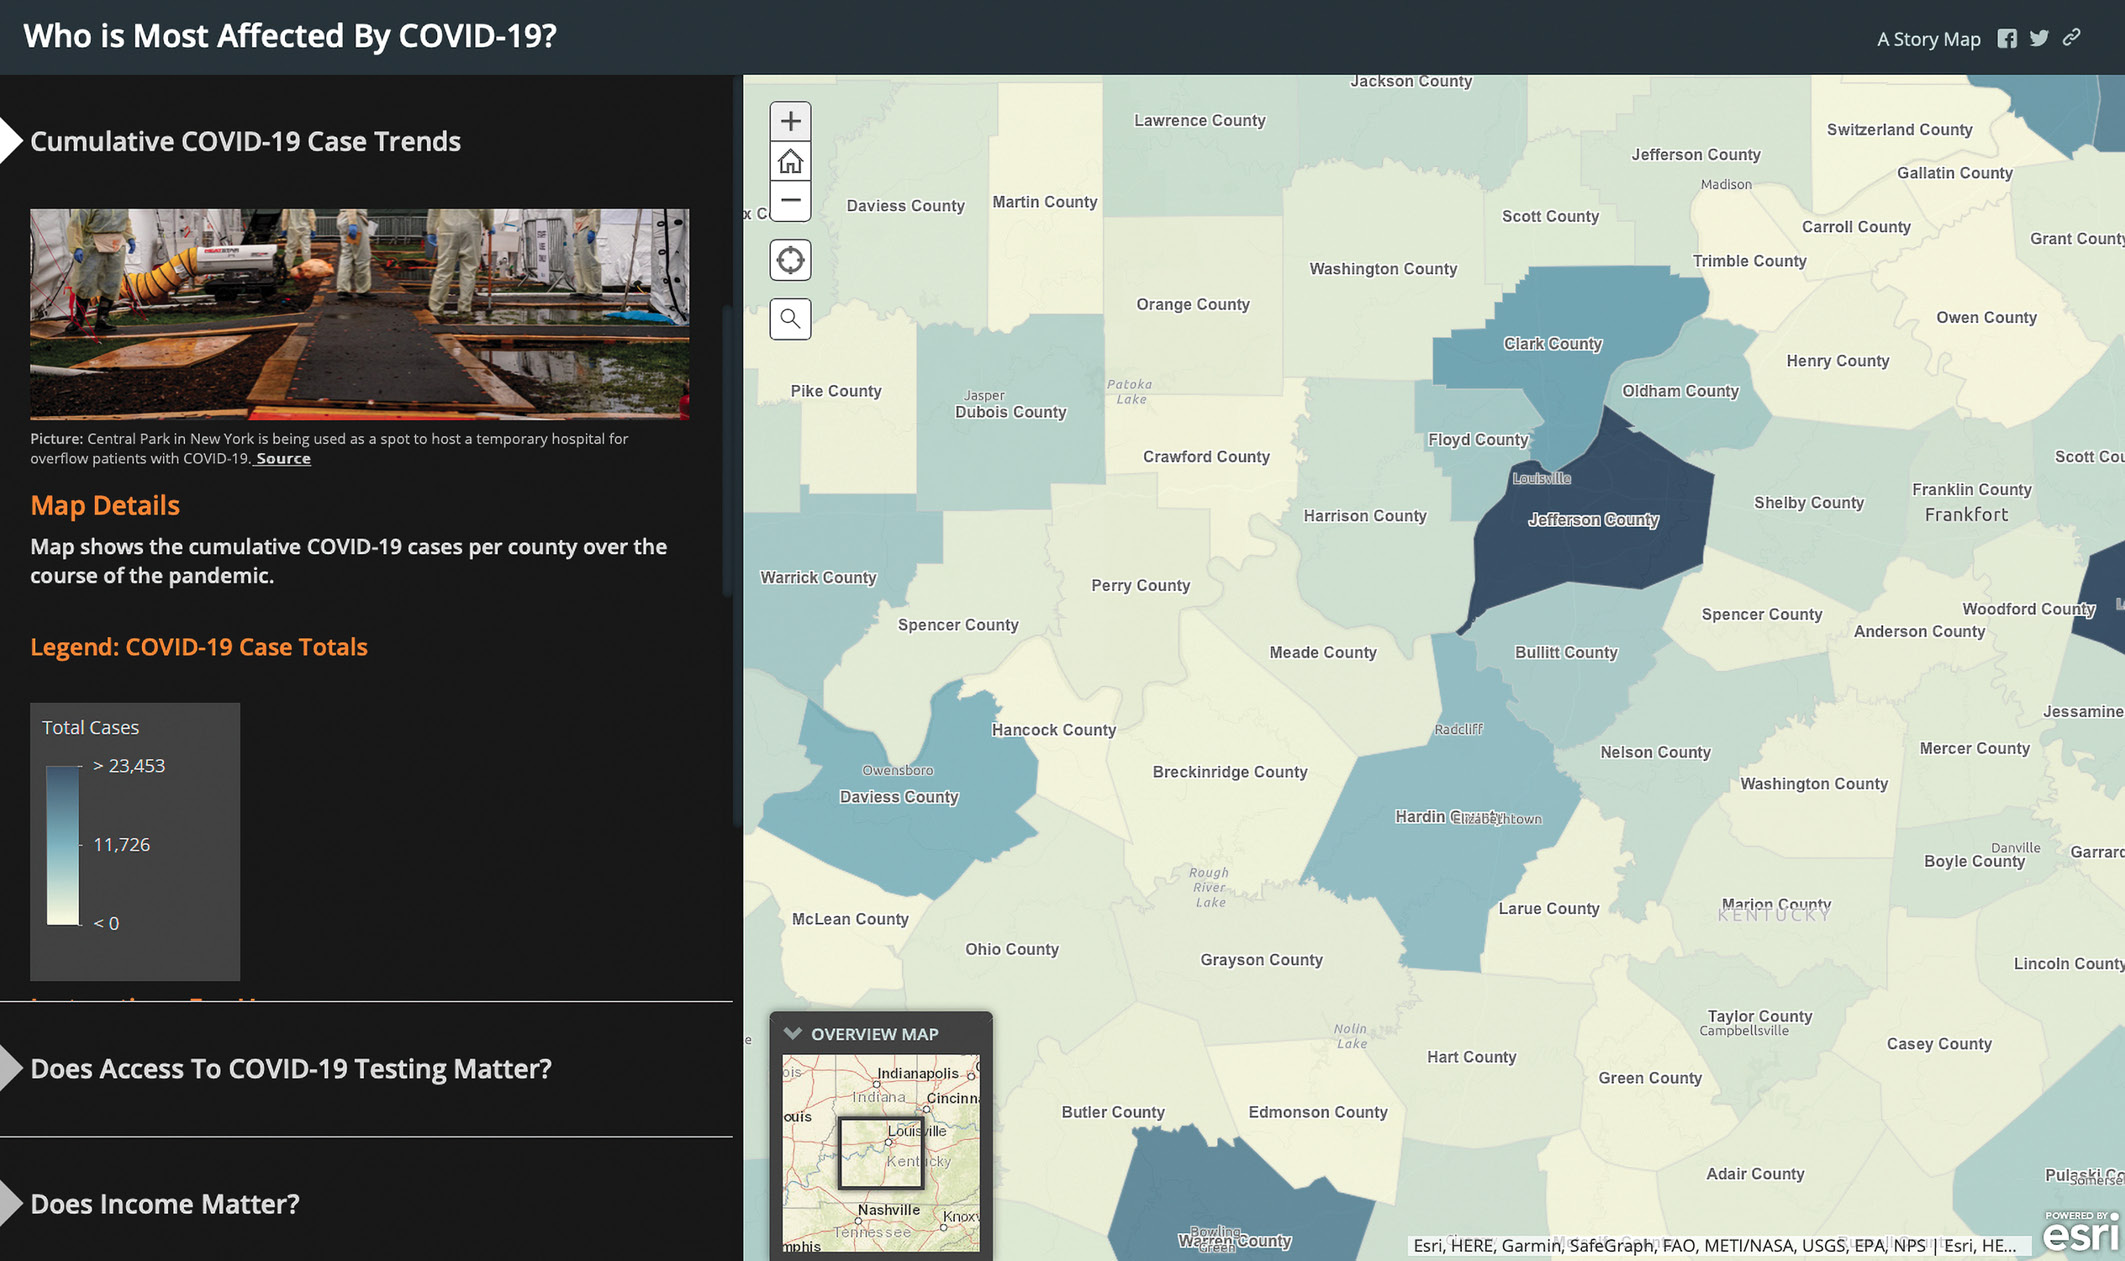
In our StoryMap, Who Is Most Affected By COVID-19?, we compiled a series of eight maps containing information regarding COVID-19, demographic data, and environmental data for the United States to outline an investigation into how different populations are disproportionately affected by the pandemic. These maps include information on the cumulative COVID-19 case trends, COVID-19 testing locations, average household income, poverty rates, race, age, air quality, and a data snapshot. Each map appears on a tab within the StoryMap with information about the map, details regarding the data, directions for use, and prompts to connect the information to other tabs.
Implementing Who Is Most Affected By COVID-19? StoryMap Investigation
Teachers can implement this investigation in both FTF and DL formats. Students design and develop their own questions around the connections between COVID-19 and certain factors; teachers can integrate this activity at various points throughout the semester to support the development of the SEPs skills and knowledge (e.g., at the beginning of the year to build a scientific literacy foundation or after a long break to refresh experiences with the SEPs). The author who used this investigation implemented it at the end of the semester because by then, students had a grasp of the SEPs. In addition, solid teacher-student relationships had been built, which aids in the discussion of social justice topics.
The investigation required three 30-minute DL periods to cover COVID-19 background information, introduce the StoryMap, investigate the research question, analyze the data, and reflect on the findings. Students were expected to complete work outside of class. If attempting to complete the entire investigation in class without homework, teachers should allocate approximately four 50-minute periods or two 90-minute periods.
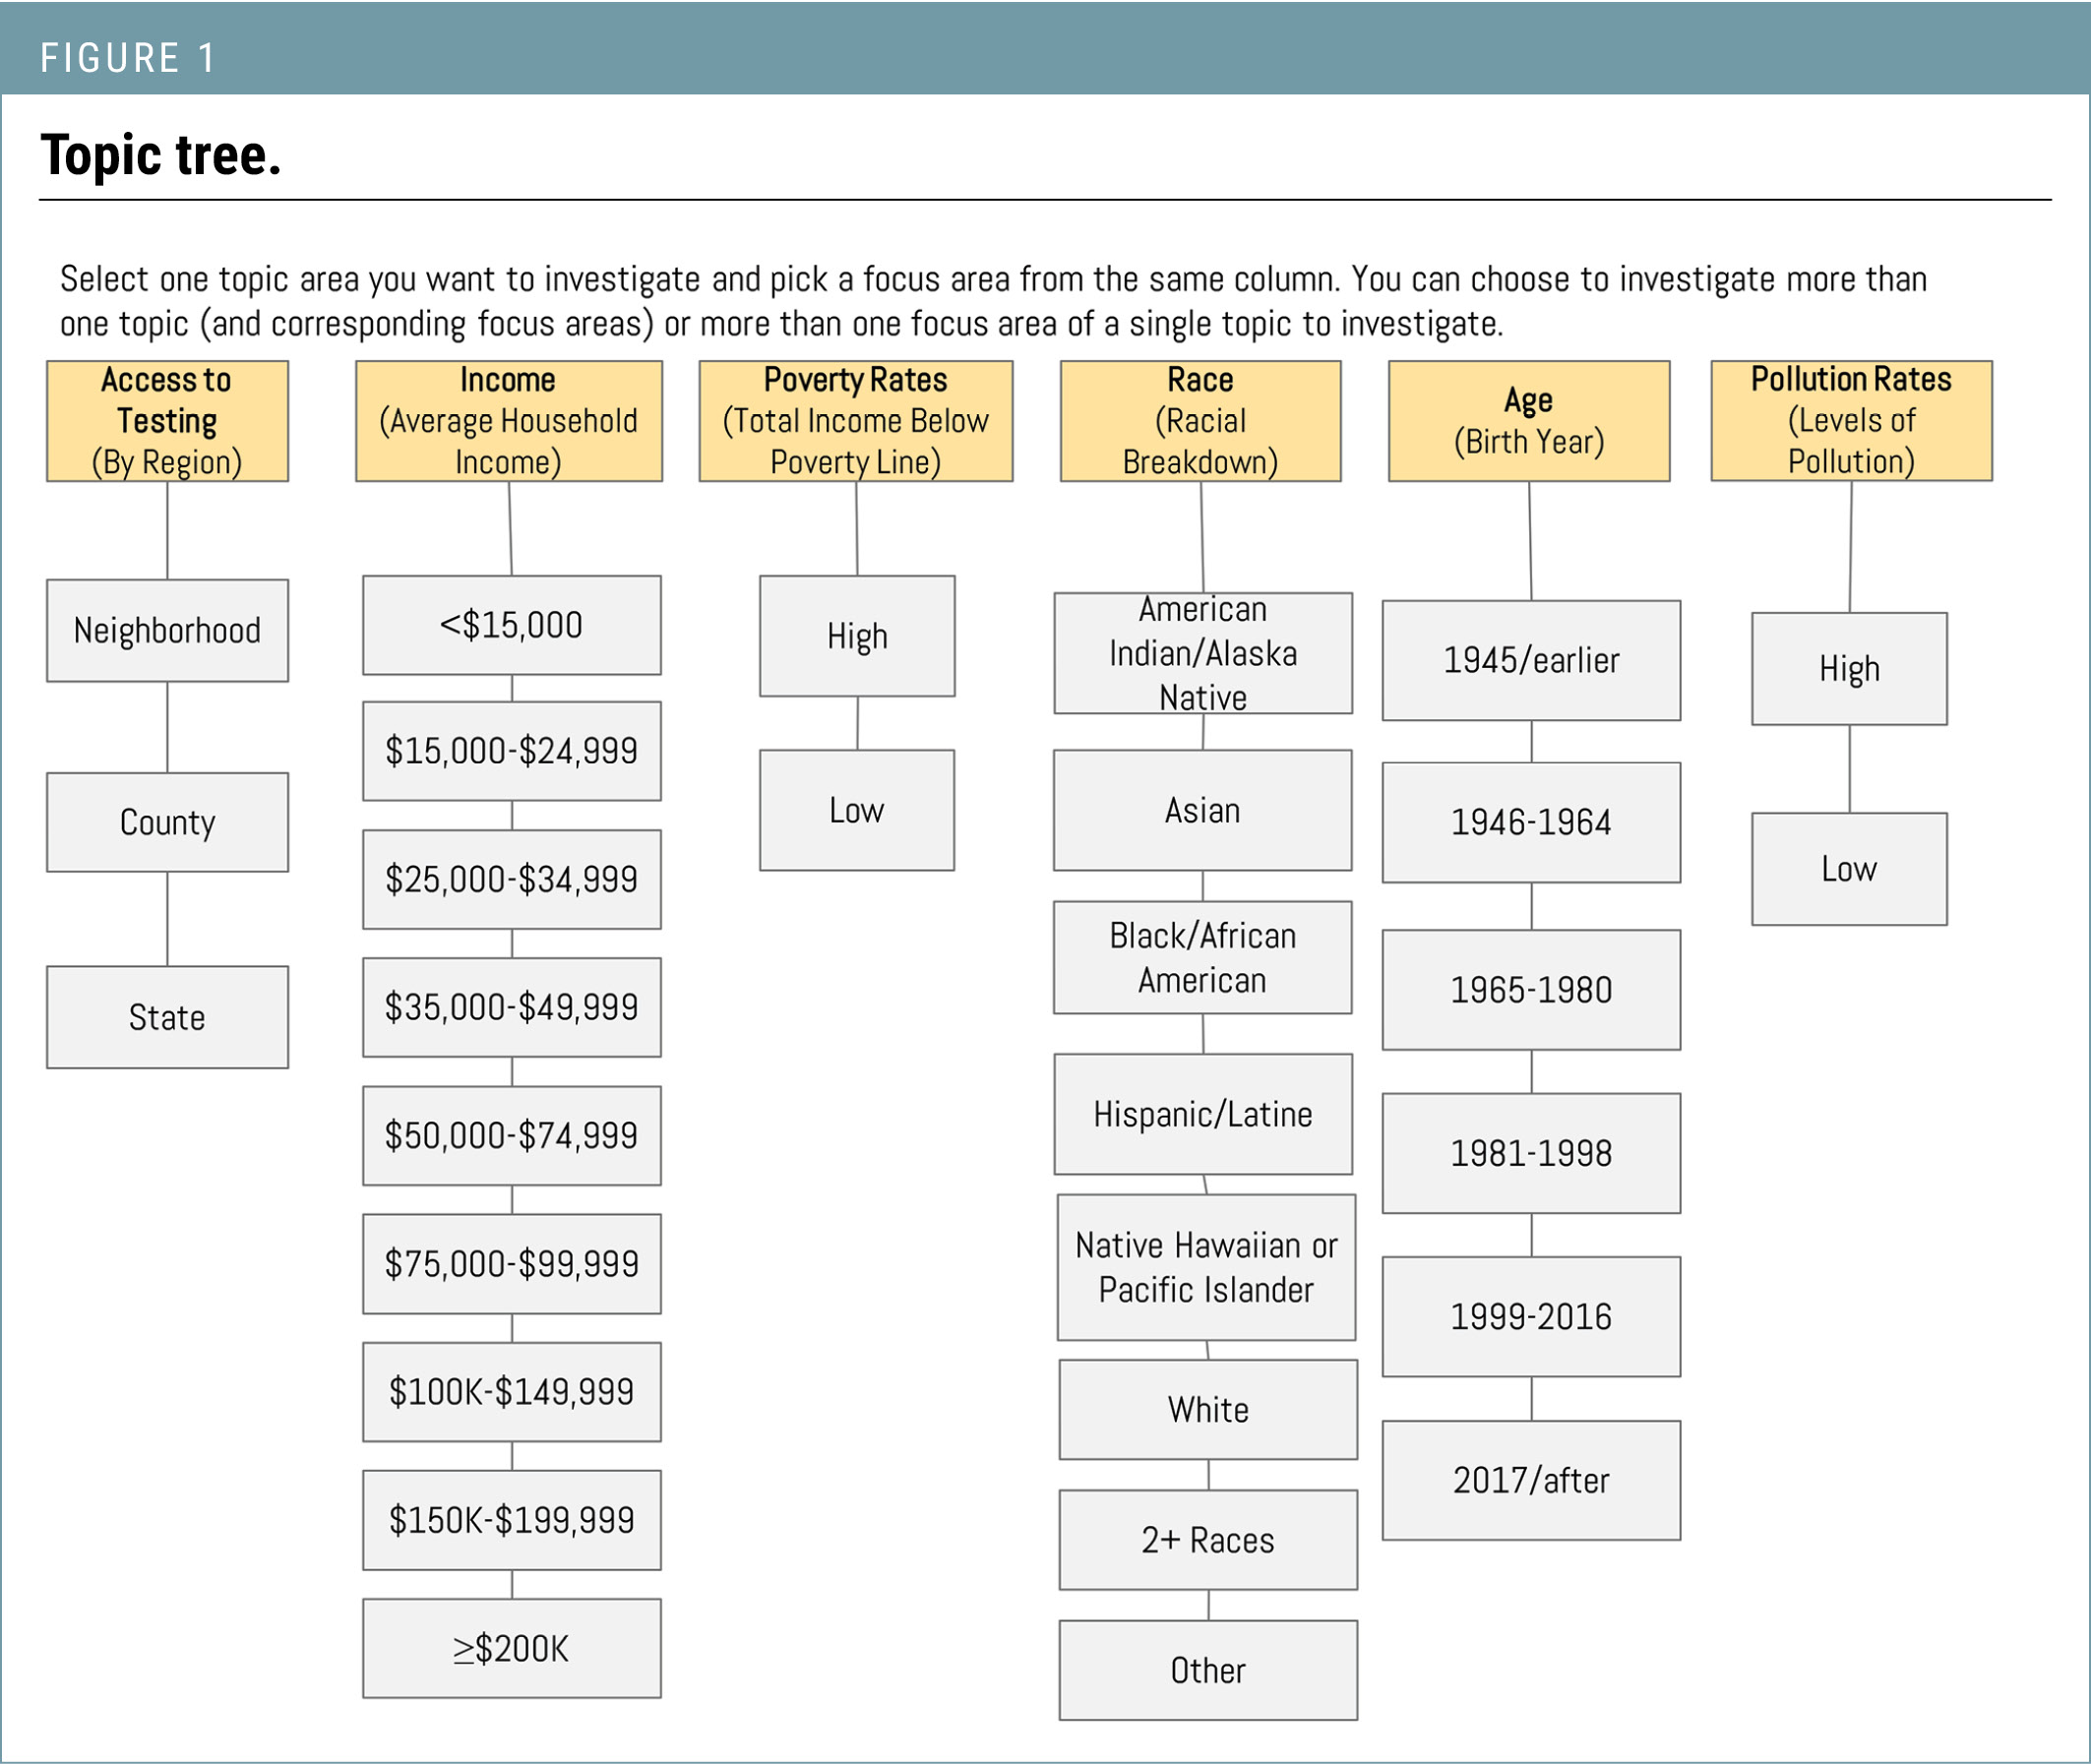
Students and teachers will need to access a specific set of resources to access the StoryMap, including a device with internet access (preferably a large tablet, laptop, or desktop computer, as the map requires a sizable screen to view properly). For FTF, students working in groups can share a device. For DL, students will need a device with internet access through a common browser (e.g., Safari, Chrome, Firefox). The StoryMap may be accessed using the direct link (see Online Connections) and does not require an ArcGIS or Esri account. Students will need the Topic Tree (see Figure 1), Question Generator (see Figure 2), and the Interactive Notebook (see Supplemental Materials). Teachers will need the Teacher Guide (see Supplemental Materials).
The teacher leads a discussion about what students have learned about the social impacts of COVID-19. Students can share what they know or how they have been affected; some students may refer to a virus overview from a previous unit or class. Teachers should ensure their students have a solid understanding of the current science around COVID-19. If teachers have not previously taken time to discuss the virus, we encourage taking a day to review the science of COVID-19 before starting the project, which may include an explanation of the virus, the way the virus spreads, the precautionary measures, and the current COVID-19 statistics for the world, the United States, or individual states. This ensures that students understand the scientifically accurate explanations before beginning the project to better grasp the impact of the pandemic. The Centers for Disease Control (CDC), Johns Hopkins Medicine, and state departments of health are appropriate resources to establish this core knowledge and disentangle any misconceptions. The teacher tracks the ideas on the board with FTF or in a virtual collaborative space (i.e., Google Jamboard, Padlet) with DL, looking for patterns or themes. Teachers draw connections between students’ notes and the ideas in the StoryMap, then explain that students will delve deeper into these topics.
Teachers show students the Who Is Most Affected By COVID-19? StoryMap and explain what StoryMaps are and the content of each tab. This is meant to be an introduction for students to the general layout of the StoryMap. Do not go into too much detail, as students will explore the StoryMap in groups of three or four. In the DL format, the author achieved this through the use of randomly assigned breakout rooms in Google Meet.
We propose three options for exploration to differentiate based on the needs of the class. For an unstructured exploration, give students a set amount of time and assign a single guiding question (e.g., What can you learn in five minutes about this StoryMap?). For a moderately structured exploration, students can provide answers to a list of guiding questions about the tabs in the StoryMap, then report what they learned. For a highly structured exploration, assign groups of students a specific tab of the StoryMap for which they answer a series of guiding questions. Sample guiding questions can be found in Table 1.
As the ninth graders needed additional guidance to focus on specific StoryMap elements, the author used the highly structured option. Based on student feedback, this exploration step should not be skipped in the investigation; students need the structured time to familiarize themselves with the StoryMap to ensure success in the subsequent steps. Regardless of the exploration structure, all groups share their findings with the class. The goal is for students to become familiar with the Who Is Most Affected By COVID-19? StoryMap and learn how to navigate the tabs for specific information.
Asking and Investigating the Research Question
Students design their own investigations to determine who is most affected by COVID-19 and engage in skill and knowledge development for three SEPs: asking questions and defining problems; analyzing and interpreting data; and obtaining, evaluating, and communicating information (NRC 2012). Students write their own research question looking at the effects of COVID-19 on one or more factors to determine the relationships between different variables; analyze the data that emerges from the StoryMap related to their research question to make valid scientific claims; and organize their data and communicate their findings in multiple formats.
The Who Is Most Affected By COVID-19? StoryMap contains eight different tabs, each of which can serve as a separate investigation. We encourage students to use a social justice lens, assessing how certain demographics are affected by COVID-19. For more advanced students, we encourage an intersectionality lens. Intersectionality refers to the “intersection” of social and political identities, such as race, class, and gender that coincide to provide an individual with overlapping levels of discrimination and privilege (Crenshaw 1989). Students should choose at least one topic within the StoryMap and then one area of focus within that tab to investigate in conjunction with the rates of COVID-19.
| Table 1. Guiding questions to structure the StoryMap exploration. | ||||||
|---|---|---|---|---|---|---|
|
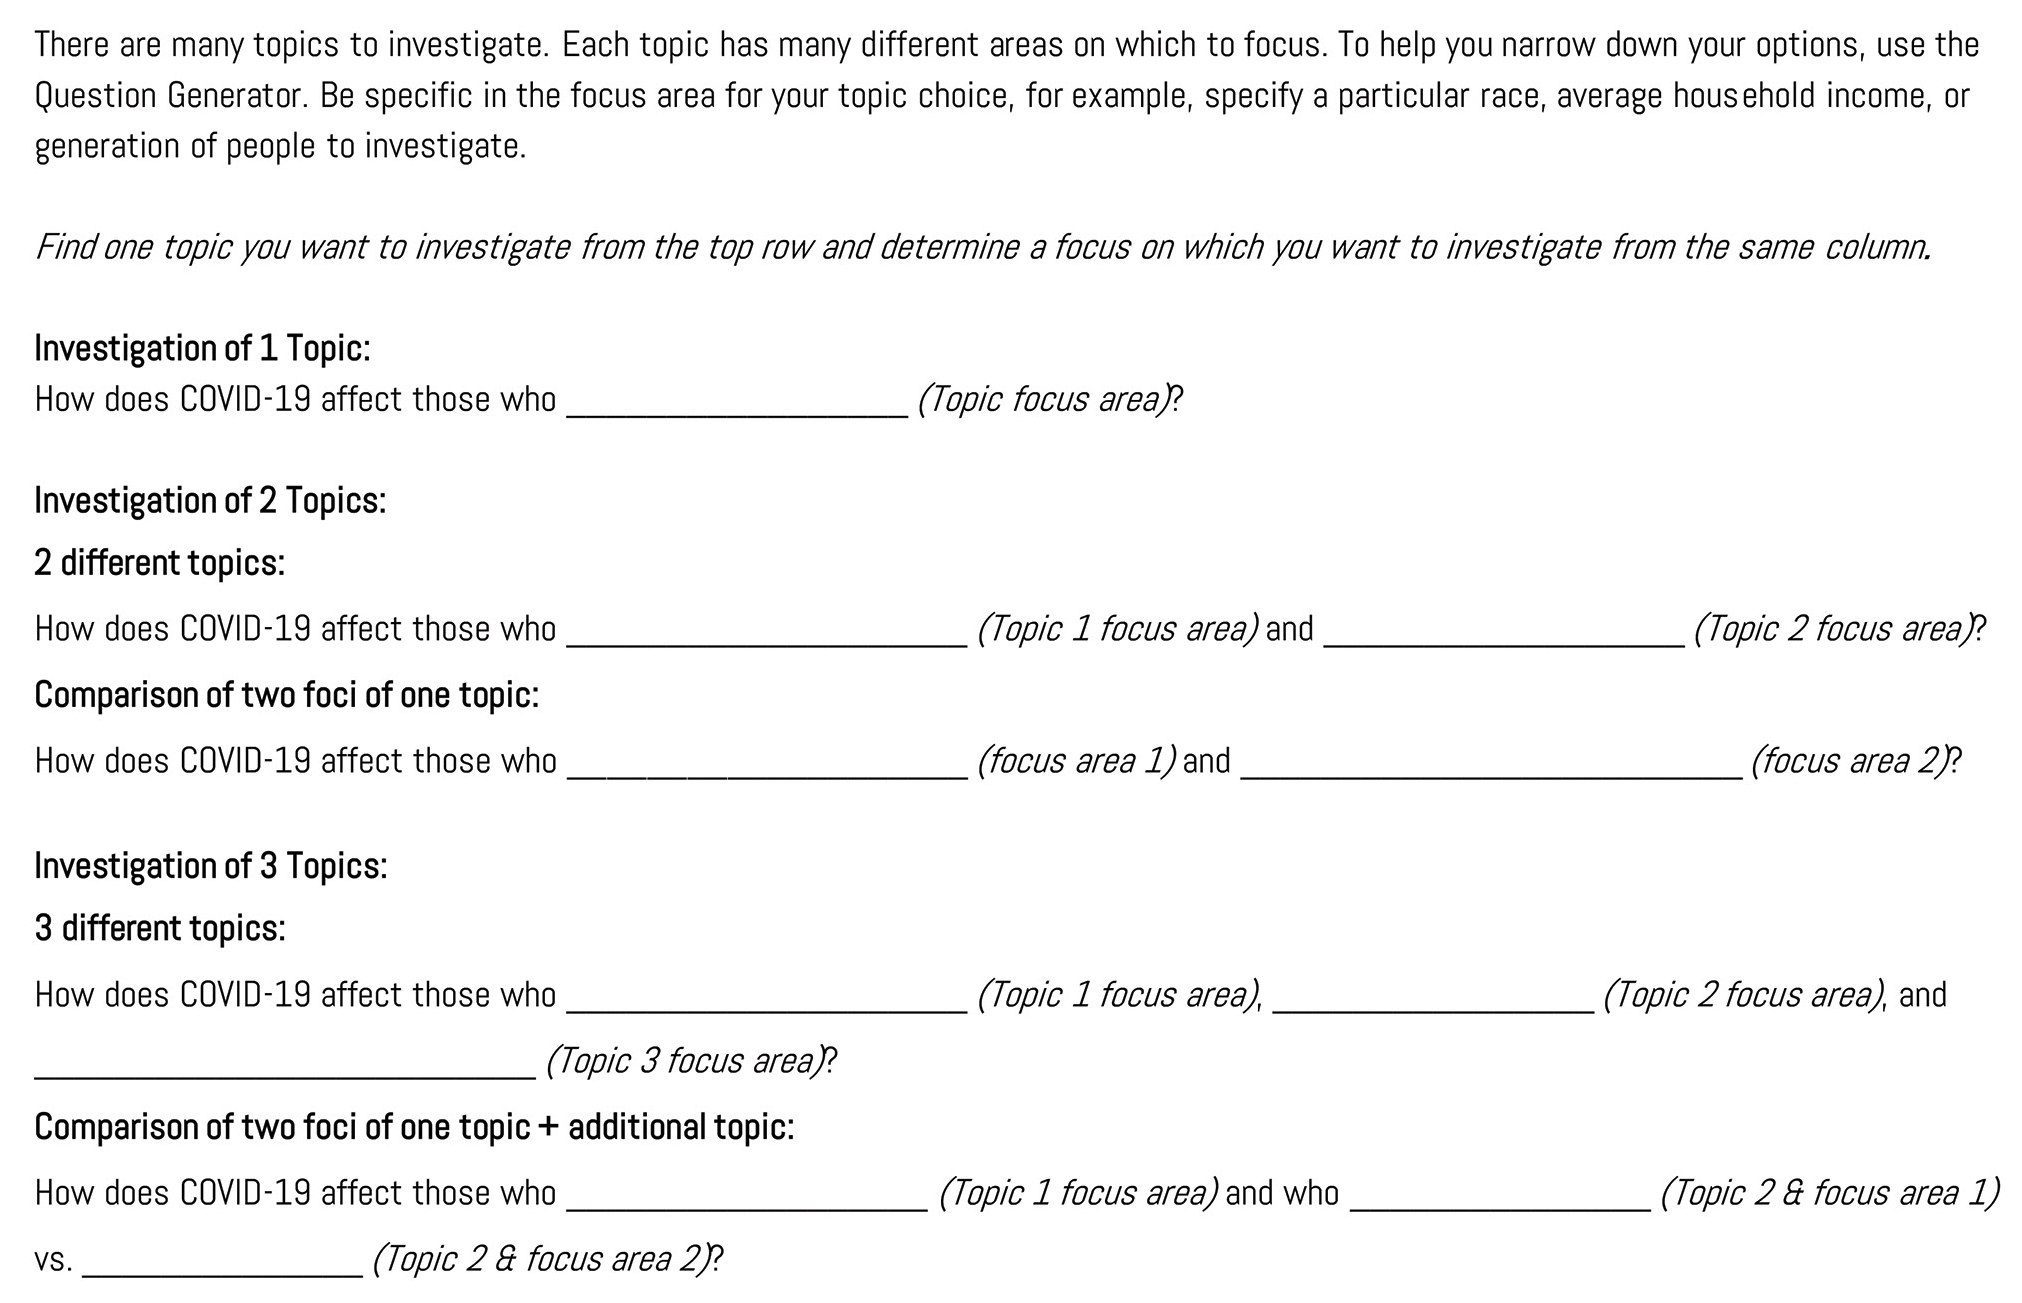
The adaptability of the investigation allows teachers to use more or fewer supports depending on the needs of their students. To guide students in picking a topic and generating a research question, see the Topic Tree (see Figure 1), Question Generator (see Figure 2), and Teacher Guide (see Online Connections). We recommend that these documents be used as scaffolds for those students that may need assistance in framing their question. Since this was used in a DL class, a Google Slides interactive notebook was incorporated to provide more structure (see Who Is Most Affected by COVID-19? StoryMap Investigation Interactive Notebook in Supplemental Materials).
After the students have chosen their topic, the teacher models the process of writing a proper research question. The Question Generator can be used as a support to help students frame their research question and the Teacher Guide provides specific examples of questions to guide the students. The Question Generator takes the potential variety of research questions into account by employing a formulaic approach, streamlining the question-writing process for students who need additional prompting. Depending on whether students have chosen to investigate a single topic, multiple topics, or a comparison of multiple focus areas within a topic, students can identify which template applies to them and then determine how to phrase their question. All questions are framed in a similar fashion and vary only by the number of topics and focus areas they contain. For example, a question with one topic and one focus would be formatted as, “How does COVID-19 affect those who ____________ (topic focus)?”
Before students begin their investigation, teachers should approve their research questions. During their work time, teachers do regular check-ins. These can be casual checkpoints, such as a verbal response or a thumbs-up from students, or teachers can include a formal checklist with spaces for teacher initials in FTF. Because this investigation was used in the DL format, the author placed students into breakout rooms according to their research topic, then moved between rooms to check in with each group of students. Check-ins can also be achieved with chat boxes and reactions in virtual meeting spaces.
Communicating Findings
During the final stage of the project, students share their findings from the data they have analyzed and interpreted. At a minimum, findings should include the research question, data, organization of the data, interpretation of the data, conclusion, and list of resources. Teachers can structure the sharing in the manner that best suits their students and their learning environment. We suggest the following types, which can be altered for both FTF and DL. Each is a good option for either group or individual projects, excluding class presentations, which are better suited to groups.
Types of Projects
- Posters. Students can visually format their data and display on trifold display boards in FTF. For DL, students can create a digital poster using tools such as PowerPoint or Google Slides.
- Videos. For DL, students can give presentations synchronously to the class or prepare videos outside of class using a video tool (e.g., VoiceThread, YouTube, FlipGrid) or screen capture program (e.g., Screencast-O-Matic, Screencastify, Loom), then upload their videos to the class site. Teachers can make the videos available for all the students to watch and even require peer feedback to ensure engagement.
- Newscast or Story. Throughout the pandemic, students may have seen and heard information about COVID-19 delivered through a variety of platforms, such as television newscasts, online articles, YouTube videos, or social media stories. Have students choose a method of news delivery and design a newscast or story regarding their investigation findings. Have them distill their findings into what is most important for members of the community to know and learn about the impact of COVID-19. This format could be an in-person newscast, a video recording, or a social media post.
Types of Sharing
- Live Class Presentations. Each group presents their findings in front of the classroom. Students can use any props or materials to assist them in sharing what they found in response to their research question. Live presentations work best in FTF environments and are ideally suited to groups.
- Gallery Walk. In a gallery walk, half of the class stays with their projects while the other half moves around the room listening to and asking questions of the presenters. Teachers can structure this time with specific questions that students ask the presenters or have the students provide peer feedback using a rubric. After a certain amount of time, the two groups flip roles. Projects for FTF can take all forms, from posters to infographics. Projects for DL can use any technological platforms commonly used in the classroom.
- Whole School. Give students an opportunity to share with the entire school. Presentations can be displayed in a hallway or gymnasium. Videos can be posted to a shared school site for students to access.
After sharing the final products, encourage a class discussion of the investigation findings and a final individual reflection. For this investigation, students were required to make an informational Google Slide to share with their classmates in their assigned breakout room. Groups were structured so that there were a variety of topics covered so each group could learn about topics beyond their own. Once all students had shared their findings, the class regrouped to discuss major takeaways. Teachers make connections and look for common patterns and themes across the different COVID-19 research questions. This project is about societal impacts of COVID-19, so teachers need to help students clearly see all the impacts their classmates uncovered. The final reflection—where students answer the guiding question, “Who is most affected by COVID-19?”—helps students process what they learned about a scientific issue through a social justice lens.
Conclusion
The Who Is Most Affected By COVID-19? StoryMap investigation ultimately provides students with a relevant and authentic learning experience of a global issue to help them become informed and socially conscious citizens. Bringing in current events in science makes real-world connections for students. These skills, from asking questions to interpreting data to communicating findings, are important for scientific literacy. Students can see that the skills they learn in science help them have a greater understanding of the global situation and set them up to make informed decisions, both now and in the future. By discussing the pandemic through a social justice lens, the Who Is Most Affected By COVID-19? StoryMap investigation helps students analyze current data to see the larger systems at work in the United States and to understand how different communities are unequally impacted. ■
Online Connections
Who Is Most Affected By COVID-19? StoryMap: https://www.arcgis.com/apps/MapSeries/index.html?appid=dc1e0d29b68441fcaa2ce0bfbe40b54d
Who Is Most Affected by COVID-19? StoryMap Interactive Notebook: https://bit.ly/3fjIeWh
Who Is Most Affected By COVID-19? StoryMap Teacher Guide: https://bit.ly/3vomvlC
National Public Radio (NPR) - Harvard Forum: Pandemic’s Disproportionate Impacts on Minority Communities in U.S. Cities: https://www.npr.org/sections/health-shots/2020/09/30/917857018/forum-pandemics-disproportionate-impacts-on-minority-communities-in-u-s-cities
NPR - COVID-19 Death Rate For Black Americans Twice That For Whites, New Report Says: https://www.npr.org/sections/coronavirus-live-updates/2020/08/13/902261618/covid-19-death-rate-for-black-americans-twice-that-for-whites-new-report-says
NPR - As Pandemic Deaths Add Up, Racial Disparities Persist - And In Some Cases Worsen: https://www.npr.org/sections/health-shots/2020/09/23/914427907/as-pandemic-deaths-add-up-racial-disparities-persist-and-in-some-cases-worsen
Centers for Disease Control (CDC) - Coronavirus Disease 2019: https://www.cdc.gov/coronavirus/2019-nCoV/index.html
Journal of the American Medical Association (JAMA) - Airborne Transmission of SARS-CoV-2: https://jamanetwork.com/journals/jama/fullarticle/2768396
Johns Hopkins University and Medicine - Coronavirus Disease 2019: Myth vs. Fact: https://www.hopkinsmedicine.org/health/conditions-and-diseases/coronavirus/2019-novel-coronavirus-myth-versus-fact
Johns Hopkins University and Medicine - COVID-19 Map: https://coronavirus.jhu.edu/map.html
World Health Organization (WHO) - Coronavirus disease (COVID-19) advice for the public Mythbusters: https://www.who.int/emergencies/diseases/novel-coronavirus-2019/advice-for-public/myth-busters
ArcGIS StoryMap - Explore Collections: https://www.esri.com/en-us/arcgis/products/arcgis-storymaps/stories
Laura Lusardi (laura.lusardi@my.uwrf.edu) is a physics teacher at Fridley High School in Fridley, MN, and Rachelle Haroldson is a Clinical Associate Professor at the University of Wisconsin-River Falls in River Falls, WI.
Biology Computer Science Teaching Strategies Technology High School