
feature
Experiential Mindfulness
Connecting Mindful Breathing to Human Physiology

According to mindfulness researcher Jon Kabat-Zinn, “mindfulness is awareness that arises through paying attention, on purpose, in the present moment, non-judgmentally” (Kabat-Zinn et al. 2019). Meditation has been found to impact physiology by improving blood pressure (Momeni et al. 2016; An et al. 2021) and heart rate variability (May et al. 2016; Kirk and Axelsen 2020). In children, anxiety can be treated using mindfulness training (Semple et al. 2005). These benefits can also be seen outside of the medical world. With increasing stressors on teachers and students alike, research has shown a positive impact of using mindfulness in the classroom (Rosaen and Benn 2006; Albrecht et al. 2012; Britton et al. 2014; Arthurson 2015). Practices such as meditation and yoga have been shown to be effective in youth with ADHD and learning disabilities (Black et al. 2009; Evans et al. 2018). Mindfulness is a useful tool to reduce test anxiety and put students at ease in school (Carsley et al. 2015; Shahidi et al. 2017).
Although mindfulness is a known method for reducing stress and anxiety, many high school students are naturally skeptical about meditation. When teaching a reluctant audience, science teachers understand the value in allowing for experiential and inquiry-based learning so that students can reach their own conclusions. In inquiry-based learning, students use the scientific method to answer questions (Pedaste et al. 2015; Tawfik et al. 2020). The level of student autonomy when using inquiry-based learning can vary from structured (teacher provides question and steps) to open (student asks the question and develops a plan) (Zion and Mendelovici 2012). In alignment with the Next Generation Science Standards, students completing this activity are asked to carry out an investigation and analyze and interpret data. Approaching mindfulness from an experiential perspective can be accomplished quantitatively by having students take functional measurements, such as heart rate variability (Prokofieva et al. 2019), before and after a five-minute mindful meditation. In the activity described here, structured inquiry is used to investigate the cardiovascular and respiratory systems in conjunction with mindfulness.
Learning objectives
The goal of this activity is for students to collect cardiovascular and respiratory data in support of learning about these systems. Students will
- investigate how mindful meditation impacts the cardiovascular and respiratory systems;
- practice methodology for assessing heart rate, blood pressure, respiration rate, and anxiety index; and
- gain experience using the scientific method.
Further, because this activity asks students to engage in mindfulness as part of their research and not as a stand-alone endeavor, a secondary goal is to reduce potential student resistance to the exploration and practice of mindful meditation. Having completed this activity, students will draw conclusions about the impacts of mindfulness in the classroom.
Methods
Overview and setup
This activity is designed to closely follow the format of a scientific article by incorporating background research, hypothesis writing, experimental design, analysis of results, and drawing conclusions. The end product for this project is a professional-looking scientific poster that addresses how the independent variable (mindfulness meditation) impacts a dependent variable (heart rate, respiration rate, blood pressure, or anxiety level). This poster can be completed in groups of two to four, depending on the class size. Students conduct a literature search regarding mindfulness, mental health, and the cardiovascular and respiratory systems before writing their hypothesis related to their dependent variable. Before collecting data, students view a five-minute mindfulness video and are asked to practice the methodology. Although students are only making a poster related to one dependent variable, everyone will collect data related to all four dependent variables. Students also design a survey as a class to determine their anxiety index. Research and survey creation should be done before doing the mindfulness experiment.
Experimental design
The experimental design for this activity involves a multiday investigation in which students take measurements of physiological and mental health before and after watching a five-minute guided mindfulness meditation video. The video can be found online from websites such as Calm.com. Upon entering the classroom, the teacher tells students to sit and talk quietly so that their heart and respiration rates are at a resting state before taking their initial measurements. Students then collect data for four dependent variables: heart rate, respiration rate, blood pressure, and anxiety index.
Heart and respiration rates are measured by counting heartbeats and breaths, respectively, over a 30-second period and then multiplying by two to get a per-minute value. This can also be done using other time intervals (such as 60 seconds), but the author found 30 seconds to be a good time period for keeping students focused on counting. It is challenging to focus on counting breaths and heartbeats, so this will need to be practiced before collecting data. Blood pressure is taken using Lumiscope semiautomatic upper arm blood pressure monitors (Model 1100, Figure 1). Blood pressure monitors can be temperamental to use, so students should practice taking blood pressure before starting the experiment. Students can work in pairs to take blood pressure data so that they can assist one another in using the monitor. Students then complete their student-created anxiety index survey (described in the next section).
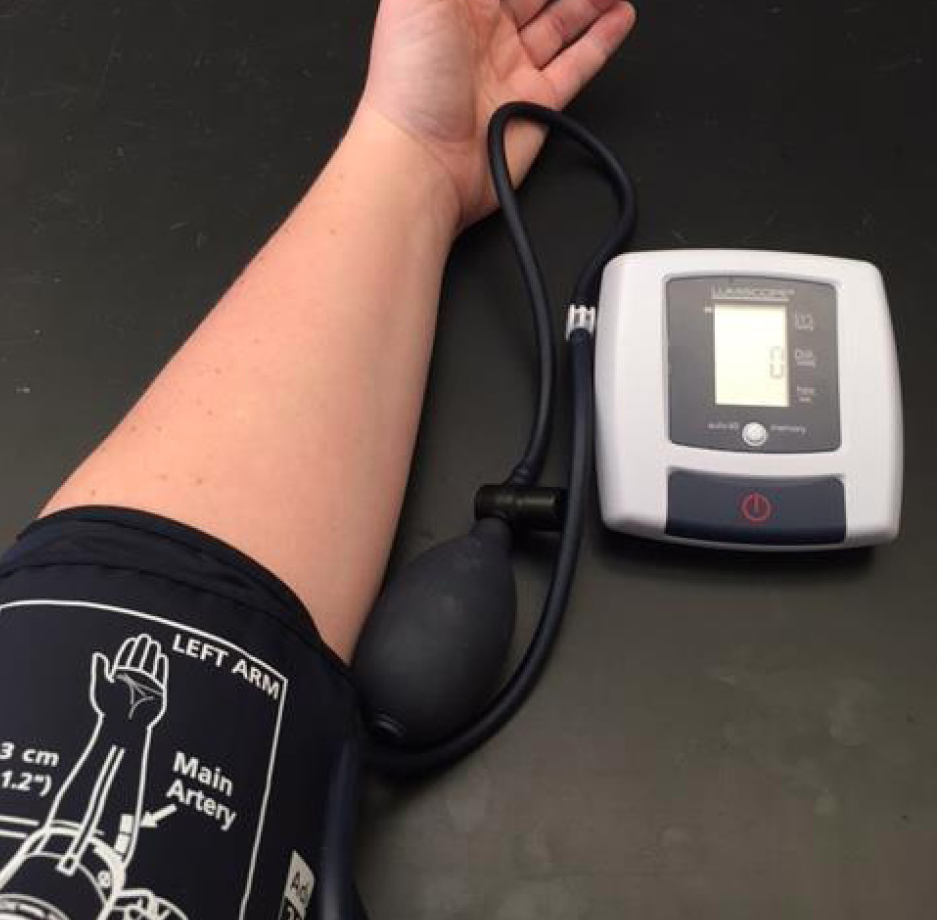
Lumiscope monitor used for taking blood pressure.
The lights are dimmed to prepare for the mindfulness meditation video activity. When working with this age group, some students will not take the meditation seriously. To account for this, the instructor should establish norms for students to follow. Students should clear their desks, and all technology should be silenced and put away. The instructor should also tell students that they are expected to be calm and quiet during the meditation.
The data collection is then repeated after the meditation is completed. When drawing conclusions from data, it is always best to have a large sample size. This can be accomplished by compiling data across class sections and/or doing multiple trials. When doing multiple trials for this exercise, the trials should be on different days.
Anxiety index
To measure anxiety levels, each class creates its own three-statement survey using a Likert scale for responses. Having researched symptoms and physiology of anxiety, the class determines statements that address measurable manifestation of anxiety. This can be done in small groups that then report out to the whole class. A list of statements can be made and the class can then vote on the top three. Example statements include “My brain is overloaded,” “I can’t concentrate,” and “I’m worried about school and sports.” Although the statements are subjective, they allow students to take ownership of the project and to determine how meditation impacts their own thoughts and feelings. The Likert scale used is: strongly disagree (1), disagree (2), agree (3), strongly agree (4). Students quantified their anxiety by adding the score of their responses. A higher score (close to 12) indicates higher anxiety and stress. To get accurate data, the responses to this survey are always kept anonymous. This can be done using paper and pencil or a Google survey.
Organizing, analyzing, and sharing data
Once the data is collected, it is compiled into one document and shared with students for easy access during analysis. A challenge with the collected data is the nonlinear nature of the results. For each independent variable, data is grouped into the following categories: large decrease, small decrease, large increase, small increase. Each designated histogram bin is selected by the teacher using the standard deviation (within one standard deviation is a small change and within two standard deviations is a large change). The students are put into four groups and begin by analyzing the data for one independent variable. Using Microsoft Excel, the groups then design graphs to display the data. Each group then creates a scientific poster that outlines the research process in regard to one independent variable (Figure 2). This poster is assessed using a rubric that addresses criteria for each section (introduction, methods, results, discussion, works cited) as well as general format and professional appearance. After each group shares their poster with their classmates, the class discusses the value of mindfulness as a tool for reducing stress and anxiety.
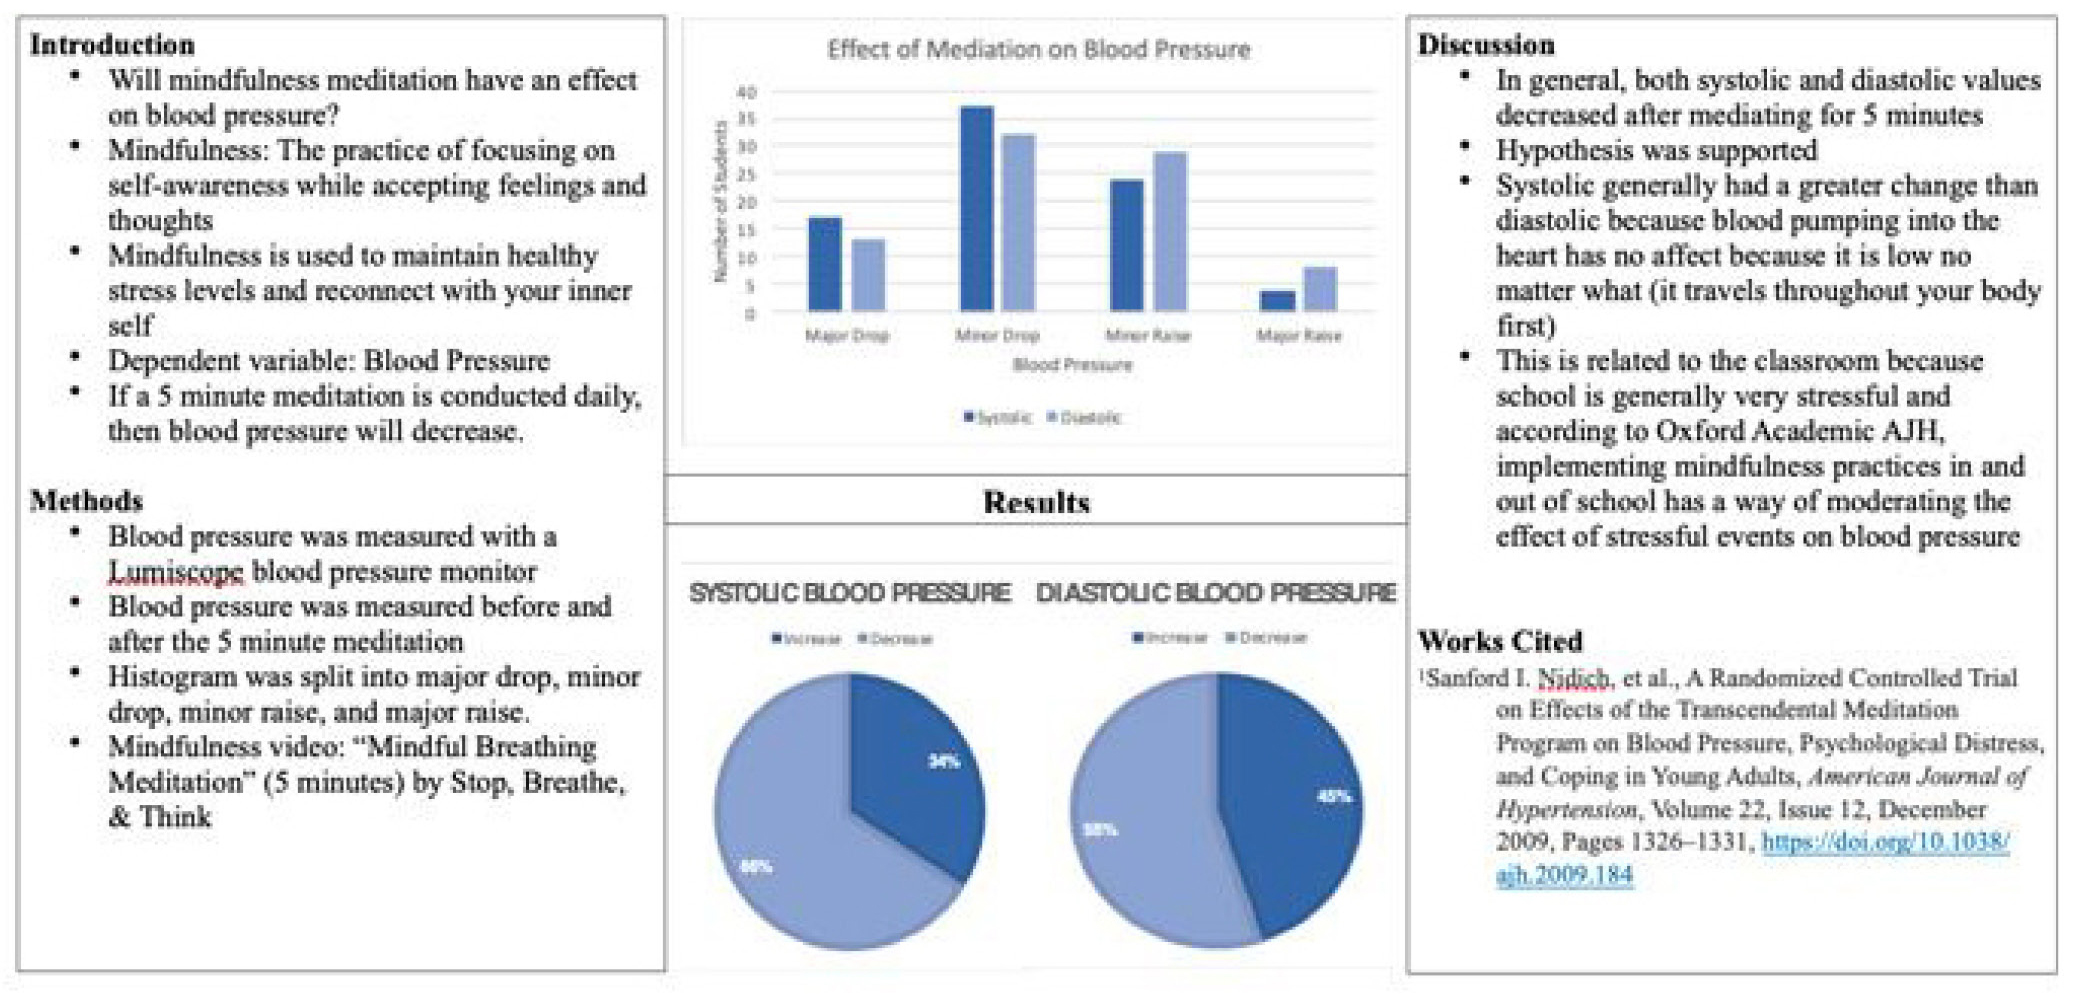
Effect of mindful meditation on blood pressure.
Results
Outcomes
The results of the initial use of this activity are surprising to the students and educators. In nearly 75% of students, respiration rate dropped after the five-minute meditation. Heart rate and systolic blood pressure decreased in 66% of cases. When self-reporting their anxiety index based upon survey scores, 90% of students had a decrease or no change in their anxiety level after meditation. All of the independent variables except for diastolic blood pressure had significant changes in values after the five-minute meditation (p < 0.05; Table 1). The data could also be separated into male and female categories and investigated for differences.
| Table 1. Results of student data and the t-test p-values. All of the results were significantly different except for diastolic blood pressure. | ||||||||||||||||||||||||
|---|---|---|---|---|---|---|---|---|---|---|---|---|---|---|---|---|---|---|---|---|---|---|---|---|
|
The second time that this experiment was conducted yielded similar results, but the data was collected post-pandemic. This yielded changes to the initial anxiety perceived by the students. The average initial anxiety index for the students pre-pandemic was a 7 (out of 12). After the pandemic, the average initial anxiety index was a 9. Both years, students had significant decreases in anxiety (Figure 3).
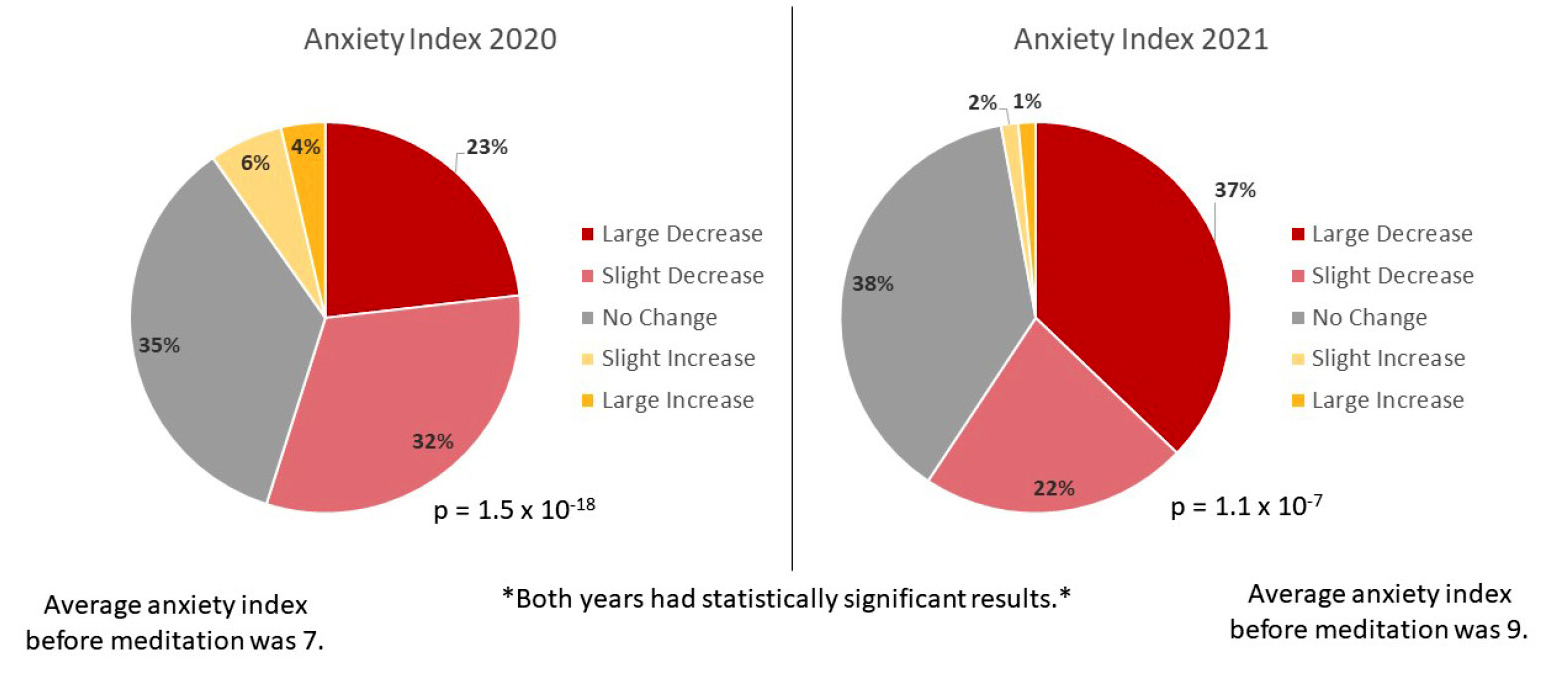
Anxiety index results for 2020 and 2021.
Note: pie charts are organized clockwise in the order of the key starting with ‘large decrease’ (darkest slice).
When making conclusions about the data, students can make connections to the human circulatory and respiratory systems. The educators can ask students why respiration and heart rates drop due to an increased focus on breathing and how this impacts cellular respiration. They can also ask students why systolic blood pressure is impacted by breathing but diastolic blood pressure is not impacted. Students can consider the real-world application of how “resting” blood pressure measurements are impacted by general practices at doctors’ offices. They can discuss whether doctors regularly have patients sit quietly before taking their measurements and if this can impact the results. Anxiety index decreases can be connected to the interconnectivity of systems. A connection can be made on the long-term physiological impacts of mindfulness on a person in regards to lowering their heart rate, respiration rate, blood pressure, and anxiety level.
Discussion
Target student audience
This activity was completed by 11th-grade college preparatory biology students, but could be modified for high school students at any level. The methods are simple and the analyses can be adjusted for difficulty depending on the students. Higher-level classes and students with some experience working with statistics could calculate p values of the data using t-tests and make elaborate charts using Microsoft Excel or another program. In lower-level classes, students can still work with data without running statistics and can plot the data by hand or on a computer. The students that performed this activity used Excel to plot the data but did not run statistics.
For students with ADD or ADHD, mindful meditation can seem like a challenge, but this activity can still be valuable for them as well. Individual students with ADD or ADHD could use a quiet fidget device during meditation. In classes with a large proportion of students with one of these diagnoses, the mindful activity could be altered. They could potentially do mindful coloring instead of meditation. There are many opportunities to adjust this activity to fit the learners.
Educator comments
This investigation was assessed in three sections of college preparatory biology with 37 high school juniors at an independent upper school in Maryland. It was used as a summative laboratory experience while the students learned about the respiratory and circulatory systems. This school has an active mental health club and counselors that often encourage the student body to practice mindfulness, but many of the students still approached this activity with skepticism. As students collected data over three class periods, they were surprised at the variability within their own blood pressure, heart rates, and respiration; some even commented that they noticed an increase in base levels when they were feeling more stress than normal. One male student emailed his instructor stating, “I love the meditations in class because those moments I can forget about school and collect myself.” Some students did not fully engage with meditation, but they did stay quiet and still. Some of these students accounted for the variability in results, but the large sample size helped to reduce the impact of those outliers. Although this activity was time-consuming and required several days to complete, the students gained a new appreciation for mindfulness and its usefulness in an educational setting.
As written, this experiment is structured inquiry. It could be modified to be open inquiry by allowing students to form their own questions regarding the independent variable (such as length of meditation or type of mindfulness activity), the dependent variable (such as cardiovascular efficiency), or the constants (such as age group or time of day). There are many options for students to develop their own questions related to practicing mindfulness from a scientific perspective.
Conclusion
Students are asked to think like scientists to determine the impact that five minutes of mindful meditation have on their bodies and their anxiety levels. Experiential learning allows students to investigate and answer questions using data that they collected and analyzed on their own. This experiment demonstrates the value of mindfulness while emphasizing physiological changes that come with mindful practices. By using the principles of the scientific method to gain a better understanding of the circulatory and respiratory systems, students also gain a greater appreciation for the impact that mindfulness has on them.
Dana Bunnell-Young (dana.bunnell.young@gmail.com) is an assistant professor of biological science at Wor-Wic Community College, Salisbury, MD.
Biology Inquiry Labs Lesson Plans Life Science NGSS STEM Teaching Strategies High School