
Right to the Source
Visualizing U.S. Energy Use and Production 50 Years Ago
The Science Teacher—May/June 2021 (Volume 88, Issue 5)
By Peter Decraene
The energy crisis of the early 1970s, while catalyzed by global political events, shined a spotlight on the United States’ production and consumption of carbon-based fuels. It also contributed to the country’s shifting attitudes about fuel from one of abundance to one of conservation.
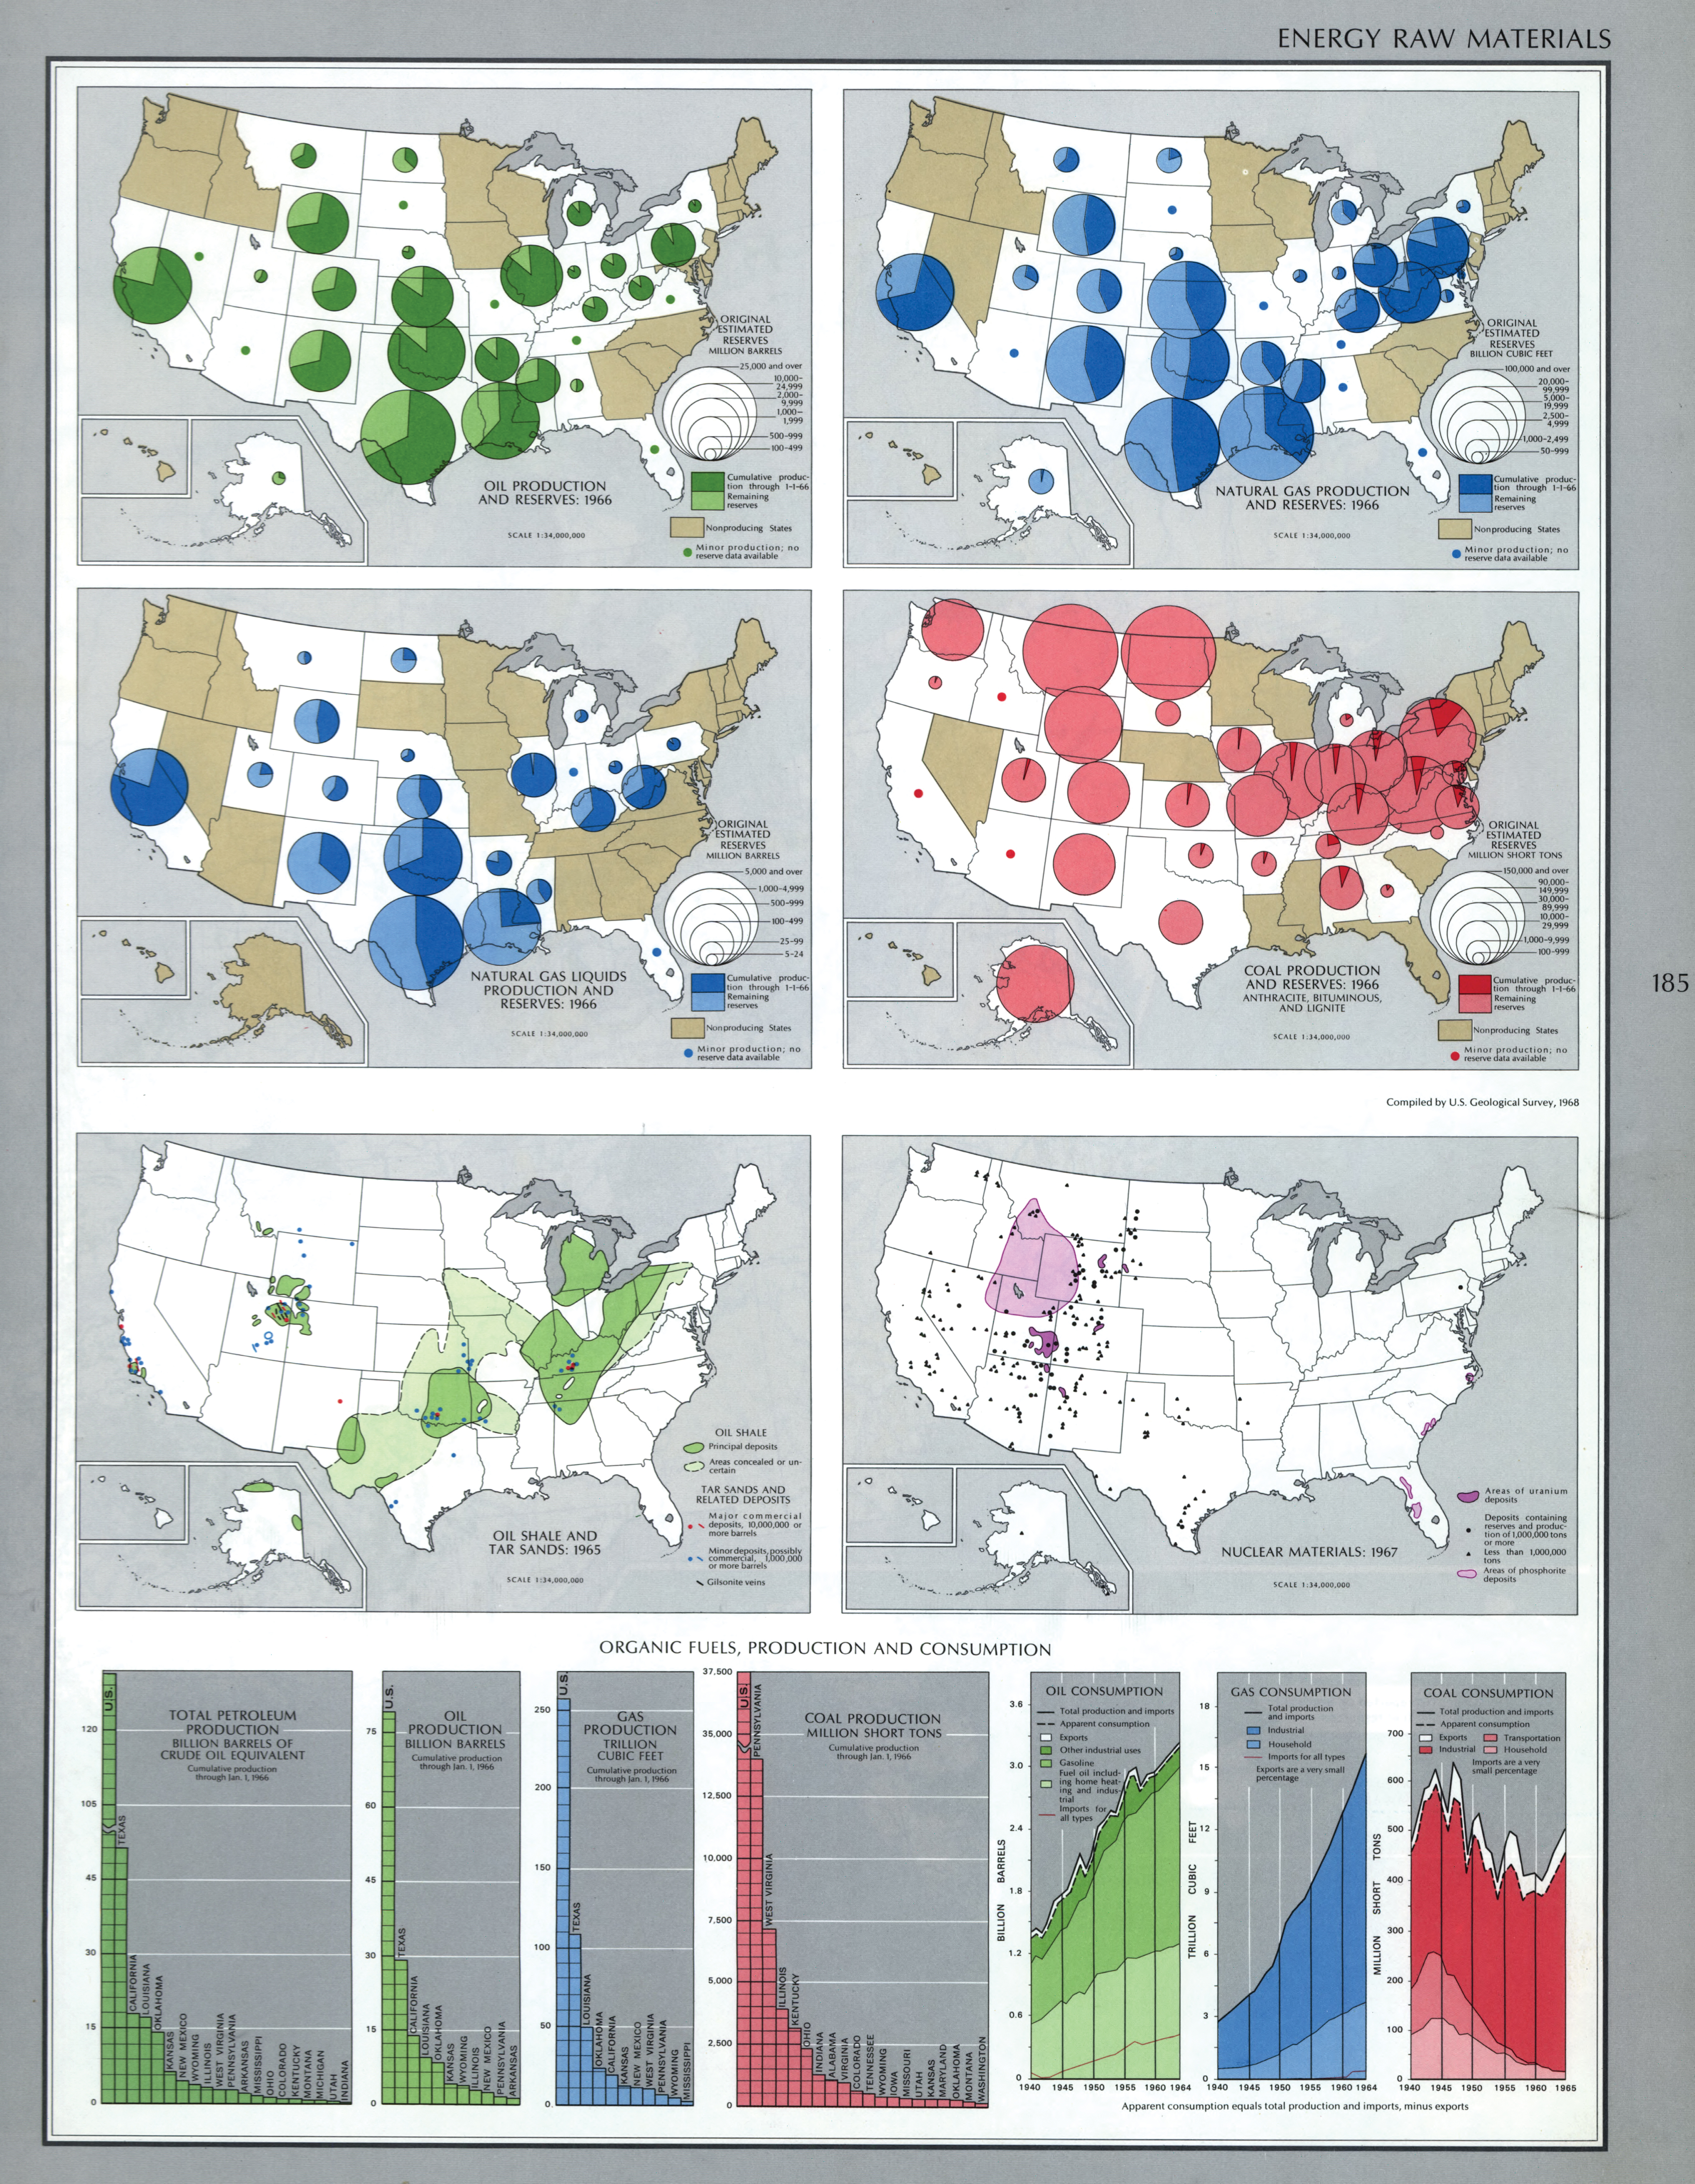
At that time, the U.S. Geological Survey published The 1970 National Atlas of the United States. It was designed to be of practical use to decisionmakers, planners, research scholars, and others in government and business needing to visualize country-wide distributional patterns and relationships between environmental phenomena and human activities. It includes the page featured here, entitled “Energy Raw Materials.” In six maps and six charts, the page illustrates information about America’s energy production and energy reserves including Oil, Natural Gas, Natural Gas Liquids, Coal, Oil Shale, and Nuclear Materials.
Today, these data visualizations can provide students ample opportunity to practice their data and media literacy skills, as well as give some historical perspective to current national and international concerns. Analyzing these maps and charts from 1970 can give students some perspective on the importance of fossil fuels to the United States’ economic and policy decisions. For example, it is very clear from the maps that a half century ago, that states like Texas, Oklahoma, and Louisiana had important roles in oil and natural gas production, and that states like Pennsylvania, Ohio, Kentucky, and West Virginia played important parts in coal and natural gas production. Recognizing this history of energy may help students understand the roles these regions have played in more recent economic and political decisions. Studying the charts at the bottom of the page, students can hone their observation and inference skills around reading information presented graphically. They may also be prompted to research and produce their own data graphics illustrating current use of these or other, renewable, natural resources.
Related Student Explorations
- Energy Independence
- Renewable Natural Resources
- Global Warming
- Climate Change
About the Source
The maps and graphs featured here appear on a single page of The 1970 National Atlas of the United States of America, published by the US Department of the Interior Geological Survey. Information throughout the atlas is generally displayed through descriptive maps and charts rather than raw data. The Atlas contains additional information about energy production and consumption on the four images following the one highlighted here. Other images of interest, that visualize data related to weather, pollution, and water use can be found earlier in the atlas (https://www.loc.gov/resource/g3701gm.gct00013/?sp=2&st=gallery and https://www.loc.gov/resource/g3701gm.gct00013/?sp=3&st=gallery). Information on coal fields in the United States in 1870 can be found in another statistical atlas (https://www.loc.gov/resource/g3701gm.gct00008/?sp=62). The Teacher’s Guide: Analyzing Maps (https://www.loc.gov/programs/teachers/getting-started-with-primary-sources/guides/), developed by the Library of Congress, may be a useful resource in helping students analyze the Atlas. Collectively, and in comparison with contemporary data, these maps and charts can encourage discussions about change over time and the implications of dependency on natural resources.
Peter DeCraene (pdecraene@loc.gov) is the 2020-21 Albert Einstein Distinguished Educator Fellow at the Library of Congress. See www.loc.gov/teachers.
Literacy Teaching Strategies Technology