
Right to the Source
United States statistical atlases
A watershed in data presentation
The Science Teacher—October 2019 (Volume 87, Issue 3)
By Michael Apfeldorf
Exploring science and history with the Library of Congress
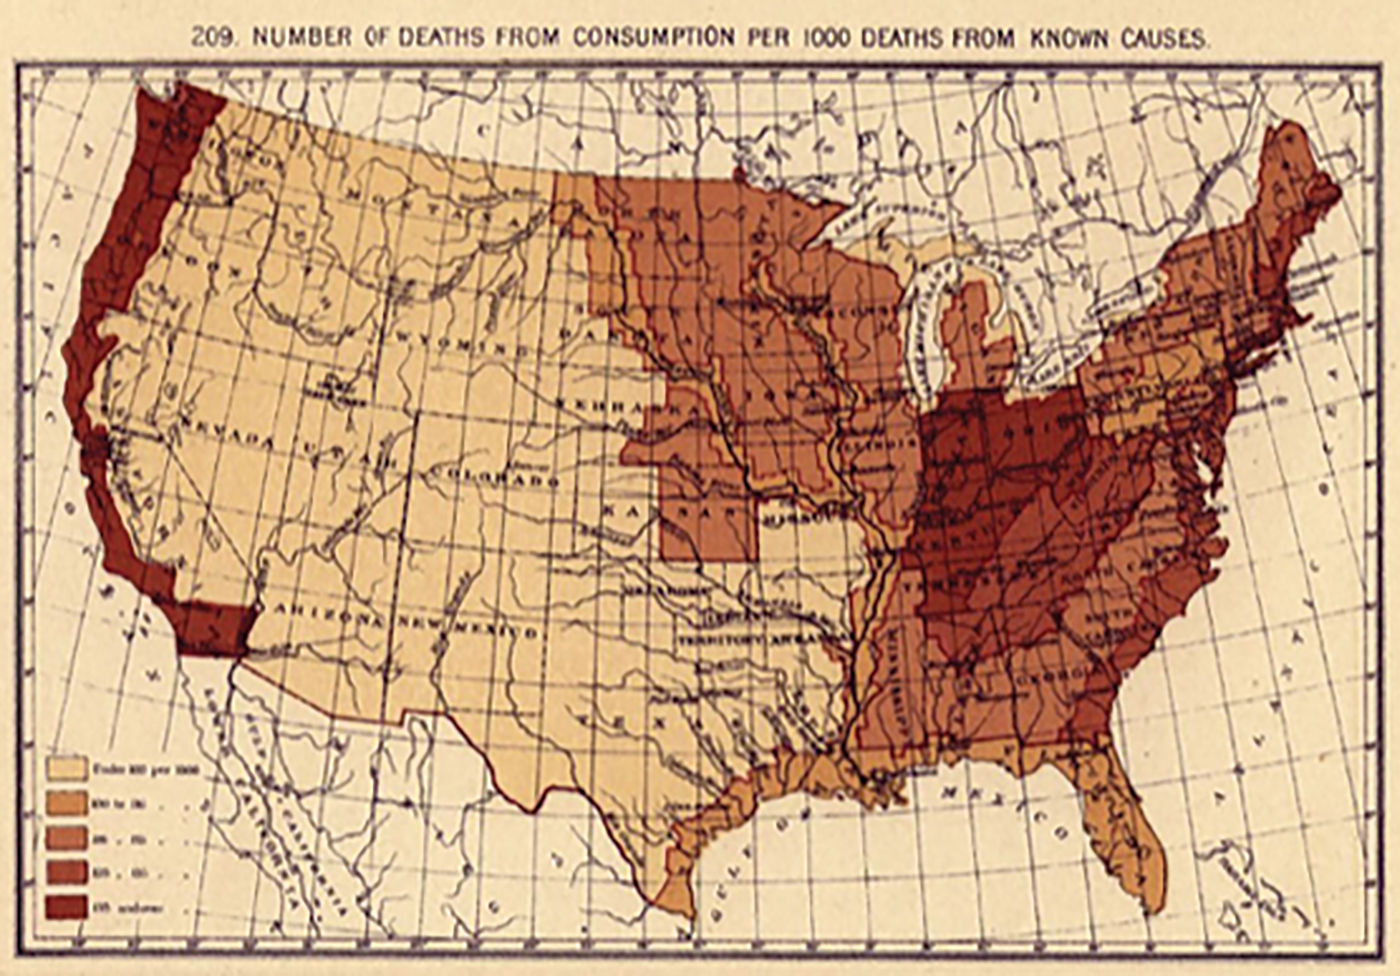
Between 1870 and 1920, the United States Census Bureau produced a series of statistical atlases, representing the country’s first attempts to provide a fully national perspective on its rapidly evolving physical and human geographies. Drawing on data from the federal census and local governments, these national-level data visualizations achieved a level of sophistication not previously seen in the United States. The publications covered a range of topics, including physical geography, population, social, and economic statistics. Some visualizations, such as the map featured in this article, Plate 209 of the 1890 Atlas showing the number of deaths from tuberculosis relative to other causes, shed light on national challenges for which scientists were still seeking answers.
While the authors were careful to point out that the data was incomplete due to known areas and groups under-reporting, they nevertheless attempted to put it into perspective: “the greatest mortality rate occurs on the Pacific coast and in the eastern part of the upper Mississippi Valley,” while “the region bearing upon the Great Lakes, the entire Rocky Mountain Region, and the region of the southern plains and prairies are largely exempt.”
Related visualizations presented disease mortality rates on the basis of gender, age, ethnicity, place (city vs. rural), and time of year. Invite students to explore these visualizations, and ask them to reflect: What do such data collection efforts illustrate about U. S. society and its interests in the late 19th century? How might such data visualizations have assisted scientists, government officials, or others charged with responding to the nation’s health care needs? And in what other ways has data visualization assisted scientists and others throughout U.S. history and today?
Credit: Library of Congress
The “Statistical atlas of the United States, based upon the results of the eleventh census” is available free online in its entirety from the Library of Congress at: www.loc.gov/item/07019233/; diagram 209, the map featured here is on page 79 and available at: www.loc.gov/resource/g3701gm.gct00010/?sp=79. A search on the term “Statistical Atlas” from www.loc.gov yields many related resources, including other atlases and maps that contain embedded statistics. Meanwhile, for additional resources on how scientists have historically collected and presented data generally, visit the “Scientific Data: Observing, Recording, and Communicating Information” primary source set at: www.loc.gov/teachers/classroommaterials/primarysourcesets/scientific-data/. Finally, the Census Bureau provides contextual information about the atlases, and complete PDFs of them at: www.census.gov/history/www/programs/geography/statistical_atlases.html.
Secondary Source Research Links:
www.census.gov/history/www/programs/geography/statistical_atlases.html
Related Student Explorations
- Statistical Atlas
- Census
- Tuberculosis
Instructional Materials Literacy