
feature
A Layered Approach to Scientific Models
Creating scaffolds that allow all students to show more of what they know
The Science Teacher—September/October 2020 (Volume 88, Issue 1)
By Kelsie Fowler, Mark Windschitl, and Claus Auning

Each year, an increasing number of science teachers integrate modeling into their instructional repertoires, and in the process, they see how this disciplinary practice helps students reason and revise their thinking about complex events in the natural world. The NGSS Science and Engineering Practice of developing and using models is intended to serve as a sense-making process that helps students predict and explain phenomenon, makes their thinking visible as well as shareable in the classroom, and allows them to monitor their own progress toward deep understanding of a set of ideas. Research confirms numerous positive effects on student learning through modeling and its companion practice, explanation (Passmore, Schwarz, and Mankowski 2017).
Although there are many types of models used in science—graphs, equations, computer simulations, physical replicas, charts, etc.—pictorial models are unique in that they require students to create their own images to explain what is happening and why (Windschitl, Thompson, and Braaten 2018). Pictorial models have, at their core, a sketch that bears a resemblance to things or actions in the real world. These might be silhouettes of a human body fighting a bacterial infection, or a cutaway view of a car engine as combustion takes place. Teachers who are experimenting with modeling in their classrooms have students create initial, revised, and final versions over the course of a unit, and ask them to show what is observable and unobservable.
This is an important rule of thumb—the unobservable always explains the observable in science. For example, bacteria dividing under optimum conditions in the gut will explain why a person suddenly feels ill. Similarly, bond making and breaking will help explain why hydrocarbons and oxygen in a piston combine, with a little help from a spark, to produce an explosion as well as by-products that are different from the reactants.
These modeling strategies are part of a larger framework for instruction, known as Ambitious Science Teaching (Windschitl, Thompson, and Braaten 2018). Within this framework, teachers modify units to feature complex and compelling phenomena for which students develop and revise explanatory models over time. Central to this work are regular opportunities for equitable sensemaking talk as well as ongoing formative assessments that allow teachers to adapt learning experiences to students’ needs.
Because so many teachers are now making their students’ models public on social media, in journal articles, and at professional conferences, we can see remarkable variation in how this science practice is scaffolded in classrooms. By scaffolding we mean the teacher providing some structure to the process, such as giving students a partially pre-drawn template or using written prompts to remind them what is expected in their models and explanations. Some teachers give their students just a blank page, while others include more than a dozen types of questions or prompts. Either of these extremes can leave students feeling frustrated, but what types of scaffolding will allow young learners to show the most of what they know? And, can students make their own choices about how to represent their ideas and explanations to others?
In this article we outline a three-layer approach to designing model templates that support students’ efforts to draw and explain. We start with suggestions for how to phrase the essential questions students are responding to so that the purpose of their modeling is more focused and explicit. Then we explore different types of base pictorial layouts that become the foundational layer for the models. Finally, we provide a range of “explanatory elements” that teachers or students can integrate in their models to communicate a more robust explanation.
Importantly, we provide recommendations for how to scaffold the modeling experience so that students can eventually become more independent in selecting their own modeling tools or creating their own base pictorial layouts to show their unique thinking. The approach and model template examples we feature in this article are primarily used during students’ final modeling experience, not the initial modeling—a necessary distinction that clarifies the level of rigor expected in a final product and the amount of scaffolding provided by the teacher.
Having worked with hundreds of teachers and thousands of students using a wide variety of model templates, our objective is to share some of our insights in hopes it will support teachers’ efforts to design templates and, in turn, support your students’ reasoning and modeling skills.
A layered approach to designing model templates
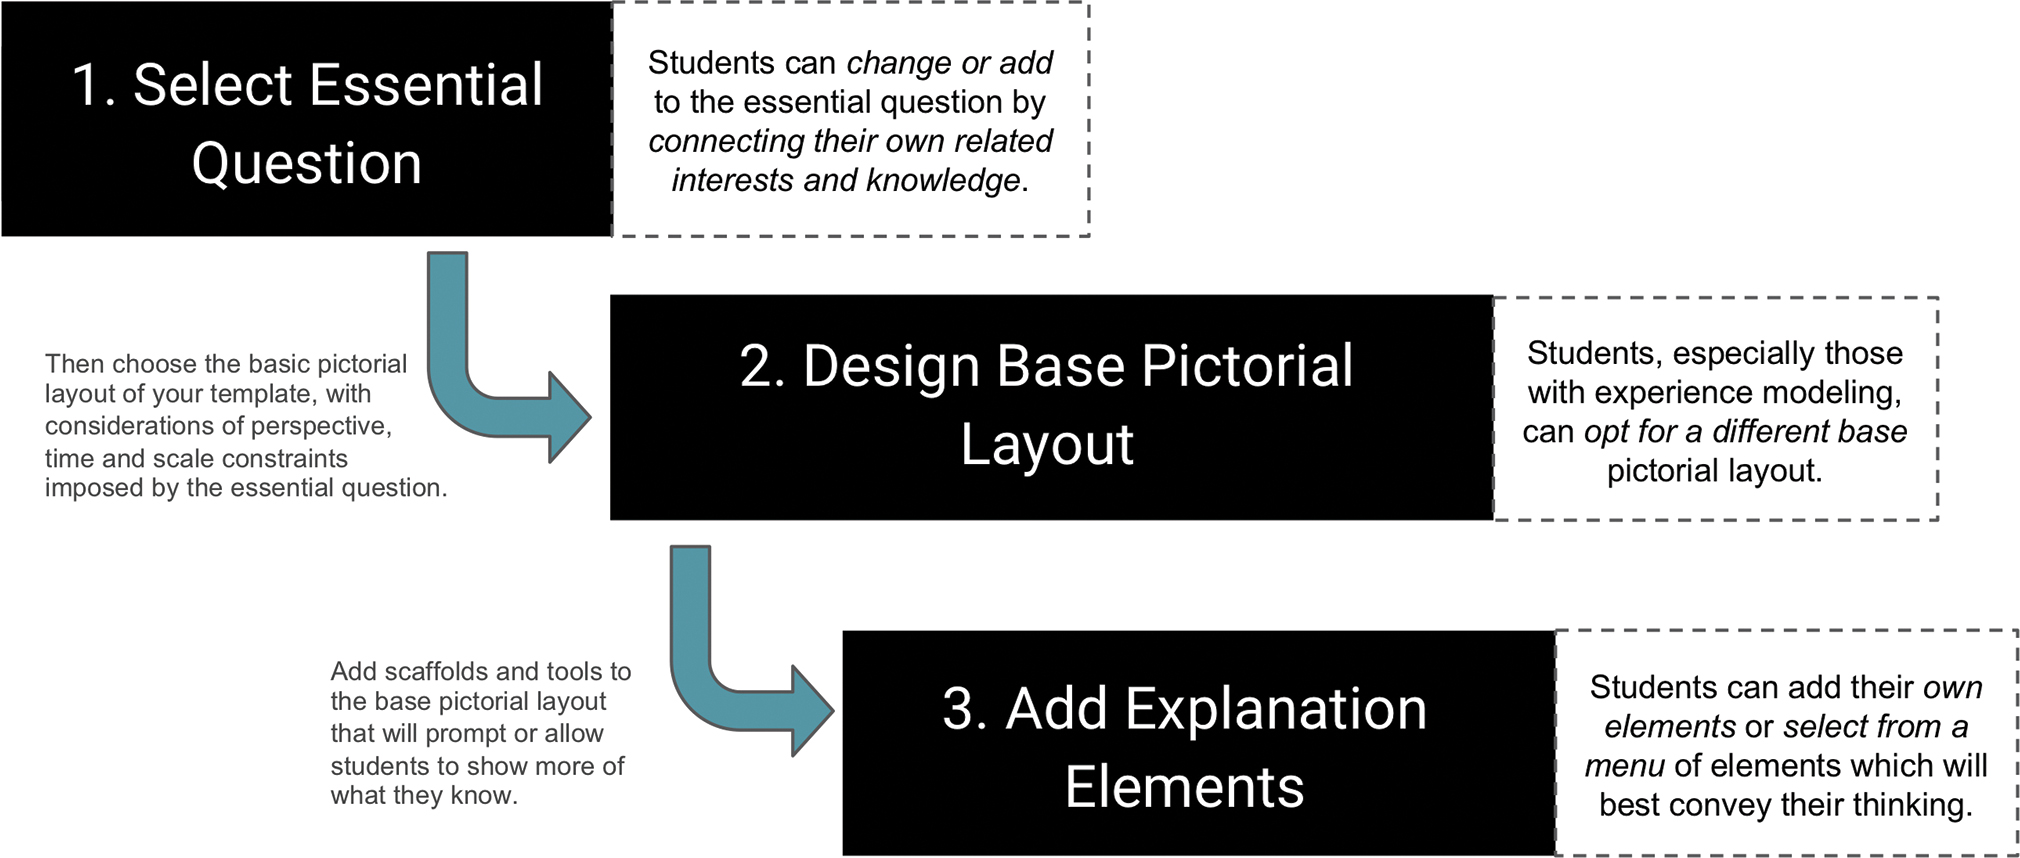
Teachers often find that creating new model templates is not a linear process. They jump between ideas related to the phenomenon itself and puzzle about what kinds of representations to put on their model templates without doing all the work for students. Although this method can work for teachers who are experienced with modeling, it can be overwhelming for most educators to identify a place to start and a pathway forward. A design process is needed. In Figure 1, we present a sequence of three layers to be considered while designing model templates. Each is independent of the others and each requires unique choices about how to support students’ work.
Creating models following a layered approach.
Before detailing this approach, we want to highlight the dotted boxes adjacent to each layer, indicating ways students can play central roles in modifying the model design and selecting some of their own supports. Later, we advocate for positioning students to be more involved in structuring how they will show what they know. For now, we simply want to note that good teachers do not use templates to constrain or funnel ideas but as a way to equitably support all students in scientific reasoning.
Layer 1: The essential question
To begin developing the model template, you must already have selected or generated a phenomenon to anchor the unit’s lessons and for which students will eventually generate a full causal explanation—an explanation that requires the integration of a wide range of science ideas and sources of evidence. Based on the puzzling phenomenon, we suggest determining an overarching “essential question” (or “driving question”). Defining the essential question will help guide the explanatory work students are expected to do throughout the unit. This question will establish the content boundaries needed for designing the rest of the template as well as a coherent sequence of lessons.
This first step is fundamental because descriptions of nearly every phenomenon can be reworded, tweaked or extended in diverse ways, but it is the essential question that determines the remaining layers in the template. Three examples of essential questions that you will see featured in upcoming sections of this article include: “Why does one woman continue the marathon on a warm day, while under the same conditions, another woman gets heat stroke?” and “How can we sometimes see the Northern Lights in Seattle?” and “How can the reintroduction of so few wolves change the Yellowstone ecosystem so much?”
Once fixed, the essential question should be written clearly in large, bolded, student-friendly (non-technical) terms, with grade-appropriate language demands at the top of the template to help focus learner thinking. This being said, we want to make clear that students’ interests often warrant additional questions to be pursued during the unit. We share more examples of essential questions below, as they relate to different kinds of models.
Layer 2: Base pictorial layouts
After the demands for students’ intellectual work are bounded by the essential question, a second layer must be added—a base pictorial layout. These are the visual outlines of objects related to the puzzling phenomenon that you don’t want students to spend their time trying to draw. Base pictorial layouts are minimalist structures to help represent the phenomenon, but they also structure (i.e., scaffold) the kind of explanatory story that students construct. Objects should be clearly labeled and not left ambiguously shorthanded for students to decipher. And teachers must be creative about representing things like scale in the layout or the passage of time. They even have to pay attention to the white space left available for students to draw their thoughts into.
As always, we recommend templates be put on 11 × 17” paper—we’ve found that smaller dimension formats constrain and frustrate students. Next we outline three types of base pictorial layouts followed by general considerations when designing this part of the template.
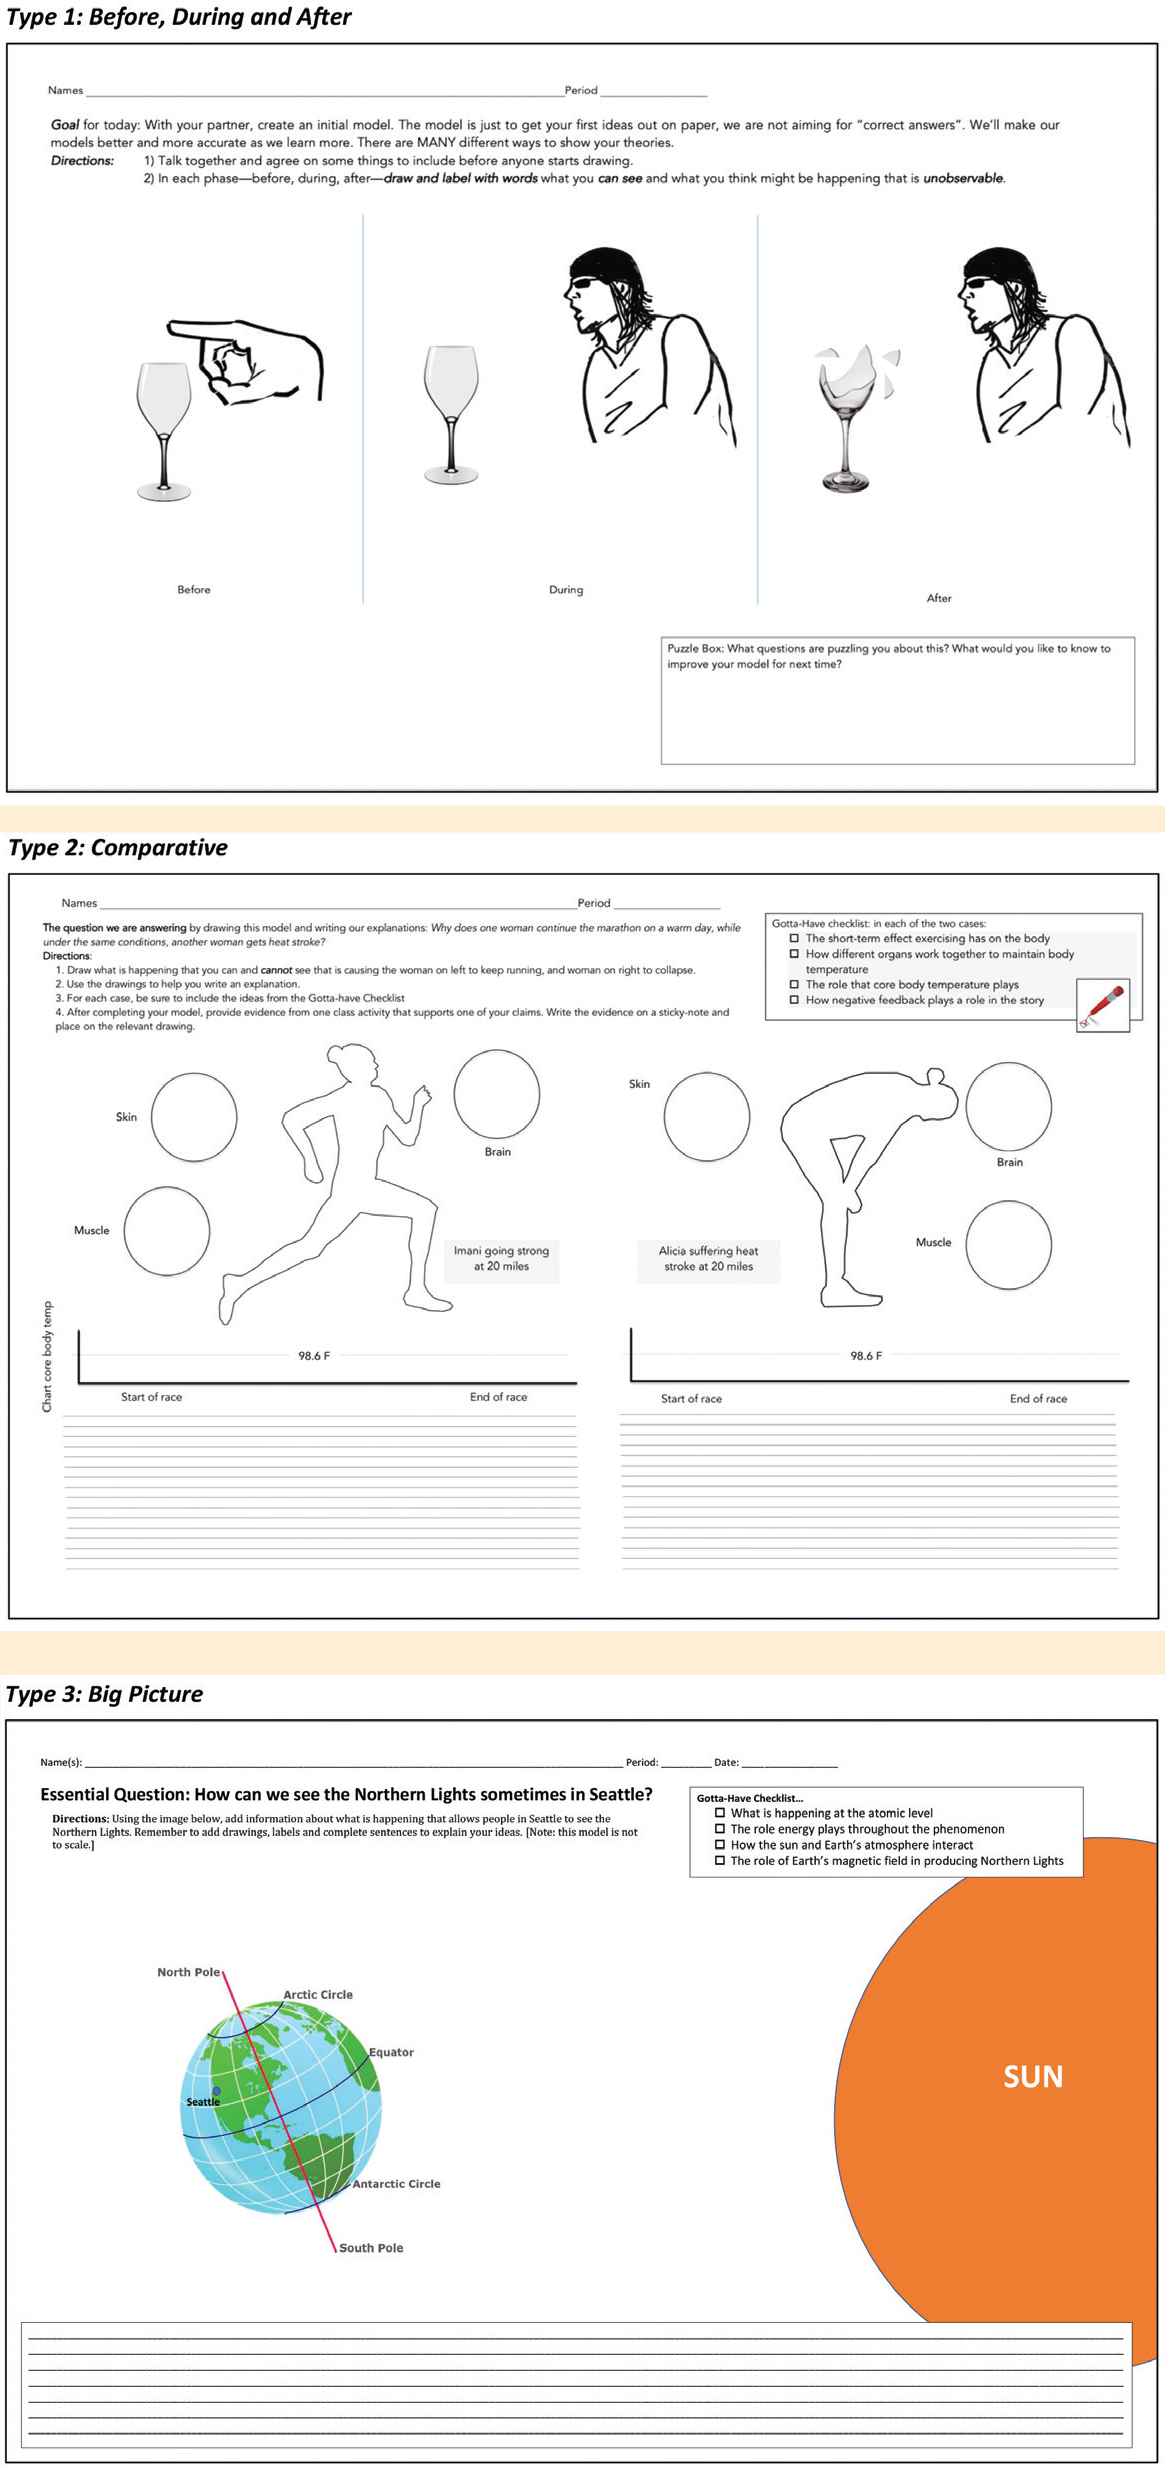
Type 1: Before, during and after
By definition, all phenomena occur over time. However, this first type of layout divides the template into three panels, in which students are prompted to focus on explaining an event or process before it begins, as it unfolds, and after it has ended. Essential questions associated with this type of layout are most frequently written in the format of: “What is happening during these different stages to _________?”;“How does ___ change over time?”; “Why did ____ happen?”; “Why did ____ stop happening?”; or “Why did _____ happen in an unexpected way?”
These layouts often include labels for each section indicating time increments (e.g. “100 years ago”, “after the eruption” or “in 2070”). In the sound example (Figure 2A), a singer pings a glass to hear its tone. He then vocalizes a matching note that, in a few moments vibrates and shatters the glass. This three-part layout supports students’ sequential reasoning and pushes them to consider what initially happened at the unobservable level during the “ping” and as the singer processed that sound. This is worth explaining in and of itself because it involves ideas about vibration and frequency, as well as energy moving in waves back to the singer’s ear and eventually becoming the matching sound waves that, through resonance, shatters the glass.
Three primary types of base pictorial layouts.
Type 2: Comparative
This layout divides the paper into side-by-side panels for a direct contrast between cases representing a phenomenon that can occur in different ways or can cause different effects depending on the situation. Common question formats for this type of base pictorial layout include: “How does _____ compare with ______?”; “If ____ happens in this case, why not in the other?”; or “Why were _____ and _____ affected by ____ differently?”
In Figure 2B the comparison between two female marathon runners, Imani and Alicia, provides a good example of how this layout emphasizes differences between two homeostatic conditions. The phenomenon explores how internal body mechanisms help Imani continue running a race, while Alicia succumbs to heat stroke. The teacher provides much of the context through descriptors in the essential question like “warm day” and distinct images of the two women. Also, below each runner this teacher prompts students to show their initial reasoning by graphing each woman’s core body temperature throughout the race—a move done to help acclimate the student with the phenomenon and more quickly push students into considering the unobservable factors of this story.
Many teachers make the mistake of not providing enough context in this layout, which prevents students from reasoning at a deeper (unobservable) level because their time is spent adding obvious observable details like sweating, rather than thinking more deeply about why there are differences in the cases.
Type 3: Big picture
Unlike the first two types of base pictorial layouts, this format is simply a single image with significant white space, surrounding it or within the image, for students to add ideas about what is happening. This layout naturally lends itself to larger scale engineering, earth and space, physics, weather phenomena, or other topics where students must model a single event or system in detail. Essential questions used with this type of layout may take the form of: “What is a solution to _____?”; “What is happening here?”; “How does _____ work?”; or “Why can _____ occur?”
For example, in the third image of Figure 2C, students are clearly prompted to consider how the Sun and the Earth might interact to create Northern Lights that are observable from Seattle. Note that while the base pictorial layout is not to scale, there is significant open white space for students to represent magnetic fields, atmospheric layers, solar flares, or make connections to other potential factors creating the Aurora Borealis. This openness works well for phenomena that cannot be easily divided into meaningful before-during-after segments or are not comparative in nature.
We have learned that the science topic matters when designing the base pictorial layout. For instance, when creating a model template for chemistry there is usually a reaction of some kind occurring, or some other unobservable process that is most easily understood through a before-during-after layout. In contrast, biology phenomena often require students to model nested systems at different scales (cells, tissues, organs, organisms, populations, etc.), using probabilistic reasoning, meaning the consideration of multiple causes and multiple effects, rather than one cause or one effect. Ecosystems and natural selection are good examples. These phenomena are often better modeled using comparative or big picture layouts.
On the other hand, Earth and space, or engineering topics frequently require students to model using sophisticated spatial reasoning or to depict changes over long periods of time, which can best be supported through big picture layouts or a combination of big picture frames from varying perspectives (e.g., cross-section and bird’s eye view, as discussed in the next section). One of the many tricky, but also forgiving, aspects of creating model templates is recognizing that the best way to represent a phenomenon may occur through combining two different layouts to create a hybrid template.
Layer 3: Explanation elements within the template
The final step in creating model templates is to add “explanation elements” to support students in showing the full depth of their knowledge and perhaps push their scientific reasoning in new directions. Some elements are supports that appear the same regardless of the phenomenon, essential question, or base pictorial layout. Examples include: Gotta-have checklists for which ideas must be included, lines and spaces for students’ written explanations, prompting questions, or keys to indicate agreed-upon modeling conventions (like how to use arrows to represent force and direction). While these are important elements for supporting student thinking, there are also elements that can be layered onto the model template that visually support sense-making and offer learners options to show what they feel is important to their explanatory story.
Unlike the scaffolds mentioned above, these elements should vary based on the phenomenon and students’ modeling experiences. Table 1 provides examples of explanatory elements that could be layered onto a template depending on what students are being asked to show. Some of these are organizational in nature, while others elicit different types of reasoning that would otherwise go unsupported. For example, if the teacher who created the homeostasis model template in Figure 2 expected his students to reason about gas exchange, thermoregulation or maintaining water balance in the skin, muscles, and brain but did not prompt for this knowledge through the circle zoom-ins, how would students know to provide these kinds of ideas? And if these ideas went unprompted how would the teacher know if his students truly didn’t consider these factors or their effects?
| Table 1. Examples of modeling elements and their affordances. | ||||||||||||||||
|---|---|---|---|---|---|---|---|---|---|---|---|---|---|---|---|---|
|
Model template elements clarify expectations and stimulate students to consider certain relationships and details they may otherwise think are unimportant. Layering on a selected few of these elements works to give all learners equitable opportunities to show their thinking. And, if you really want to forecast what kind of elements your students might need, draw the full explanatory model and write the causal explanation for yourself—you’ll be better able to understand which of these various supports would be most helpful for learners, even though their models and explanations will be unique.
Although Table 1 outlines the affordances of these various elements, to best understand the impact of adding scaffolds to model templates we turn to a student example (Figure 3). This model template plainly centers on the essential question “How can energy from an ocean wave power our life?” and uses a big picture base pictorial layout. By layering on elements such as zoom-ins and zoom-outs, the teacher prompted this student to show his sophisticated ideas about magnetism, generators, the flow of electricity, and even components of an ocean wave.
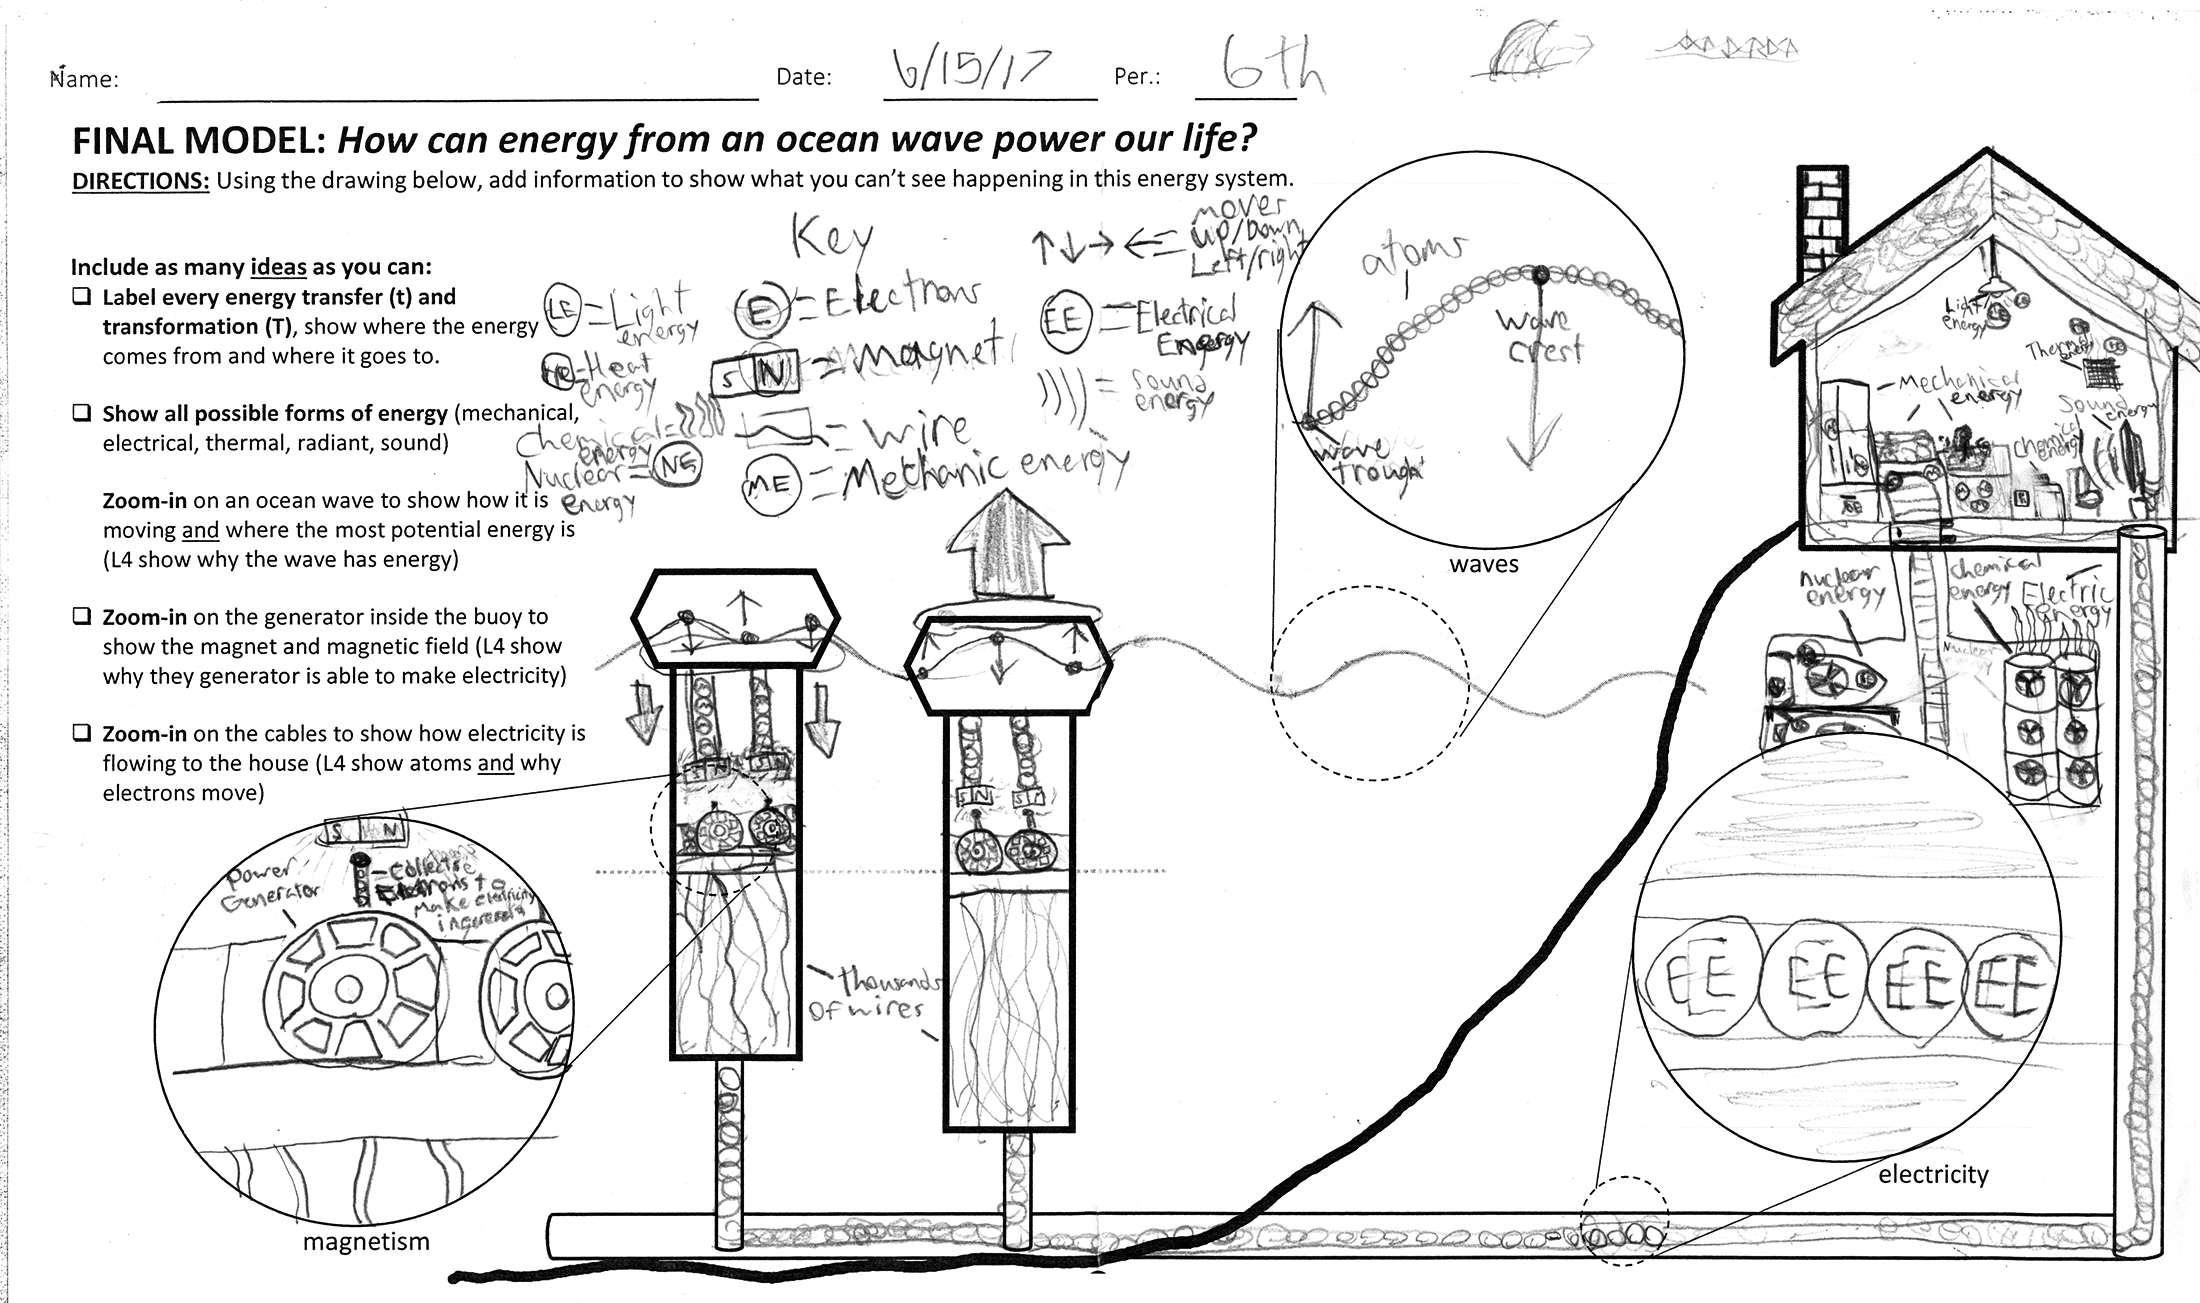
Big picture layout with elements and student work.
This model sample originates from a student with an IEP, who his teachers identified as someone who typically struggles to engage in science topics and to show understanding, but who also enjoys learning about mechanical processes. Because these scale/spatial orientation elements were provided, this student was able to show his understanding of how the motion of a wave could generate electric energy (“EE”) and in a basic sense, he was empowered to include his own interests and mechanical understandings.
Another example of a model template from Advanced Placement Chemistry includes all three layers (the essential question, base pictorial layout, and explanatory elements) as shown in Figure 4. In the directions we see the essential question (written as a statement) and three central images from a calorimeter lab as part of a before-during-after pictorial layout. At first glance, it appears that the creator of this template did not use modeling elements to prompt students to show more of their thinking.
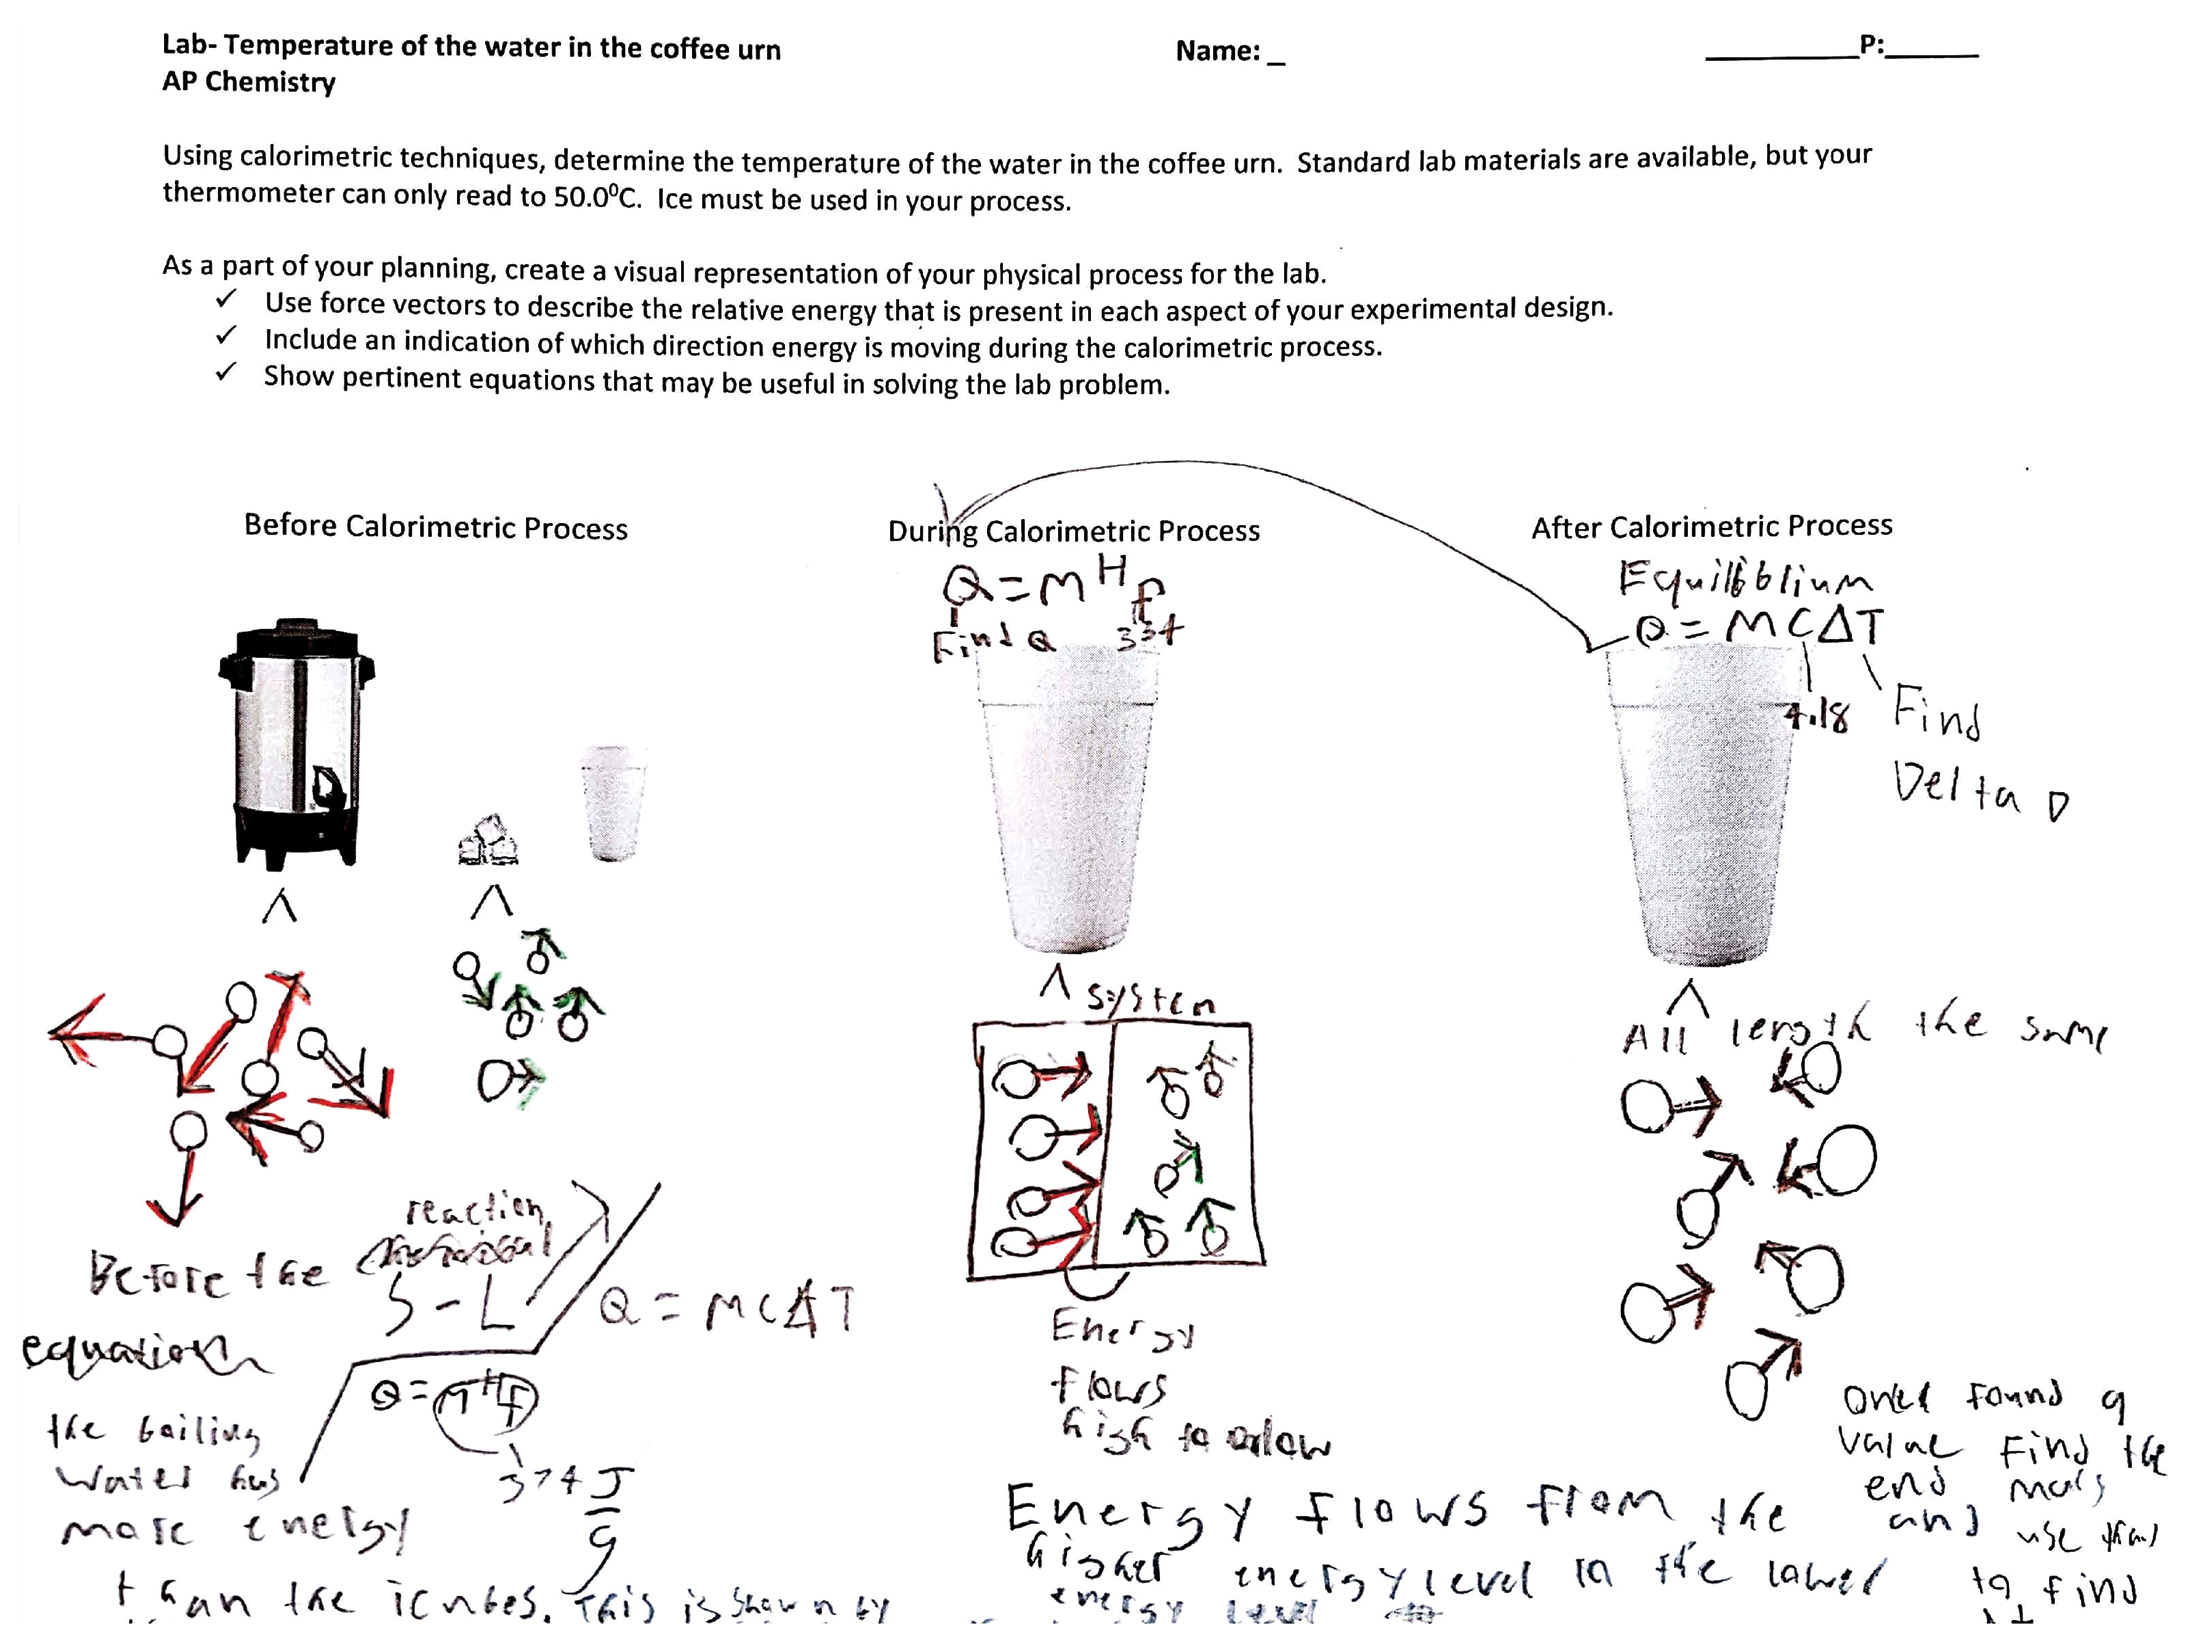
Before, during and after layout with tools and student work.
However, after looking more closely at the expectations outlined in the directions and across a class set of finished models, it became clear to us that the teacher requested students to include at least two explanation elements: scale/spatial orientations and mathematical representations. We see evidence of this in the students’ addition of zoom-ins under each given image, the use of a specific heat capacity equation (Q = mc∆T), the phase change graph in the before panel and modeling of molecular motion by varying vector lengths and direction.
A word of caution about explanatory elements: they must be selected thoughtfully by either the teacher or the student so that they support the telling of a coherent explanatory narrative about the phenomenon. Arbitrarily chosen elements, or too many, can make it difficult for students to articulate a clear story of what is occurring. You don’t want a collage of tacked-on ideas.
Avoiding “worksheety” model templates
Although Figures 3 and 4 illustrate the importance of adding all three layers to the model template, one of the most significant stumbling blocks to creating templates is providing too many modeling prompts. Students can feel that they are being funneled toward “right answers” that don’t connect to one another or that add up to an explanatory storyline for a phenomenon. In our work with teachers, we have noted that the more elements and question prompts placed by a teacher in a template, the more likely it is that different students end up drawing and labeling the exact same things, but without knowing why.
Another way to think about this tension is to consider the ways in which helpful scaffolds and elements can quickly constrain student thinking into rote textbook answers. In Figure 5 we present an example of this in a template that we would describe as “worksheety.” This template is more detailed but, paradoxically, less cognitively demanding than other examples. It requires mostly recall of facts and procedures and leaves little space for students to personally make sense of the phenomenon, sometimes to the point that the phenomenon’s possible storyline is obscured. In cases like this, students are not engaged in modeling but in reporting or reproducing what has already been learned or can be looked up. Red flags for determining if a model template has morphed into a worksheet include:
- phenomenon that can only be depicted in one way, or there is no evident anchoring phenomenon
- funneling students sequentially through the “correct explanation” of a phenomenon by dropping too many breadcrumbs (mini-questions and scenarios) for students to respond to
- questions embedded in each section reflect low cognitive demand
- not enough white space for students to show what they know
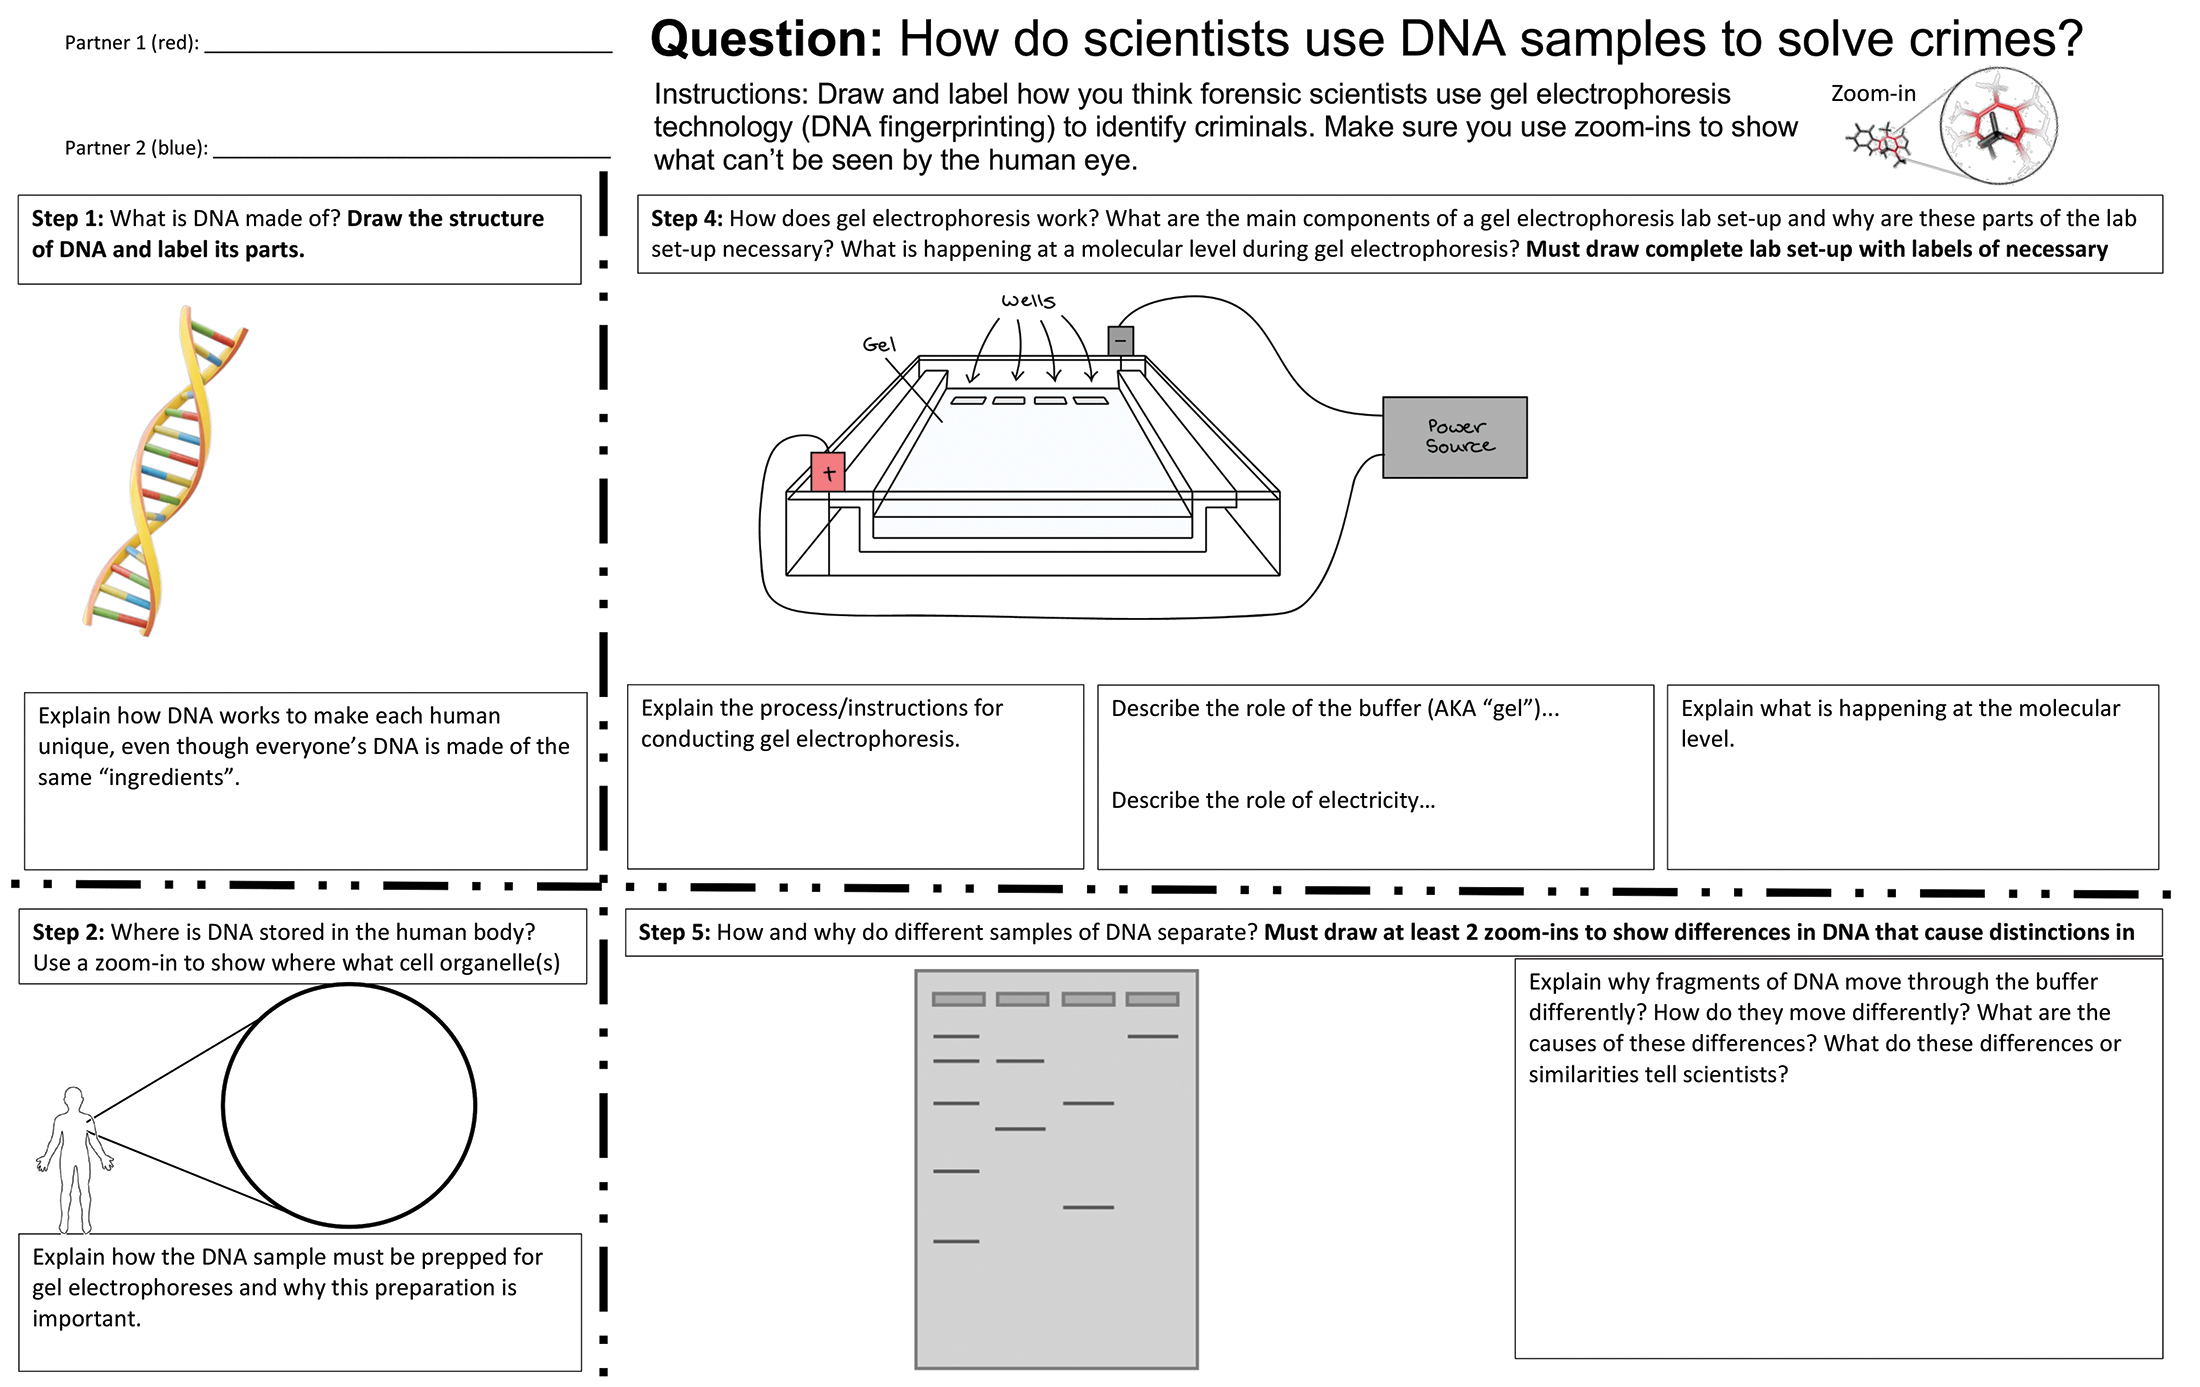
Example of a “worksheety” model template.
Setting the stage for student-driven modeling choices
Recently, there has been an increase of educators providing students with only a blank sheet of paper because this openness avoids “worksheety” templates and is thought to give students more freedom to demonstrate their unique ideas. While some students may thrive with this kind of self-direction, this is not the case for many learners who can become confused and frustrated by the unclear expectations and open nature of the task.
It is important that, as we use modeling in our classrooms, we do not leap to using blank templates. This approach can be inequitable. It can marginalize students who are not skilled at representing their scientific or everyday knowledge visually. This can also disadvantage newcomer students who are unfamiliar with the way modeling might be done in your classroom, students with IEPs around organizing information and writing, and learners who do not self-identify as artistic. Having too few supports prevents these students from showing all they know (like the student of Figure 3).
To remedy this tension, in this section we share examples from teachers who have developed unique tactics for scaffolding the modeling process over the course of a school year to support students in selecting their own modeling elements, to the point of eventually creating their own unique base pictorial layouts.
During the course of a school year, the layers of the template (especially the teacher-provided modeling elements) can gradually be withdrawn as students do more modeling and are empowered to take more initiative in this scientific practice. To do this, teachers should begin the year with model templates that incorporate all three layers (puzzling event + essential question, base pictorial layer, explanation elements). Over the next few months as opportunities arise, teachers can show students how and when to use different explanatory elements to represent their ideas or generate new ways of reasoning about the phenomenon.
Students will gradually begin to recognize when specific explanatory elements can help them reason or better explain their thinking to an audience. Figure 6 provides an example of a student who was working with a photosynthesis and cellular respiration template featuring all three layers. She decided to find other sheets of paper to add ideas to, cut them out and taped them onto her template. These became extra zoom-in and choice boxes, which added space for ideas that the student felt were important.
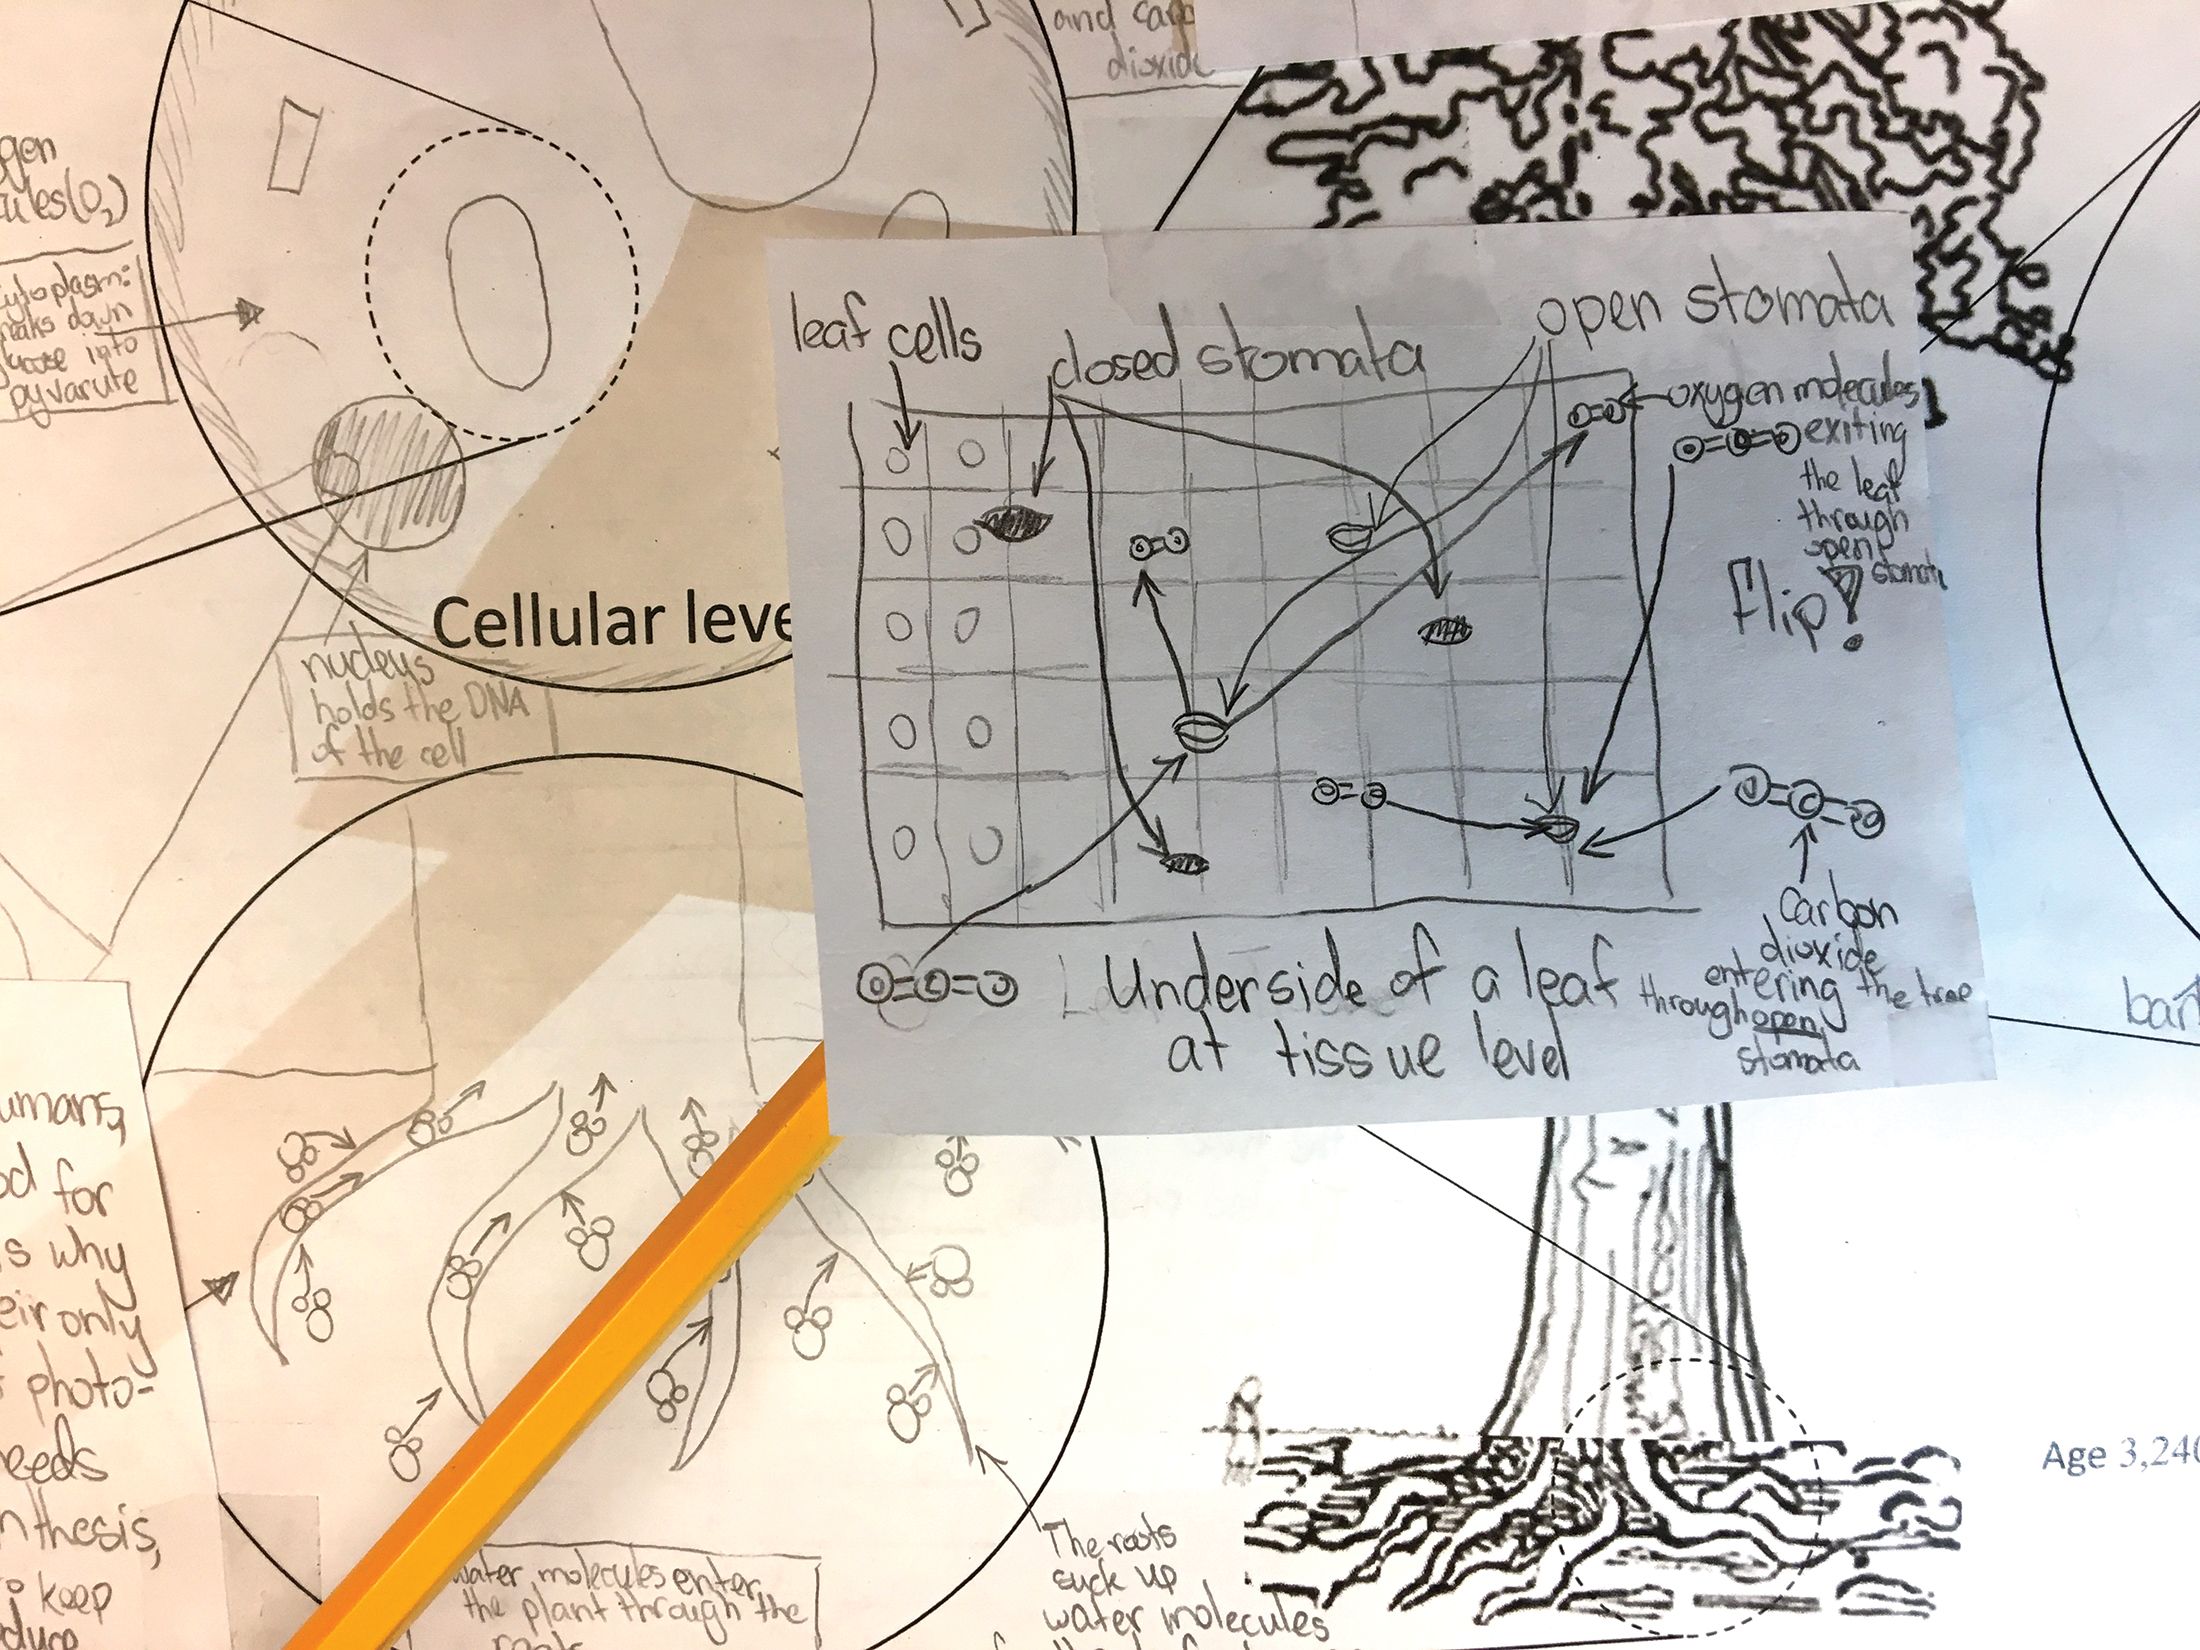
Big-picture layout with elements and student work.
Modifying the template like this is a common first step in students taking ownership of their own models, and represents a natural progression in the practice of scientific modeling that teachers should encourage. In hindsight, it would have been easy to predict this student’s addition of modeling elements because her prior final models demonstrated significant growth in her modeling skills, surpassing the teachers’ expectations for students’ final models in the prior unit.
One way teachers have empowered students to self-select explanatory elements is by requiring them to start with a simplified template that includes only an essential question and a base pictorial layout. Then they post a visual menu of different types of explanatory elements for students to select from and individually add to their models.
Another approach to increasing students’ modeling responsibilities is to make nuanced changes to the base pictorial layout, based on students’ prior knowledge, modeling experience, individual learner needs, and their expression preferences. Some students with significant modeling experience are capable of designing effective base pictorial layouts themselves (see Figures 7, 8 and 9); teachers with experience supporting modeling know that most students will still need some boundaries to show the most of what they know. With this in mind, they provide students with the essential question and a list of required explanatory elements that should be used.
Comparative layout with tools and student work.
Rock formation and location example.
Two student-created base pictorial layouts and explanatory elements from the same class.
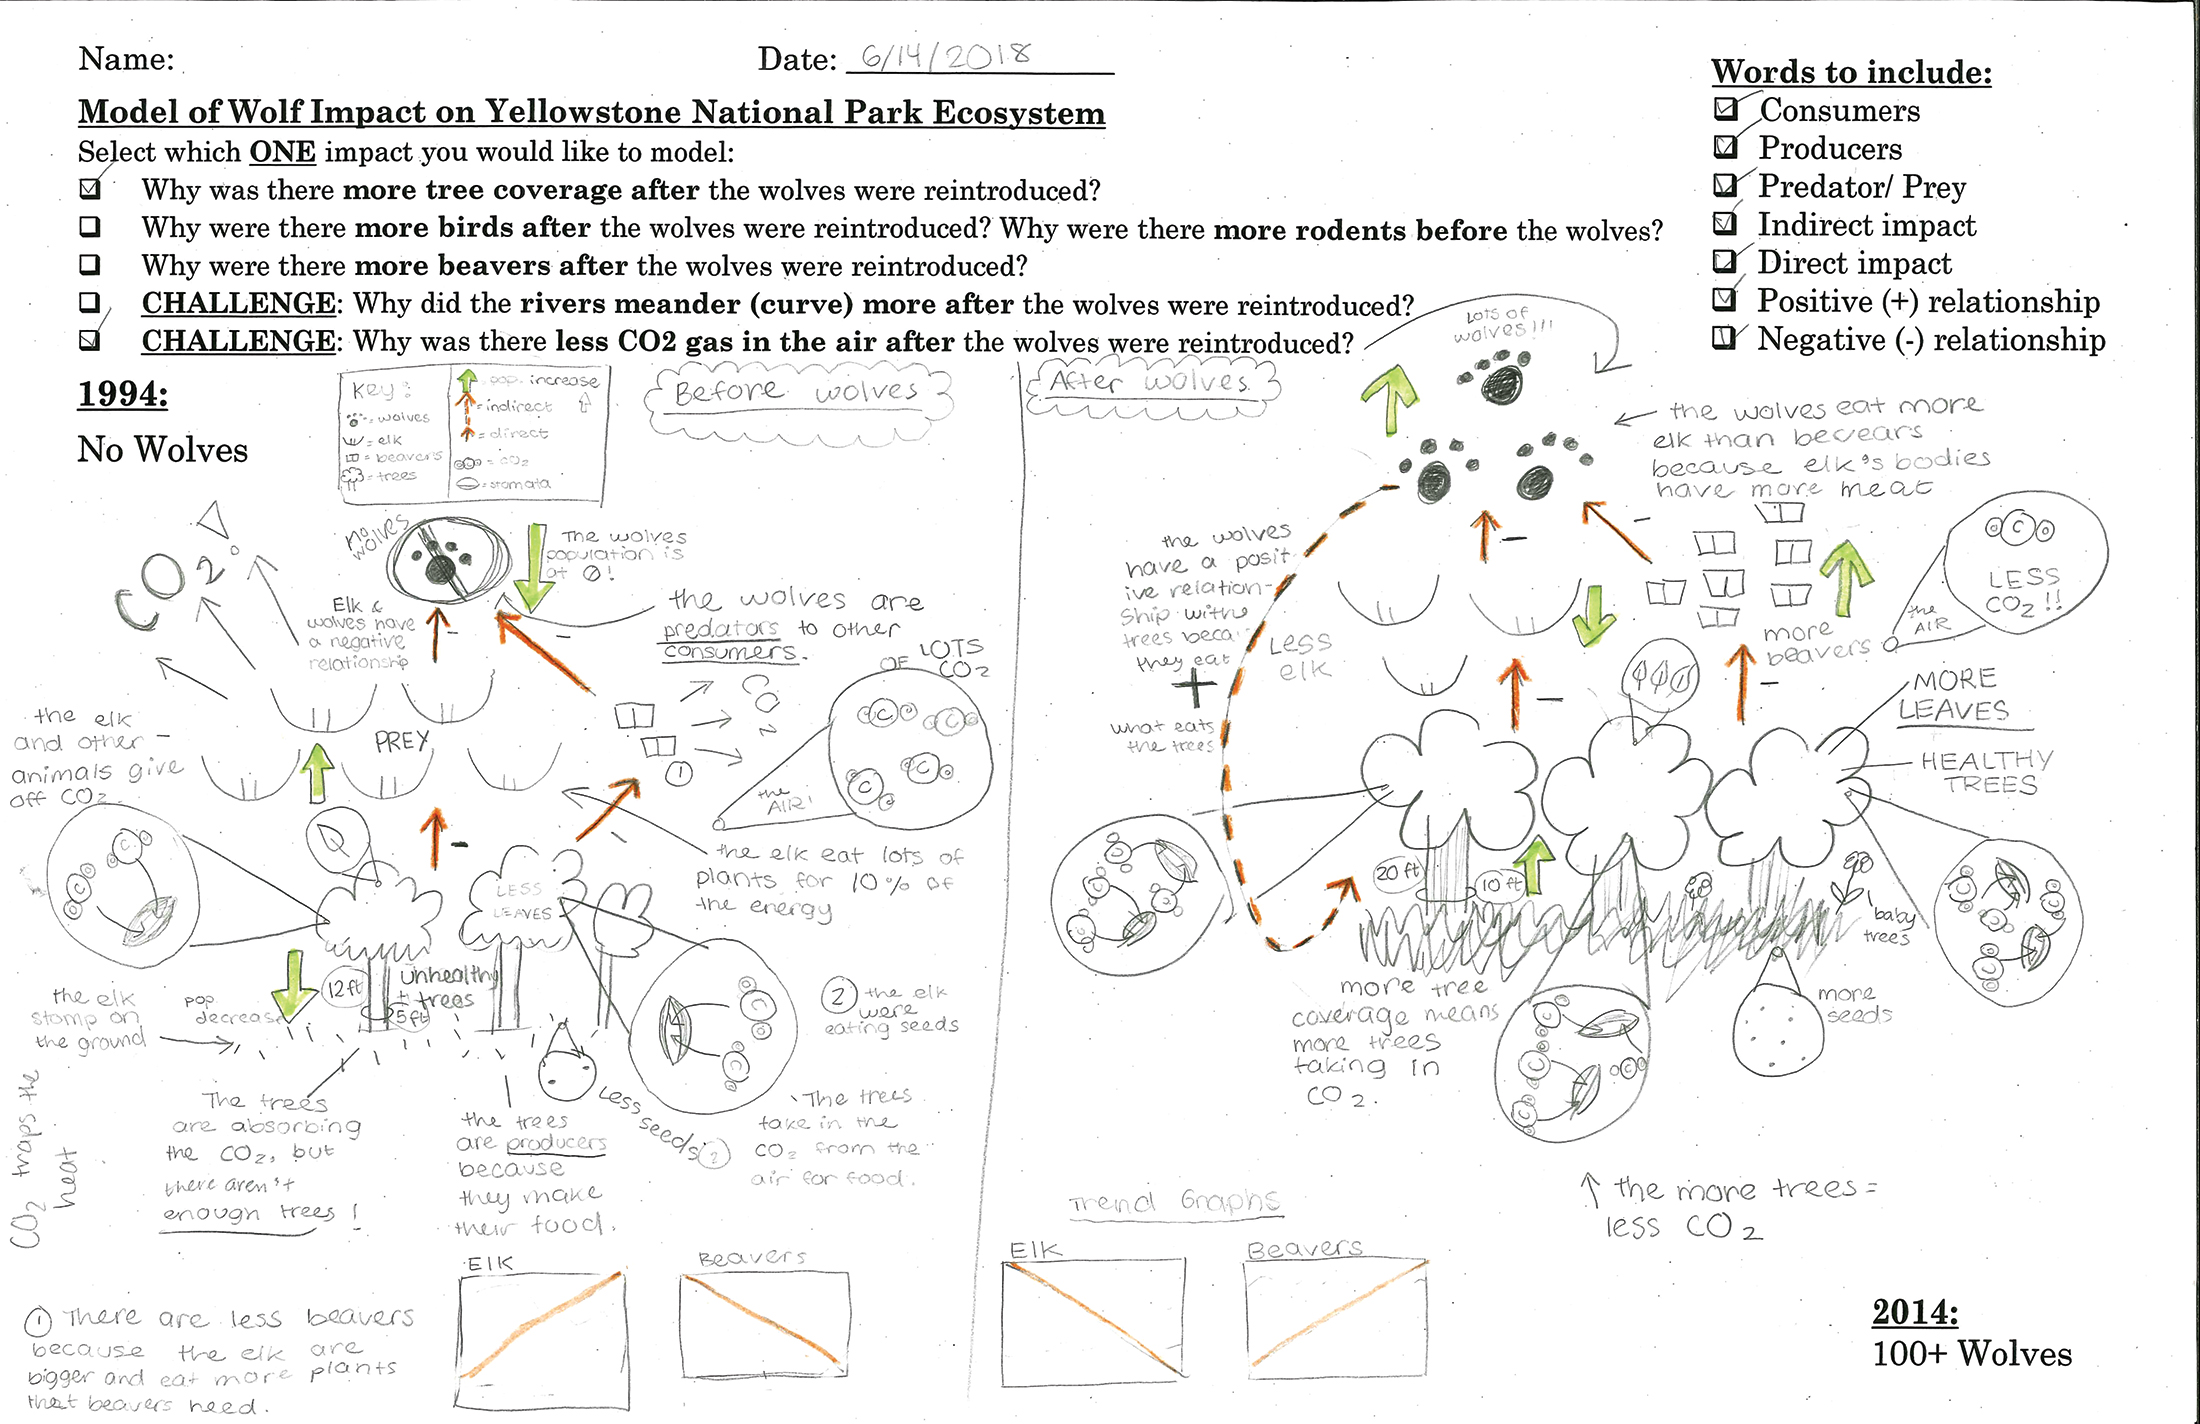
The student ecosystem model in Figure 7, gives an example of a rigorous visual explanation without the teacher providing any base pictorial layout. In this example, the essential question (really three different questions from which the students can choose in the upper left) is proscribed and the students are provided open space to represent their thinking about the changes in Yellowstone National Park after wolves were reintroduced.
While this student chose to use a comparative base pictorial layout, others in the class used a large flowchart or were inspired by graphic novel storyboards to show how the ecosystem was transformed between 1994 and 2014. This teacher required each student to use similar modeling elements, including: population graphs, zoom-ins, molecular diagrams, and some sort of flowchart. The success of this student and others is, in part, due to the constraints placed on modeling by the teacher, without which the extent of student sensemaking during the unit may have remained less visible.
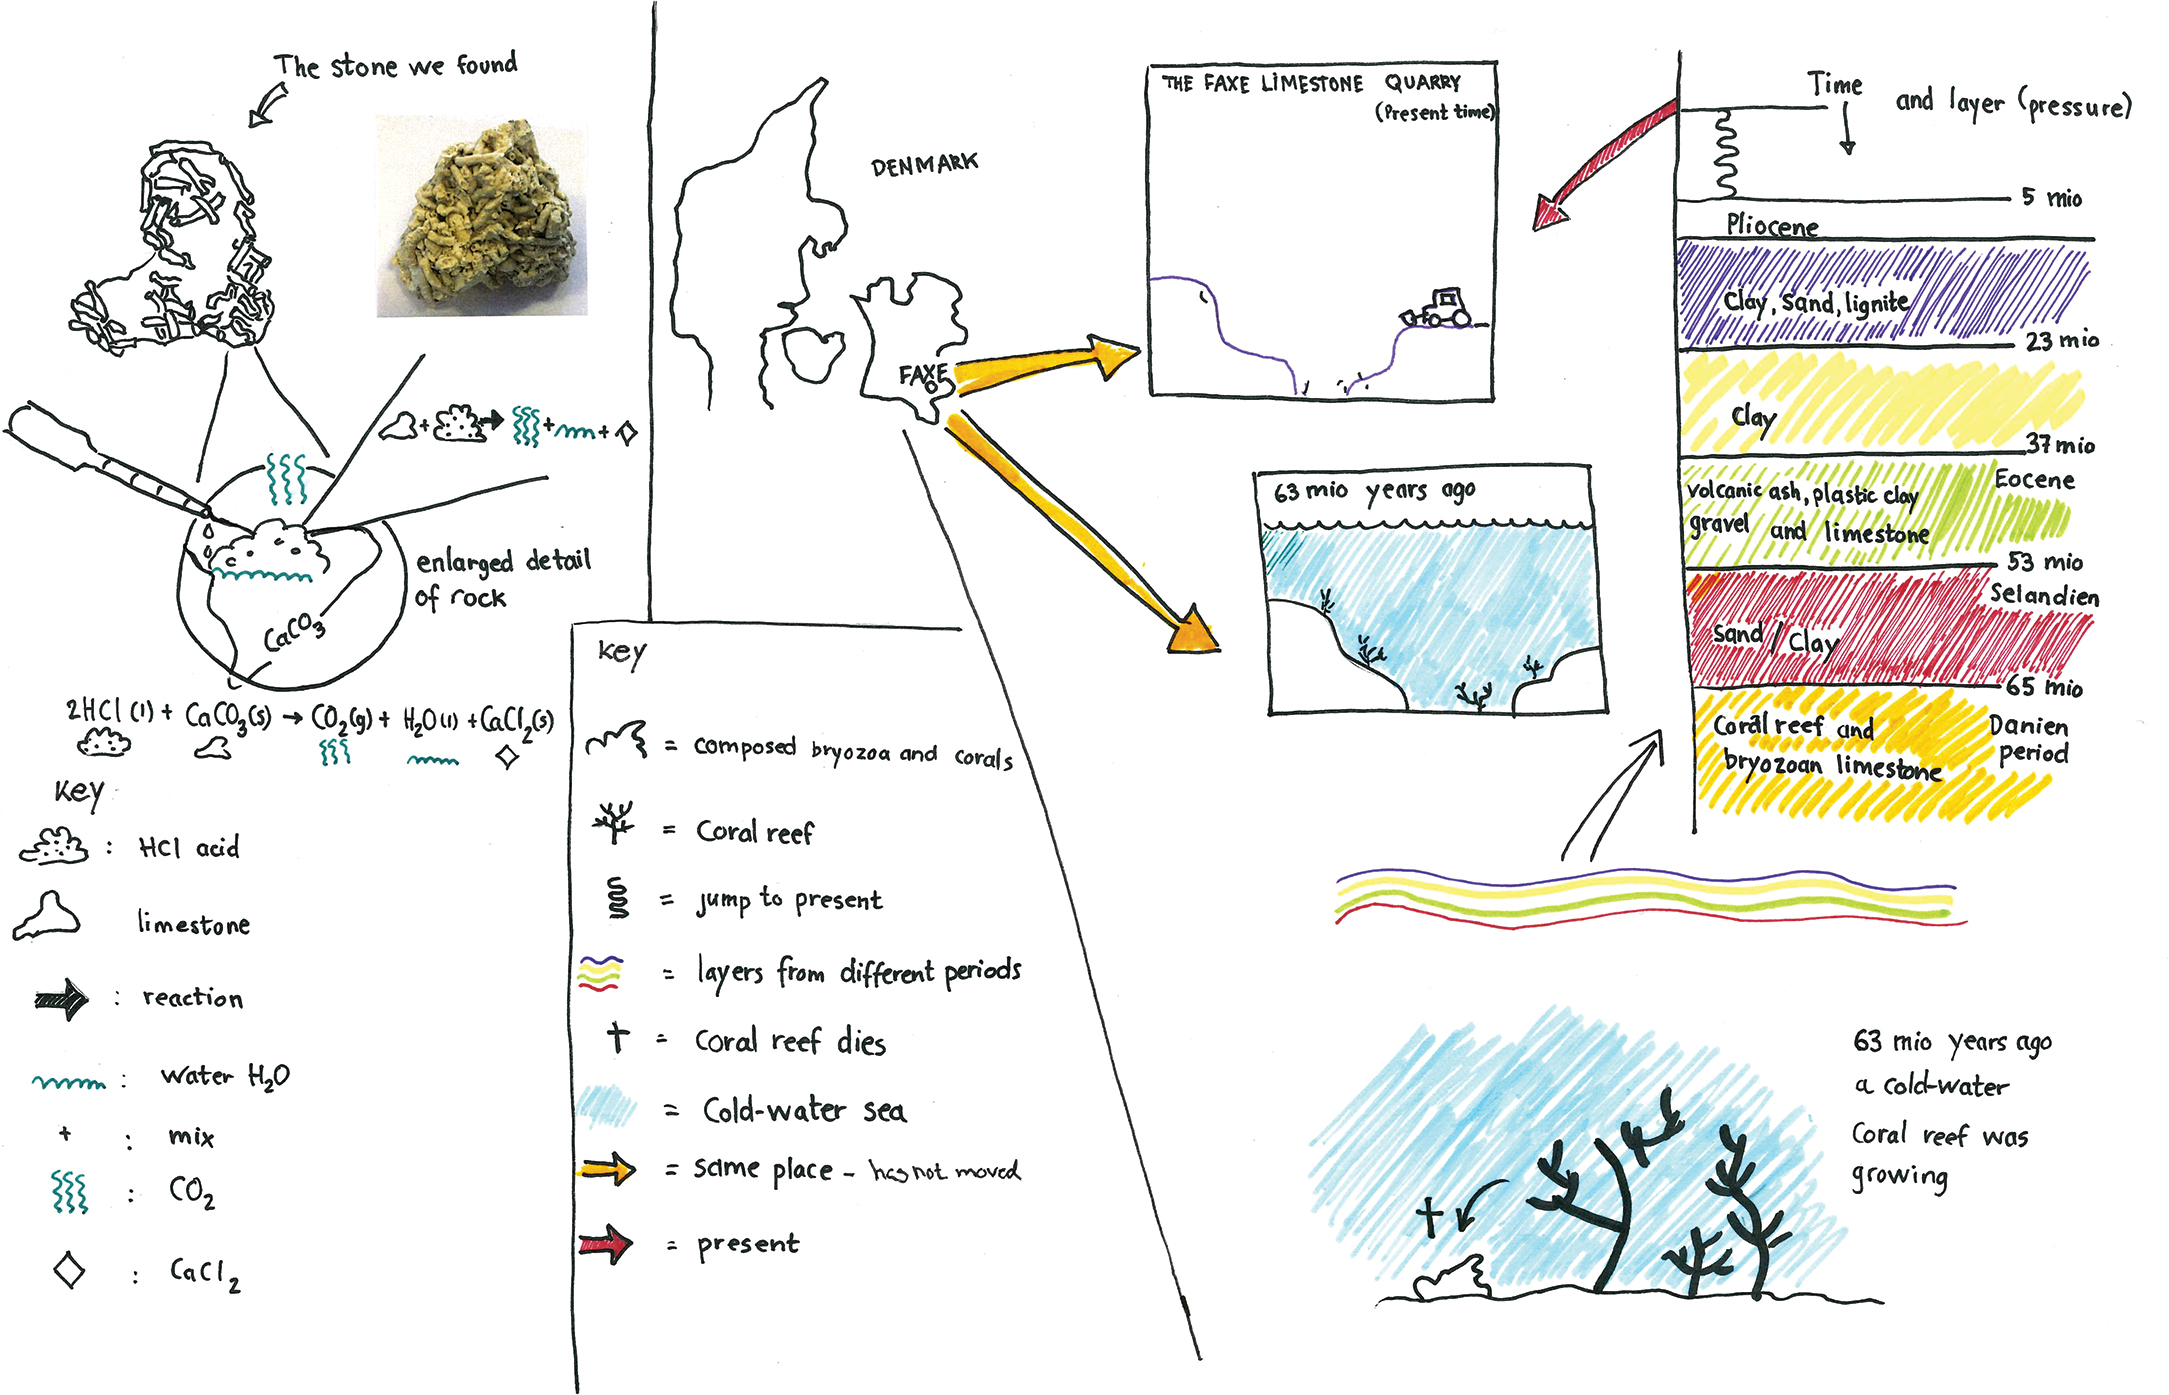
Another example of students creating their own base pictorial layouts by using suggested modeling elements is shown in Figure 8. In this case, every student chose a rock from outside the classroom. Then the teacher provided a set of essential questions: “What kind of rock is it?”; “Why is the rock shaped like that?”; “How did it come to be here and how do we know this?” Students glued a small photo of the rock on a blank sheet of paper to function as a big picture template with a lot of white space, and individually chose which pictorial elements to add to best share their explanations. Different activities in the unit, such as rock identification tests using HCL, were incorporated through the use of zoom-ins and symbols to reason about what was happening during rock formation on a microscopic level, together with mathematical equations.
Students also augmented their visual explanation with maps or geographic representations and comic strip boxes to reason about the formation and location of the rock today, as well as how the environment had changed over the past 63 million years. When we examined a class set of these students’ models, most had taken up a unique variety and combination of explanatory elements to represent on their ideas on the final versions. So, even though it started with a blank piece of paper, the class discussions along with the activities chosen by the teacher provided students with the suggestions as to how to model and explain their ideas without receiving a fully pre-determined base pictorial layout.
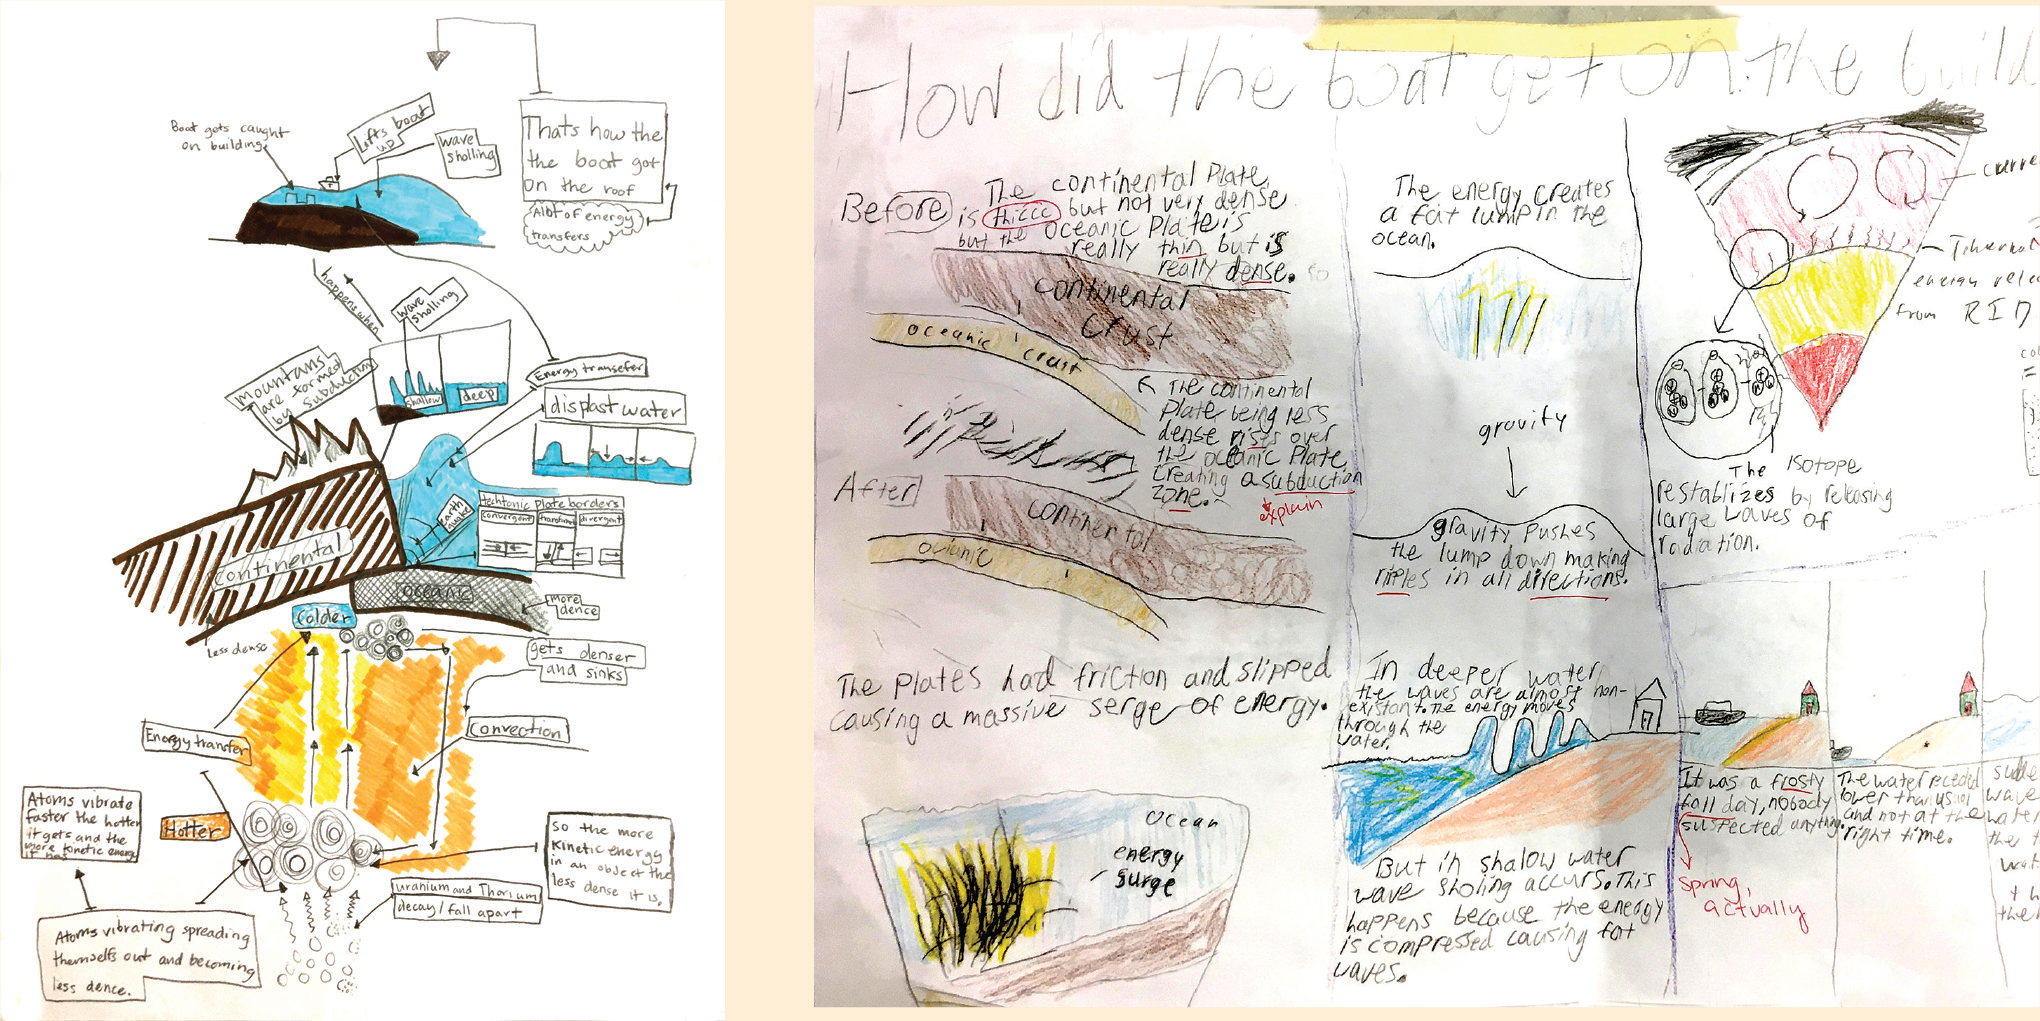
Occasionally, after students have had several opportunities to model using either their own base pictorial layouts or modeling elements, they may be ready to create models from scratch. As shown in Figure 9a and 9b, two different students with modeling experience from the same class used different modeling tools to show their understanding of how plate tectonics contributed to an earthquake and tsunami in Japan: “How did this boat get on top of a two-story building?” At a glance you can see major differences in the base pictorial layouts designed by the students. Student A stacked several elements vertically, while Student B split their paper into multiple panels. Upon closer inspection, it is clear that these two students used some of the same modeling elements, including: comic strips, choice boxes, and different scale/spatial orientations. However, they used these explanatory elements very differently. For example, Student B used choice boxes in more varied ways to show energy surges and density differences in hot and cold mantle areas. He also adds mathematical representations as well as chemical symbols to reason at the atomic level.
Although these two models serve as exemplars of student modeling, it is vital that educators understand that this level of independent modeling did not unfold overnight or without strategic support. When asked to explain how the students did the work shown in Figure 9 and 10, our teacher colleague, Molly, emphasized the importance of scaffolding modeling practices before letting students opt to work with blank paper: I have had students do final models for that unit in a variety of ways and have found that for the students who are ready, the un-scaffolded template way is the way to go. I still provide the rubric and gotta-have checklists and it seems that when they have more freedom for how they can represent their learning, their output is much more expansive and comprehensive than when I provide them with constraints and is thus way more indicative of their learning. And, by the end of the semester, it’s pretty spectacular what they come up with for their models once they’ve had so much practice!”
Other teachers recognize that no amount of modeling practice guarantees students will be prepared to independently model. Instead, these educators create and print multiple versions of the model template, with varying amounts of scaffolding, for the students to select from. This is easily done by creating a model template with all three layers at the start of the unit and then digitally editing and saving less scaffolded versions. This differentiation strategy supports a variety of students’ modeling preferences.
We want to state explicitly here that modeling is a scientific practice that involves revisions by students over the course of a unit—this is where most of the learning happens. In other publications we have described the successes of using sticky notes for students to add ideas, remove an idea, modify parts of ideas or ask a new question (Windschitl, Thompson, and Braaten 2018). This critical revision process stands between the initial and final modeling experience as a way for students to refine their thinking and teachers to formatively assess students’ learning.
Implications for modeling in your classroom
There are two big questions about this scientific practice that can organize teachers’ thinking about templates:
- How am I scaffolding the modeling experience so that students can show the most of what they know?
- How can I support students to take more ownership and authority of the modeling process over the course of the year?
In thinking about these questions and the approaches introduced in this article it may be helpful to ask further:
- Have I chosen a compelling phenomenon that is interesting to students?
- Have I tried modeling the phenomenon myself to determine how to clarify the intellectual work I’m asking students to do and what modeling elements need to be added?
- What are the knowledge boundaries of what I want students to show/explain on their final model? Is the essential question written clearly?
- Have I considered its printed size on paper and its language demands? Is there are a starting point for every learner, choices of “ways in” for all (ELLs, students who struggle to focus on one idea, etc.)?
- How am I prompting students to represent different scales, passages of time, populations, etc.?
- Have I provided enough context that students can wrestle with the phenomenon but not so much that it confuses or funnels thinking?
- Do I support and provide opportunities for students to use modeling elements in their own ways?
It is worth remembering that the goal of creating model templates and using them with students is not to funnel their thinking, but provide more authentic avenues for all learners to be able to show what they know about phenomena they are interested in.
Acknowledgments
We wish to acknowledge three of our innovative teacher collaborators, all from Washington state: Molly Ravits from Cascade High School, Cascade School District; MaryEllen Olafson, Kirkland Middle School, Lake Washington School District; Kerry Hanson, Evergreen Middle School, Lake Washington School District.
Kelsie Fowler (knp7@uw.edu) is a doctoral student in Science Education and Mark Windschitl (mwindschitl@uw.edu) is a Professor of Science Teaching and Learning, both in the College of Education at the University of Washington, Seattle. Claus Auning (caun@ucsyd.dk) is a lecturer in Teacher Education at the University of College Syddanmark, Haderslev, Denmark..
Instructional Materials Pedagogy High School