
What Makes Them Tick? Middle School Data Science Explorations of Ticks and Lyme Disease
Connected Science Learning July–September 2020 (Volume 2, Issue 3)
By Meggie Harvey, Jan Mokros, Jacob Sagrans, and Christine Voyer

One of the National Science Foundation’s 10 Big Ideas for the 21st century is “harnessing the data revolution”:
"The increasing speed at which we collect data, as well as the increasing volume and variety of that data, are profoundly transforming research in all fields of science and engineering. This deluge of data . . . is forcing scientists to ask and answer new types of questions." (NSF n.d., p. 9)
For at least a decade, scientists have relied upon large, comprehensive, and publicly available data sets that have already been collected by institutions like NOAA, NASA, or the CDC. The advantages of using such data sets are enormous: Scientists have instant access to vast amounts of data that a single scientist could not collect in a lifetime, and they can use data tools to examine patterns and test and refine predictions in a rapid, iterative manner. Data science has transformed their professional lives.
What does this transformation mean for K–12 science education? Science classroom instruction takes time to catch up to science in the real world. It requires scientists, statisticians, science educators, and math educators to work together to figure out what “data science education” should look like. We are beginning to see examples of innovative classroom resources targeting data science, as shown in the work of groups such as Concord Consortium (see especially their Data Science Games Project), EDC’s Oceans of Data Institute, and Bootstrap’s data science curriculum, all of which provide curricular resources and data tools for youth. Yet there is more to be done to catch up with the “data revolution.” Our Data Clubs project set out to contribute to this important and growing body of work, which promotes several of the crosscutting concepts in the Next Generation Science Standards (NGSS), notably patterns, cause and effect, systems and system models, and stability and change (NGSS Lead States 2013).
Out-of-school educational experiences offer important avenues for data science education because there is more freedom in these environments for youth to engage in topics that have not yet found their way into school on a large-scale basis. Furthermore, it is likely that when K–12 teachers participate in and facilitate out-of-school data science programs, they will recognize the value of the work and begin incorporating it into their classrooms. This approach of introducing teachers to new disciplinary topics through afterschool programs has been successful in a variety of “new” K–12 STEM areas including engineering (Engineering is Elementary), computer science (Hour of Code), computer modeling and computational thinking (Project GUTS), and even artificial intelligence.
Tick science, Lyme disease, and epidemiology as a context for studying data
Data Clubs have been developed through an NSF-funded project to introduce a diverse group of rural and urban middle school youth to new ways of examining data about scientific topics that they care about but have not had opportunities to investigate. These clubs have taken place on a school-sponsored farm in rural Maine, an afterschool program offered by Girls Inc., and a summer camp offered by the Y. To provide access to a broad audience, we offered the clubs free of charge to existing camps and afterschool programs.
Through the clubs, youth have opportunities to use large existing data sets that we curate in conjunction with a free digital data tool to begin posing questions and finding their own answers. The first module we developed was a 10-hour module on ticks and Lyme disease. We have developed one other Data Clubs module—“Teens and Time” —and we are currently developing a module on “Injuries On and Off the Field.” Data Clubs is a collaborative project led by Science Education Solutions (SCIEDS) and TERC in collaboration with the Gulf of Maine Research Institute (GMRI). For more information on the Data Clubs project and to request materials for the modules (including lesson plans and handouts), please visit our website.
All Data Clubs modules address the following goals:
Youth will:
- Appreciate the ubiquity of data and the potential for learning from data.
- Engage with data in ways that are intellectually and personally satisfying, and lead to persistence in exploration.
- Employ graphing and analytical “moves” to investigate and make sense of data.
- Examine relationships among variables by comparing distributions.
- Understand how data visualizations are constructed by mapping attributes to representations (both on and off the computer).
For our first module we chose the science and epidemiology of ticks and Lyme disease for many reasons. The topic is particularly salient to youth in New England, where the work was conducted: Lyme and other tick-borne diseases are prevalent in the Northeast, and almost everyone knows someone who has been affected. The topic sparked interest across several groups of middle school students, who were eager to tell us their stories of a tick bite. The spread of Lyme is not yet well understood, so the participants could explore authentic and meaningful questions. For example, climate change has expanded the range of deer ticks, the primary vector of Lyme, and many scientific questions remain as to how increased temperatures and precipitation in the region will affect rates of the disease. This is also an area where rich data sets are available: The Centers for Disease Control and Prevention (CDC) has collected data on rates and number of cases of Lyme for each state in the United States for the last decade. These data are available to everyone, including scientists, students, and the public. In addition to CDC data, we curated the project data sets to include other variables that would allow participants to explore relationships. Additional variables included forest cover from the USDA’s Forest Inventory and Analysis and temperature and precipitation data from NOAA.
The module, data sets, and data tool
The Ticks and Lyme module was designed to support youth in articulating their thinking about data in multiple contexts: with a partner, in response to questions from facilitators, and in front of the whole group. We structured the activities to lead youth to seek out more and more data as they progressed. Over time, youth were introduced to nine attributes that may relate to rates of Lyme disease, including presence/absence of deer ticks, percentage of forest cover, latitude, longitude, summer high temperature, summer low temperature, winter low temperature, summer moisture level, and winter precipitation in each state. There were also 12 years’ worth of data on Lyme disease in each state.
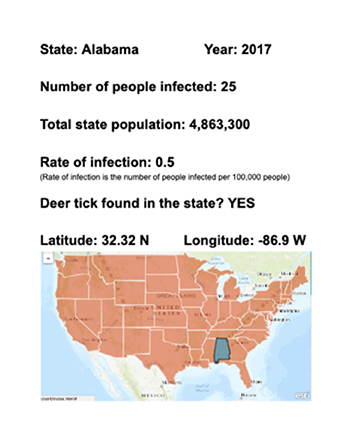
The module started with examining physical data cards (see Figure 1) that could be sorted and moved around without computers. Each data card contained several attributes (also known as “variables”), including the rate of Lyme disease and additional geographic and population data from one state in 2017. We prepared sets of 50 state cards and prompted youth to organize the cards on large desks and tables in a way that might help them learn something from the data. As they worked with a partner to arrange their cards, we asked them to articulate their organizing strategies and share observations of any emerging patterns, helping them draw connections between the ways they arranged the data and the patterns they were able to see.
The state cards involved a small data set, but we also wanted participants to pose questions of larger amounts of data. To explore questions involving larger data sets, we used CODAP, a free computer tool developed by the Concord Consortium for middle and high school students. CODAP enables users to easily organize and graph data that are too unwieldy to explore by hand. Using intuitive moves, users sort, order, categorize, and represent data. They can also select a subset of data to examine, a process called filtering. All of these actions—which build on the moves youth made to arrange the data on the physical cards—are described by CODAP designers as “data moves,” and they are a necessary step toward seeing patterns and making sense of either simple or complicated data (Erickson et al. 2019; Erickson 2020). Note that decisions about what to put on a graph, and what attributes to compare, are left entirely to the user.
To get a sense of how CODAP works, you may view a short video showing how one could explore and represent Lyme infection rates in relation to the percentage of forestation in various states. You may also explore the Tick and Lyme module data sets in CODAP at the following links: https://bit.ly/lyme17, https://bit.ly/lyme_over_time2, and https://bit.ly/lyme_weather_forestation. To learn the features of CODAP, you may wish to view the “challenge cards” we prepared for youth.
The data sets that project staff curated and placed in CODAP enabled participants to use all the data they had seen on the physical cards, plus additional attributes that were presented as the module progressed. Often the starting task was to organize the data in a way that helps one learn something about Lyme disease infection rates. Youth worked in small groups to figure out what they wanted to do with the data. We probed their thinking as they looked at relationships between various attributes, while youth shared their strategies and their observations of the data with the larger group. Over the course of the 10-hour module, participants produced a variety of graphs and maps that added to the group’s understanding of what might be happening with ticks and Lyme. Each time they made new graphs, participants honed in on slightly different aspects of the data.
Methods
The Ticks and Lyme module was implemented three times, with the number of participants in each round ranging from 6 to 20. The program was facilitated by the developers themselves, in conjunction with educators from local schools. Our aim was to gather data as we taught, and to use the formative data to improve the module and learn about how youth thought about data. Other adults—including teachers, evaluators, and project staff—attended to assist, collaborate, or observe. The methods of capturing data from youth included detailed observations, artifact collection, and a pre- to post-questionnaire tapping participants’ dispositions about data and its value.
The youth who participated ranged in age from 11 to 14. We recruited youth by giving them a lively description of Data Clubs and by talking with them individually. Permission for participation was obtained from both youth and their caregivers.
Results: What youth learned
Youth participating in the Ticks and Lyme module learned important data science skills, gained a better understanding of the science and epidemiology of tick-borne diseases, and developed positive dispositions toward working with data. Our observations show that youth quickly learned to use CODAP to assist them in investigating their own questions about the data. They did this by making representations to show relationships between attributes. Over the course of the module, youth explored new questions based on what they had learned in previous activities. Observational notes capture some of the questions they addressed:
- How strong is the relationship between the percentages of forest cover in various states and their rates of Lyme disease?
- What patterns are there in the rate of infection in a given state or region over several years?
- What is the relationship between rate of Lyme infection and temperature variables such as winter lows or summer highs?
Examples of the data visualizations made by youth and shown in Figures 2–5 give the reader a sense of the range of questions asked, as well as the representations they came up with to address these questions.
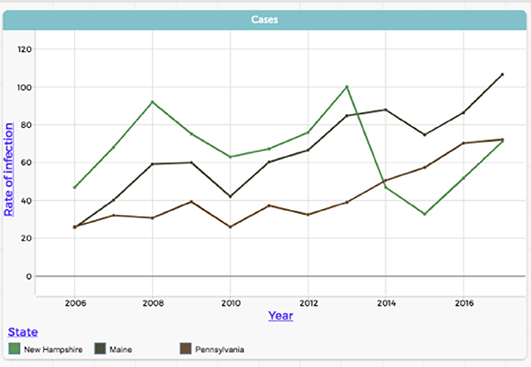
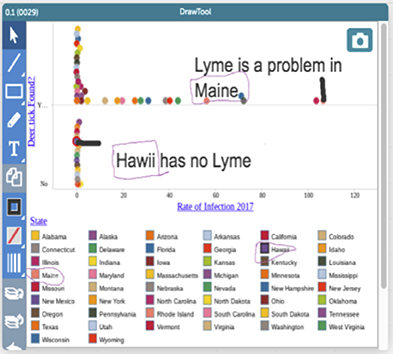
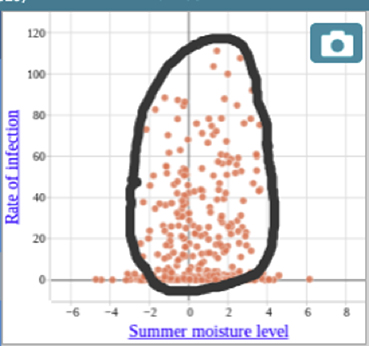
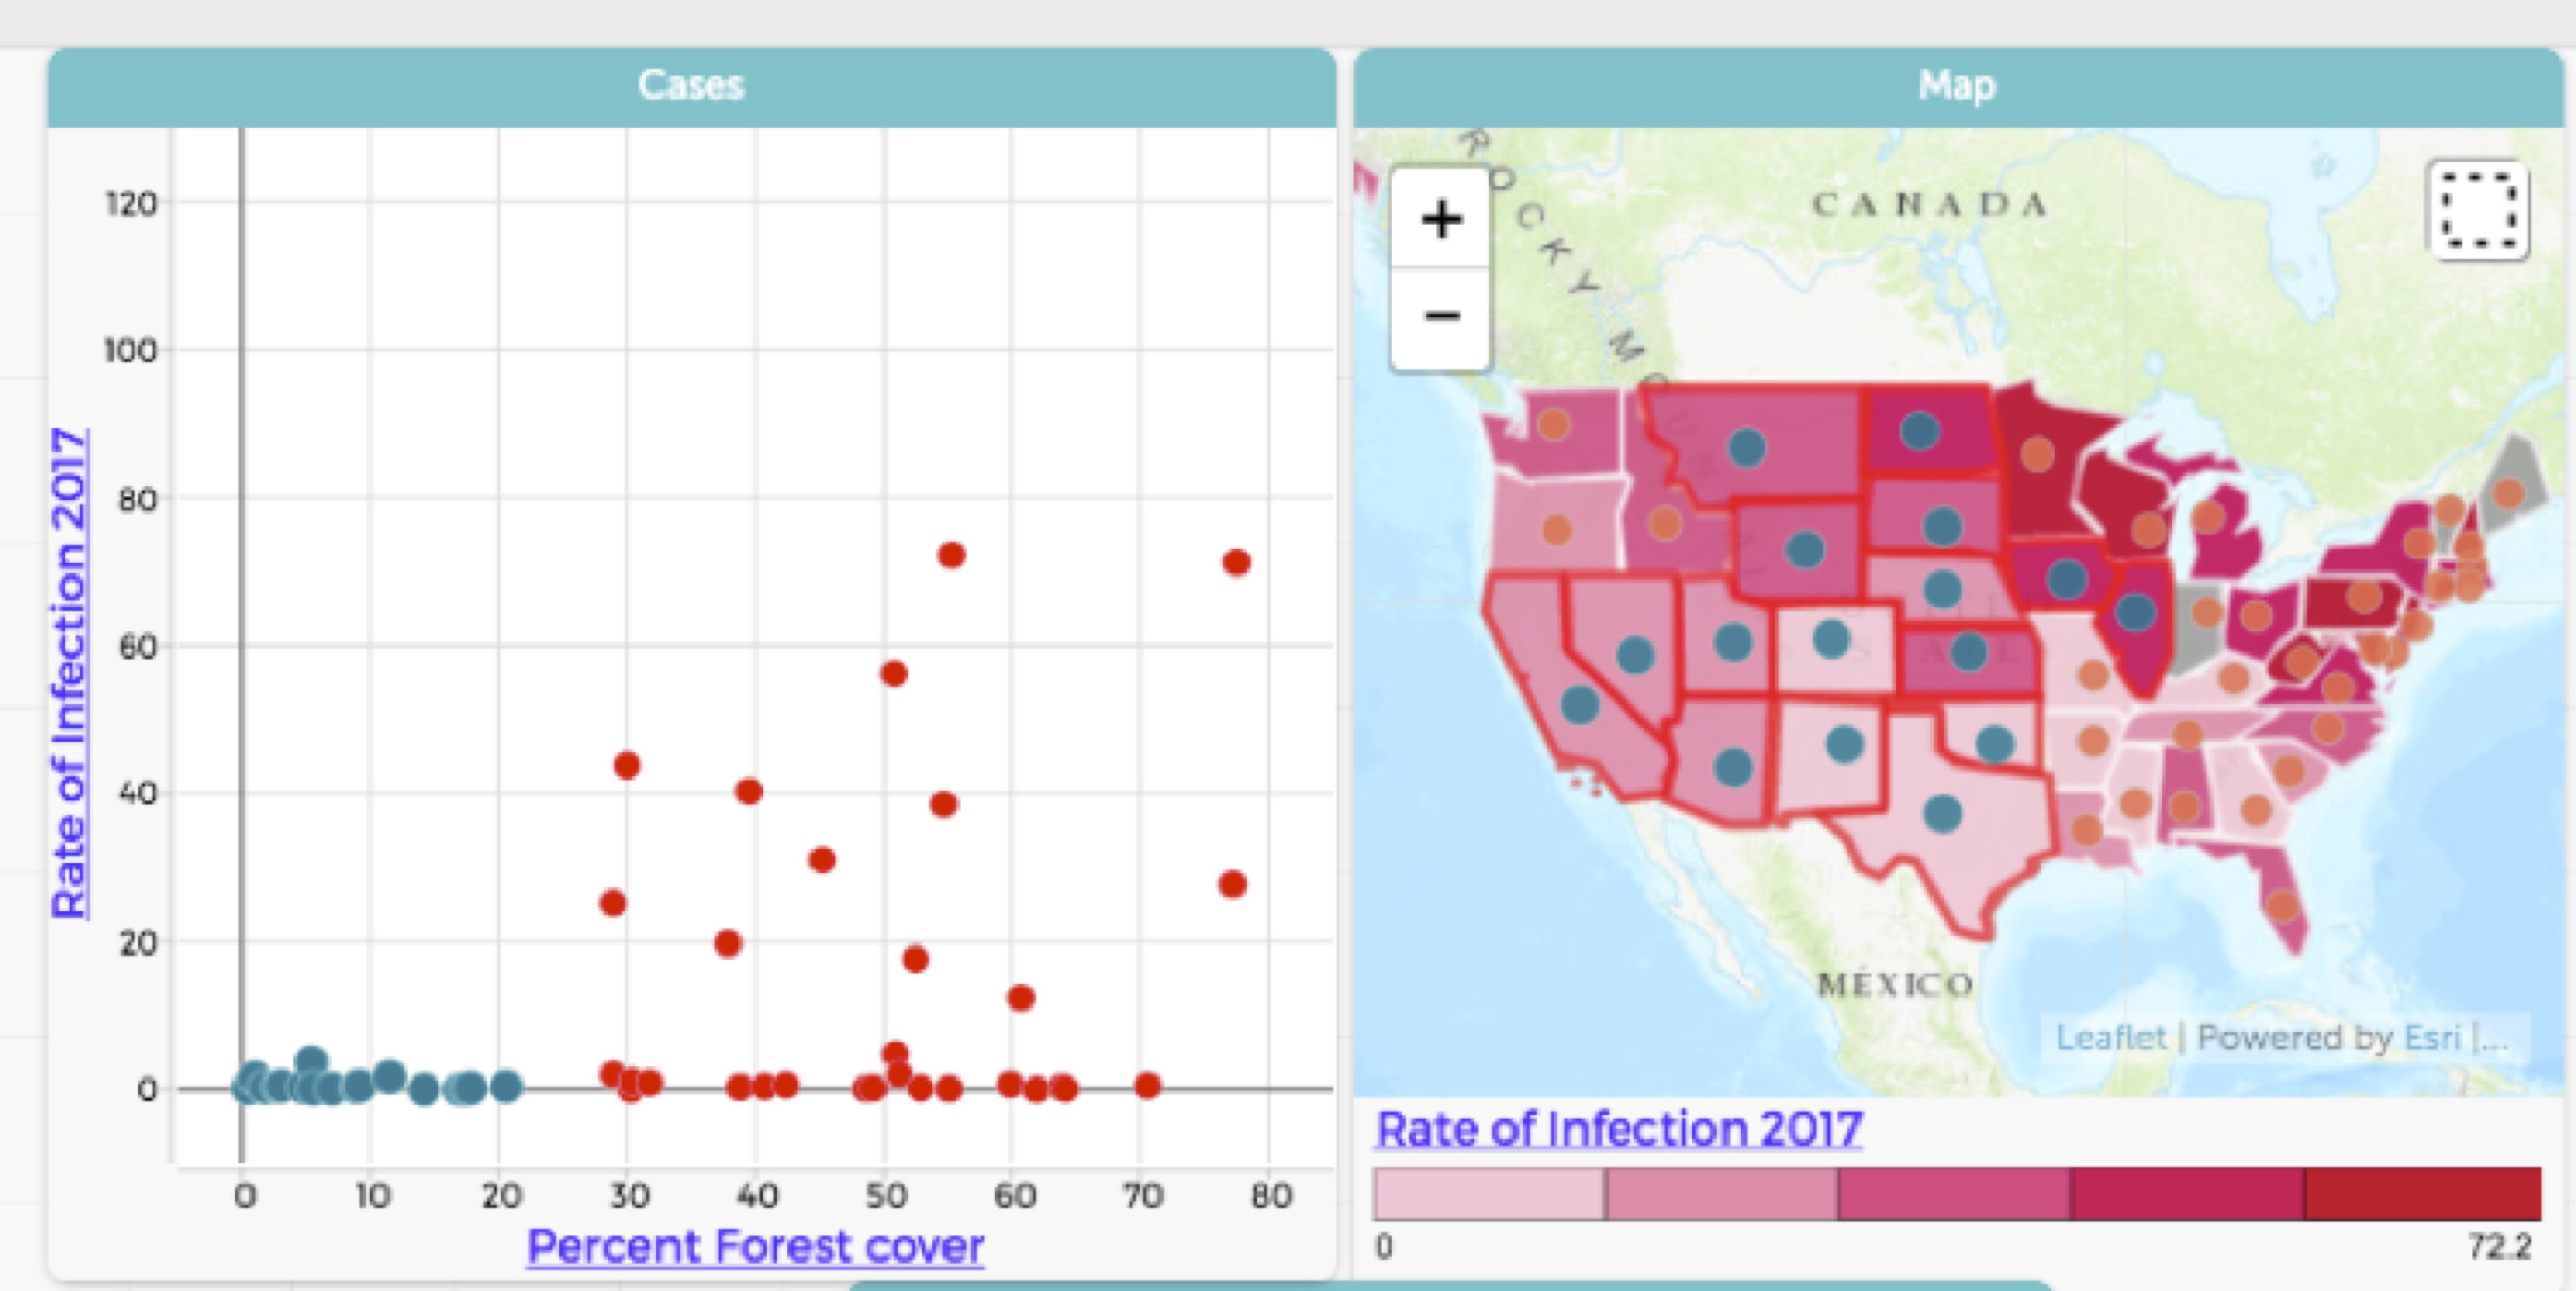
Figure 4 illustrates how participants were able to make sense of distributions by creating and analyzing a scatter plot: The states with higher rates of Lyme disease cluster into a certain range of summer moisture levels. Figure 5 provides an example of how youth examined and made sense of geographic trends. The youth who created this visualization was able to read data from a map and a corresponding scatter plot to recognize that in states where forest cover is low, rates of Lyme are also low, and that these low forest cover/low Lyme states are concentrated in the western part of the country. More broadly, by exploring maps such as the one in Figure 5, youth were able to observe geographical trends with Lyme disease and hone in on places with exceptionally high or low rates of Lyme, inspiring further investigation of data pertaining to those places. In terms of changes in Lyme rates over time, participants understood that data were highly variable in some states over the 12-year period that we studied (see New Hampshire in Figure 2), but they also were able to identify trends in states where the rate of Lyme was increasing (see Maine and Pennsylvania).
Youth were interested in working with a large amount of data that they could manipulate in a variety of ways. They chose particular attributes and/or filtered to focus on the data that could help them answer questions that interested them. By making data moves in CODAP, they could filter the data to focus on just a few states, setting aside states that were not relevant to what they were exploring (such as states without deer ticks when exploring factors that contribute to high rates of Lyme disease).
As they worked with the data, participants drew on what they were learning about tick science to make sense of the data (e.g., participants played a game that modeled the tick lifecycle and received a visit from an epidemiologist). For instance, they learned that ticks hide in leaf litter to survive winter, so many of them created visualizations correlating winter low temperatures with incidence of Lyme. However, they did not see a neat correlation between these two attributes. Youth understood that a phenomenon like incidence of Lyme had multiple determinants, but they found it challenging to see which variables were major or minor contributors to Lyme disease. The primary goals of the module centered on data science skills: The fact that much of the ecological science is still being uncovered by professional scientists—along with the fact that facilitators were not experts in tick science and epidemiology—perhaps made participants more confident to openly explore the data.
Sometimes youth were interested in questions that could not be answered by the curated data sets that we provided. For example, one participant wanted to know the deer population of a state and how that might predict the incidence of Lyme. Another was curious about how rates of Lyme in the United States compared to rates in other countries. We found data to begin to address these questions whenever we could (for instance, we found sources suggesting Lyme disease may be especially problematic in Slovenia). Participants sometimes came to the next session having explored their own new lines of inquiry. It was exciting to witness the sheer quantity of questions that came up for participants in the sessions.
Results: Participants’ dispositions toward data
We administered a Data Dispositions survey, which was adapted from instruments developed by the Activation Lab. This survey tapped participants’ engagement with data, their curiosity about it, and their understanding of how data is relevant and how it is used in the real world. It also measured participants’ self-assessed competencies with data, which improved in several areas by the end of the module. Table 1 presents results of selected items from the pre- and post-module surveys. Note that the sample size was too small for formal statistical analyses, so the results below are only suggestive. However, they indicate that youth began and ended their experience with a fairly high degree of curiosity, persistence, and confidence. Our full Data Dispositions survey can be viewed here.
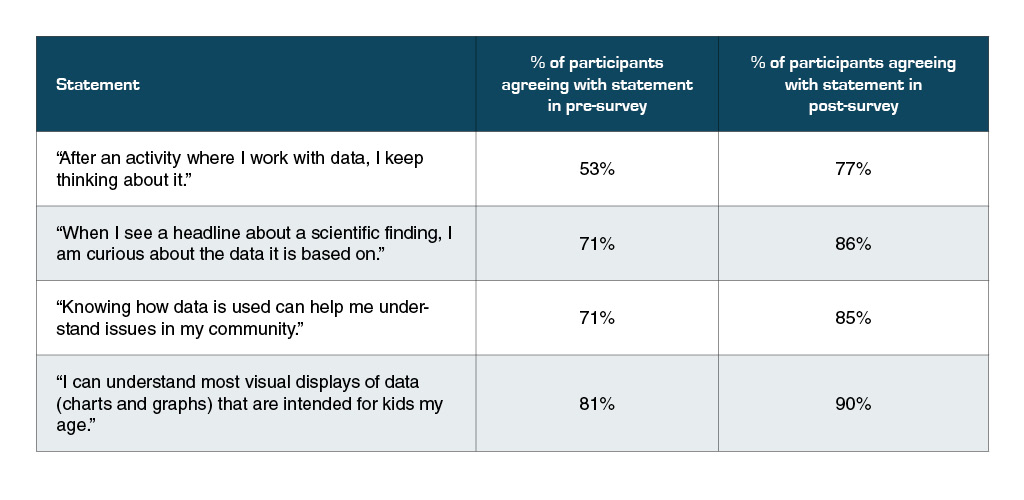
Table 1
Results from the pre- and post-module Data Dispositions surveys (N = 21)
At the end of the module we also interviewed several individuals to better understand what they liked about their experience and how they were thinking about data. One of them shared what had changed for her:
"I really loved using the technology [CODAP]. I’ve never done anything like that before ... Whenever I have looked at data before, it’s always been on a graph, printed on paper, [and] I can’t change anything about it. I like being able to change the attributes [in CODAP] and to take away some case to more clearly see what could be happening."
In general, the observations showed that youth were thinking more about what data scientists do and were beginning to view themselves as data scientists. We had reinforced this idea throughout the module by telling youth they were doing the same type of work that data scientists and epidemiologists do.
Discussion and conclusions
The biggest takeaway from the project is that youth became deeply engaged in a relevant topic, persisted in asking questions about real data, and used it to address their questions. Youth understood that the answers to their questions are not known in advance, even to scientists and their program leaders, and this made the work more relevant to them. For example, youth were asked to determine which states they expected would have the biggest problem with Lyme disease at a certain point in the future. They made graphs, examined trends in the increase of Lyme disease in particular states, and looked at the states that consistently had very high levels of Lyme. They articulated their differing predictions and offered evidence to support them. As the discussion wrapped up, one 12-year-old turned to the leader and asked, “Who’s right?” The leader shrugged sympathetically and said, “I don’t know, it’s still a year away.” Surprise spread across the youth’s face as it dawned on him that while scientific inquiry can yield evidence-based predictions, the results are not known in advance.
Unexpectedly, we discovered that youth were fascinated by data-rich science topics. They were concerned about how Lyme disease is reported and wanted to know how data are “counted.” For instance, what happens when physicians do not report Lyme disease, when someone is infected but never gets tested, or when people who are traveling are diagnosed somewhere other than their home state?
The same questions might be raised about COVID-19 data. With the emergence of the pandemic, everyone from youth to the public at large have access to large data sets that are vital in making personal decisions as well as in protecting the public’s health. The intersection between data science and epidemiology has never been more important.
Prior to COVID-19, there was already the beginnings of a movement to teach epidemiology in secondary schools, though it is unclear where the curricular “place” for this topic will be, especially in middle school. National health education standards touch on epidemiology but curricula vary widely from state to state and grade to grade, and in some cases can be quite limited. The CDC has developed standards (Cordeira and Cordell 2015) that outline scientific and data skills that are critical to learning epidemiology in high school, and these standards overlap to a significant degree with the crosscutting concepts in the Next Generation Science Standards (NGSS). Both NGSS and the CDC epidemiology standards identify the importance of finding mathematical patterns in data and using data representations to illuminate these patterns. Both sets of standards address differences between correlation and causality, and both identify the importance of making predictions and testing these predictions with data. There is opportunity in designing learning experiences that weave together data-driven science disciplines like epidemiology with data science learning goals to elevate both in learning contexts.
Another noteworthy finding from our project involved stepping out of traditional teacher/learner roles. We found that youth, classroom teachers, and out-of-school leaders were on equal footing as they explored data about ticks and the spread of Lyme disease. They were also peers in their shared interest in ticks and Lyme as a health problem that affected many of their families. The strong initial camaraderie quickly grew as group members helped each other with the technology, showed each other their cool data moves, and eagerly shared new information on Lyme disease that they discovered between group sessions. A classroom teacher who occasionally attended the sessions worked alongside his students and commented that they were teaching him to use CODAP and to ask better questions of the data.
We have found that data science is both relevant and accessible to middle school youth and that they are able to use tools to study an important scientific topic. After implementing the module in different settings, we now believe that where this work takes place—whether during an afterschool program, a summer camp, or a virtual or in-person classroom—does not seem to matter. We saw depth in the ways that youth raised and addressed their own questions. Simply put: with an engaging topic, curated data sets that help learners investigate the topic, and time and tools to ask and investigate questions, middle school learners can become data scientists.
Acknowledgments
Data Clubs is a collaborative project led by Science Education Solutions (SCIEDS) and TERC in collaboration with the Gulf of Maine Research Institute (GMRI). In addition to the authors, the following people have been instrumental in the project: Andee Rubin (co-PI), Traci Higgins, Tracey Wright, Leigh Peake, Elizabeth Osche, and Ada Ren.
The Data Clubs project is funded by the National Science Foundation, grant nos. DRL-1742255 and 1741989. Any opinions, findings and conclusions or recommendations expressed in these materials are those of the authors and do not necessarily reflect the views of the National Science Foundation.
Meggie Harvey (mharvey@gmri.org) is a science curriculum specialist at the Gulf of Maine Research Institute. Jan Mokros (jmokros@scieds.com) is a senior research scientist at Science Education Solutions. Jacob Sagrans (sagransj@gmail.com) is a senior research associate at Science Education Solutions. Christine Voyer (christine@gmri.org) is a science education program manager at Gulf of Maine Research Institute.
citation: Harvey, M., J. Mokros, J. Sagrans, and C. Voyer. 2020. What makes them tick? Middle school data science explorations of ticks and lyme disease. Connected Science Learning 2 (3). https://www.nsta.org/connected-science-learning/connected-science-learning-july-september-2020/what-makes-them-tick
Instructional Materials STEM Technology Middle School Informal Education