
Using Computational Thinking and Modeling to Build Water and Watershed Literacy
Connected Science Learning March–April 2021 (Volume 3, Issue 2)
By Bess Caplan, Beth Covitt, Garrett Love, Alan R. Berkowitz, Kristin L. Gunckel, Chelsea McClure, and John C. Moore
Engaging students in science learning that integrates disciplinary knowledge and practices such as computational thinking (CT) is a challenge that may represent unfamiliar territory for many teachers. CompHydro Baltimore is a collaborative partnership aimed at enacting Next Generation Science Standards (NGSS)–aligned instruction to support students in developing knowledge and practice reflective of the goals laid out in A Framework for K–12 Science Education (National Research Council 2012) “... that by the end of 12th grade, all students possess sufficient knowledge of science and engineering to engage in public discussion on related issues … and are careful consumers of scientific and technological information related to their everyday lives.” This article presents the results of a partnership that generated a new high school level curriculum and teacher professional development program that tackled the challenge of integrating hydrologic learning with computational thinking as applied to a real-world issue of flooding.
CompHydro Baltimore produced Baltimore Floods, a six-lesson high school unit that builds students’ water literacy by engaging them in computational thinking (CT) and modeling practices as they learn about water system processes involved in urban flooding (See Computational Thinking and Associated Science Practices). CompHydro demonstrates that broad partnerships can address these challenges, bringing together the diverse expertise necessary to develop innovative CT-infused science curriculum materials and the teacher supports needed for successful implementation.
Leveraging Partnerships to Develop the Baltimore Floods Curriculum
The CompHydro Baltimore partnership is based on a model of collaborative engagement and the co-development of knowledge, products, and solutions to address mutually agreed upon challenges identified by the different stakeholders (van Kerkloff and Lebel 2015; Meadow et al. 2015; Clark et al. 2016). The partnership relies on two critical elements: (1) collaborative curriculum development and (2) engagement with classroom teachers as project partners.
1. Collaborative curriculum development and computational model building. CompHydro Baltimore brought together a team comprising
- environmental scientists from Cary Institute, University of Maryland Baltimore County, and the U.S. Geological Survey;
- computational scientists from Colorado State University, Shodor (a nonprofit computer science education organization), and the North Carolina School for Science and Math;
- science education researchers from the Universities of Arizona and Montana;
- professional development (PD) providers from Cary Institute and its Baltimore Ecosystem Study; and
- teachers from the Baltimore City Public School System (City Schools).
The team built on its expertise in issues such as flooding; development of place-based curricula and PD programming; research on learning progressions in environmental science and in computational science education; and educational computer model development.
By drawing on the varied expertise across our partnership, we were able to accomplish critical tasks that would not otherwise have been possible including:
- accessing local case studies and authentic data that aligned with education goals and that could inspire and maintain student interest;
- developing high school–appropriate computational modeling tools; and
- developing, testing, and refining an instructional unit and associated tools and PD.
Professional models often require extensive training for use and assume pre-existing science knowledge and practice that are, in fact, the end learning goals for high school instruction. Thus, the educational computational models designed for Baltimore Floods achieve dual purposes. First, they maintain enough scientific rigor to serve as valid models for the hydrologic concepts and processes addressed in the unit. Second, the models provide interfaces and visual outputs that allow students to explore how the models’ rules represent physical phenomena through system and data abstraction and quantification.
2. Engagement with classroom teachers as project partners. CompHydro Baltimore partnered with 14 self-selected teachers from City Schools to help shape, test, and revise both the curriculum and the teacher supports needed for successful classroom implementation in both science and computer science courses. The teachers participated in extended CompHydro PD, instructional implementation, and collaborative feedback activities to inform refinements to the unit over three years. Participants were intrigued by the better outcomes they might get with the integration of computation and hydrology and the connections they found to their own curriculum.
CompHydro Baltimore PD drew on all members of the partnership. Building NGSS-aligned curriculum materials with teachers in a large, urban district requires collaboration to ensure responsiveness to the contexts and needs of the district, teachers, and students. Partnering with City Schools facilitated the development and iterative refinement of NGSS-aligned instructional materials that attended to issues such as curricular and PD foci and technological requirements.
Linking Computational Thinking and Water Literacy
Table 1 provides a conceptual, three-dimensional framework for the Baltimore Floods unit, modeled after the concept of three-dimensional learning that is a hallmark of the Framework and NGSS. Our framework is three-dimensional in the sense that it supports students in connecting a crosscutting concept (systems and system models), computational thinking science practices, and water literacy core disciplinary ideas.
We define water literacy as the capacity to use science to inform participation in discussion and debates concerning water systems issues that people encounter in their lives (Gunckel 2012; Covitt 2017; Deboer 2000; Feinstein et al. 2013; National Research Council 2012). Our own and other research has revealed that students can develop water literacy and science literacy more generally as instruction supports their progress from storylike narratives to more mechanistic and systems-based understandings (Covitt 2020; Nordine et al. 2019).
In the pre-NGSS era, CT was not generally included in articulations of water literacy. However, computational modeling is an essential part of hydrological science. Models provide powerful tools for using large data sets to produce maps, graphs, and other visualizations that communicate complex relationships in parsimonious forms (Wainwright and Mulligan 2005). Because hydrologists use computational models to explain and predict events and phenomena in water systems, such as riverine flooding, CT is recognized as an important strategy to prepare students to participate effectively in discussions about water issues.
Even though Baltimore Floods focuses on CT, not all of the CT activities in the unit involve working with computers. Many forms of CT practice (e.g., abstraction, quantification, extrapolation, parameterization, and rulemaking) don’t require a computer. In education contexts, CT activities enacted without computers are referred to as unplugged CT experiences (Gunckel et al., Accepted; Looi et al. 2018). The Baltimore Floods unit integrates both unplugged and computer-based CT experiences in its instructional sequences.
For example, a topographic map of a watershed can be useful for making sense of the spatial dimension of flooding in urban watersheds through predicting which areas on the map might be vulnerable to flooding. Yet we know that maps may pose spatial reasoning challenges for some students. Thus, in addition to maps, it was also important to engage students with three-dimensional physical watershed models as well as computer models of watersheds—building conceptual connections across different models and representations. In our project, we use “representation” to describe a depiction or static visualization of a system or data set and “model” as a formalized description of a system or phenomenon that uses assigned parameters, rules, and mechanisms for how the system works to generate explanations and predictions. (Harrison and Treagust 2000; Passmore et al. 2009; Schwartz et al. 2009).
Through these experiences with multiple models and representations, the Baltimore Floods unit supports students in developing connected understanding of how and why flooding occurs; they can apply this to intellectually challenging tasks, such as judging the accuracy or validity of water systems computer models and outputs.
Baltimore Floods Lesson Arc
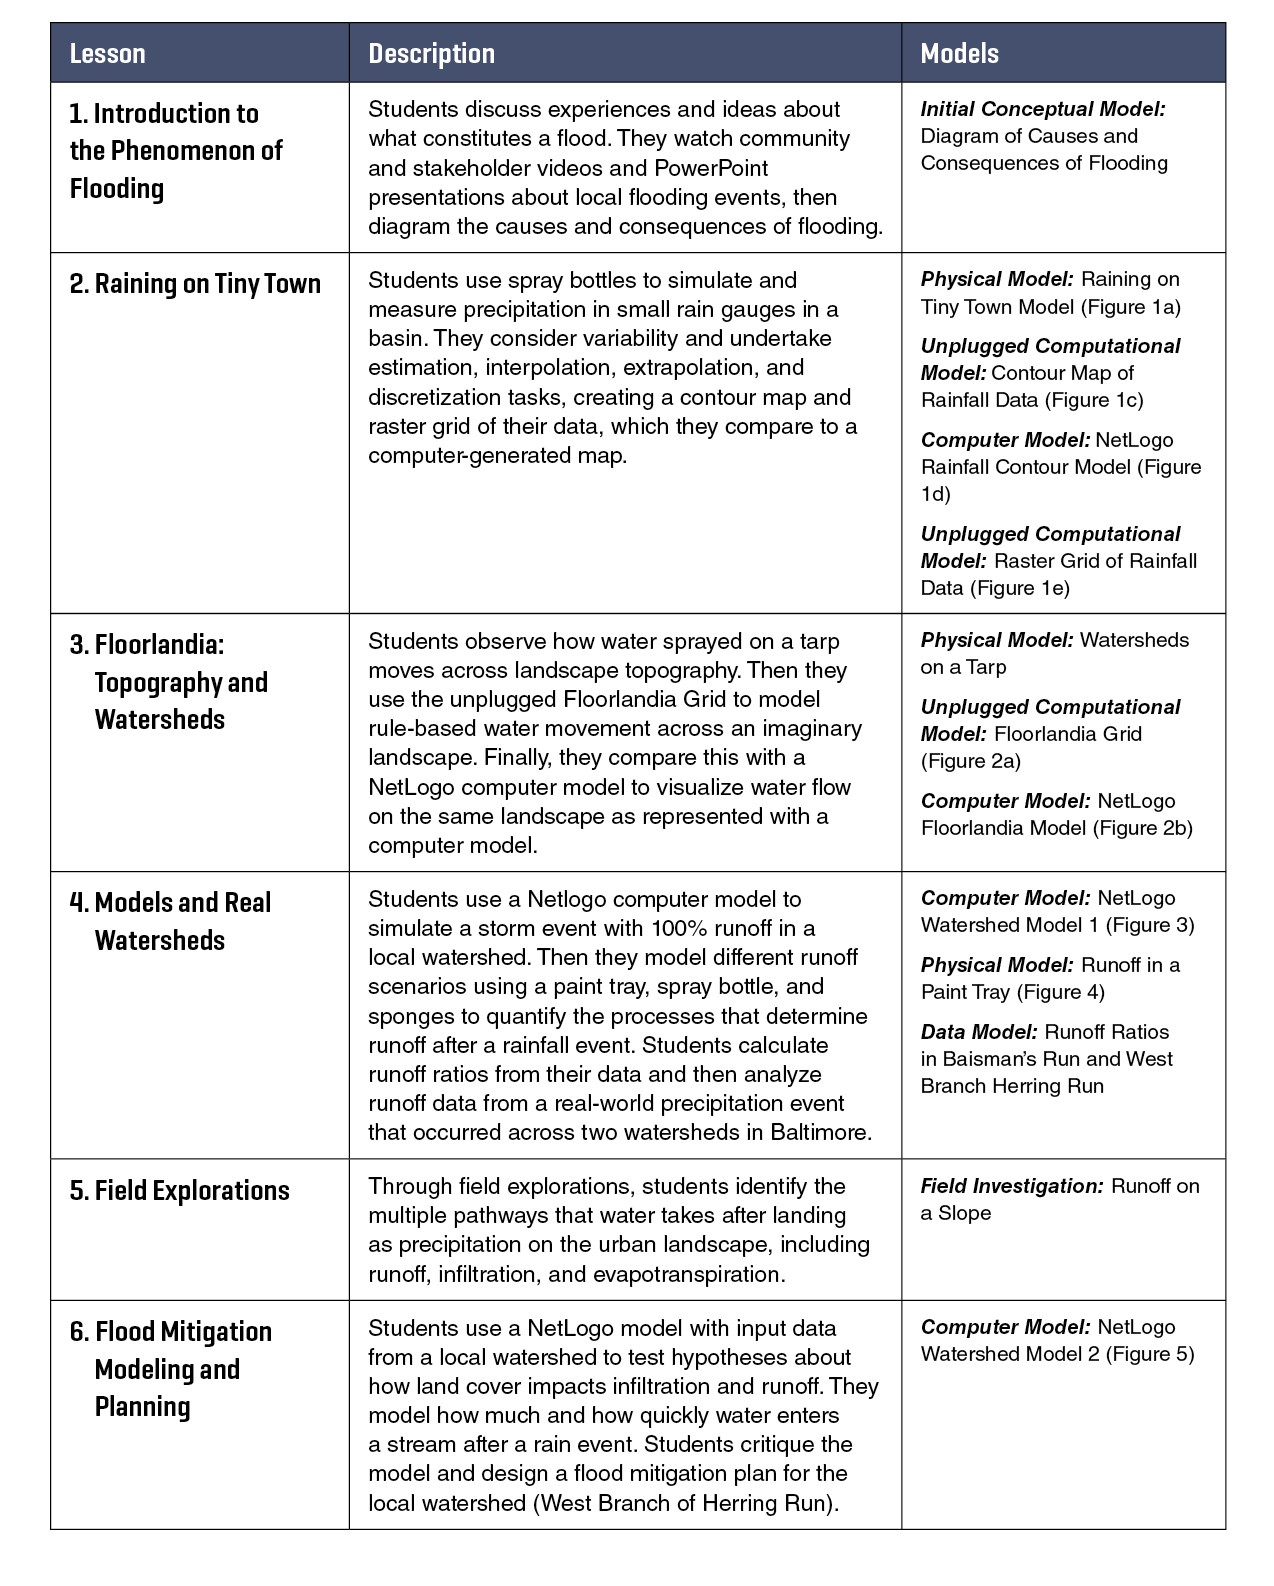
Baltimore Floods comprises six lessons (Table 2) that scaffold learning through three major hydrologic strands:
- precipitation (Lessons 1–2),
- surface runoff (Lessons 3–4), and
- runoff combined with infiltration and evapotranspiration (Lessons 5–6).
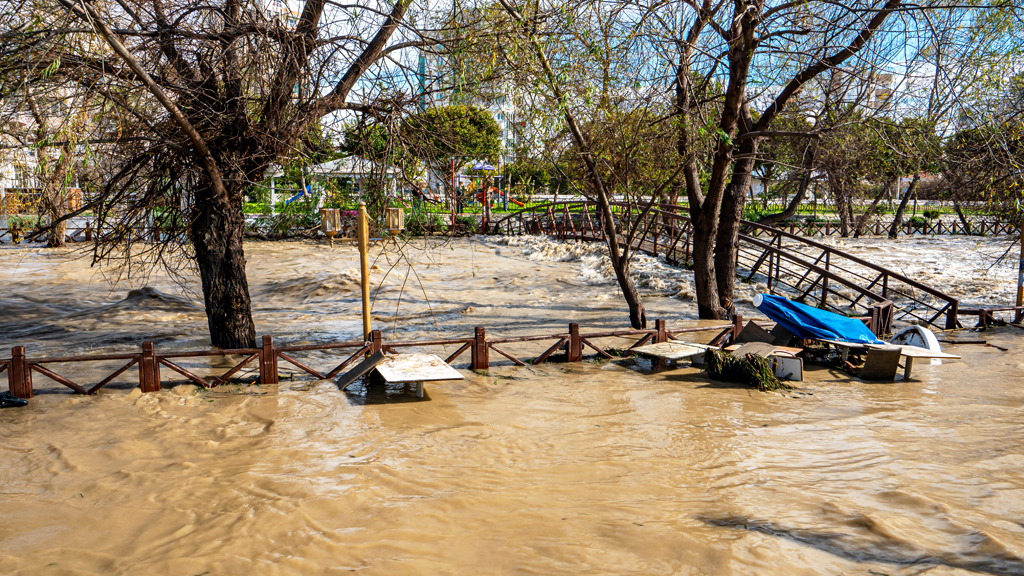
The unit begins with students brainstorming answers to the following guiding questions: (1) Why do watersheds in Baltimore flood so frequently and violently? and (2) Will flooding become more frequent with climate change? Students create a preliminary conceptual model of urban watershed flooding and engage with a series of conceptual, physical, unplugged computational, and computer models as they explore how excess precipitation and runoff can lead to flooding events in local streams. Finally, students evaluate flood mitigation strategies in a local watershed and recommend actions to reduce the risk of flooding.
Click here to enlarge
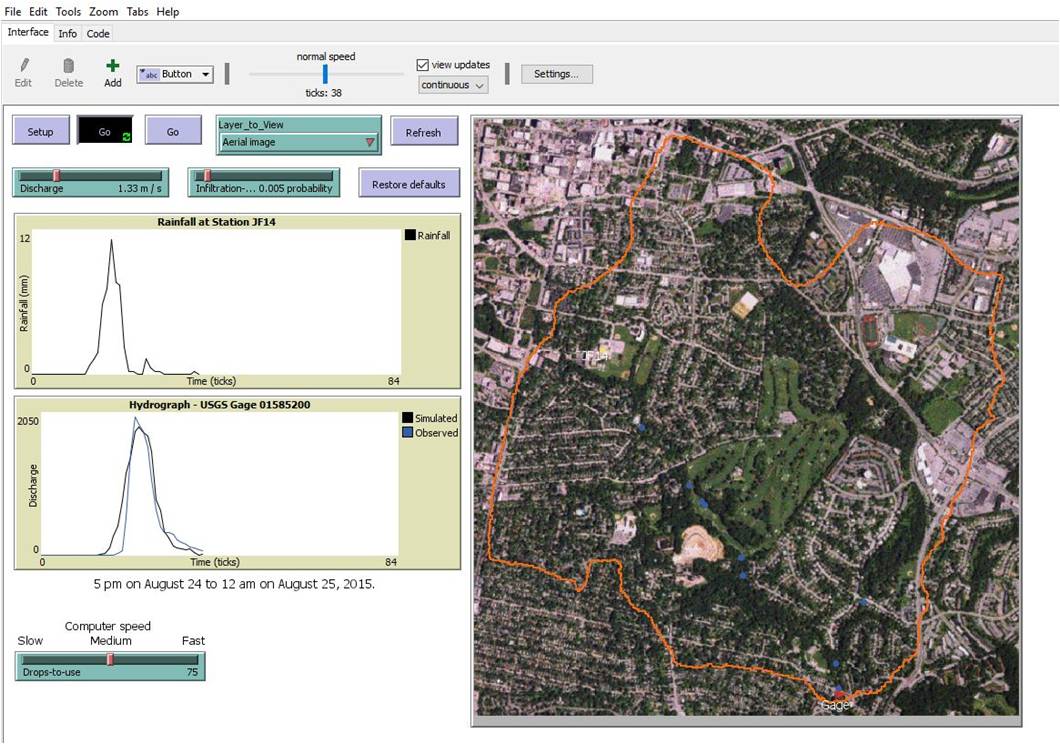
With high school teachers and their students in mind, the CompHydro partnership chose the freeware NetLogo modeling platform to create our project’s plugged-in computational models. Netlogo is an agent-based modeling environment where the behaviors of individual agents (in our case, drops of water) are modeled in space and time. Agent-based models have been shown to be effective tools in supporting learners in making sense of and exploring scientific phenomena (Abrahamson and Wilensky 2007; Blikstein and Wilensky 2009; Sengupta and Wilensky 2009).
Click here to enlarge
Click here to enlarge
Click here to enlarge
Click here to enlarge
Baltimore Floods Unit Integration of CT Practices
The three strands of activities and models in the Baltimore Floods unit (Table 3) engage students in many of the CT practices that have been identified as important in the CT and STEM education literature (e.g., Covitt 2020; Grover and Pea 2013; Weintrop et al. 2016; Wilensky and Reisman 2006). Together, the activities and practices in the unit represent a sequence that builds students’ understanding of how and why riverine system flooding occurs and of how flooding can be measured, predicted, and mitigated. Here we describe what each CT practice looks like as students engage with the Baltimore Floods unit.
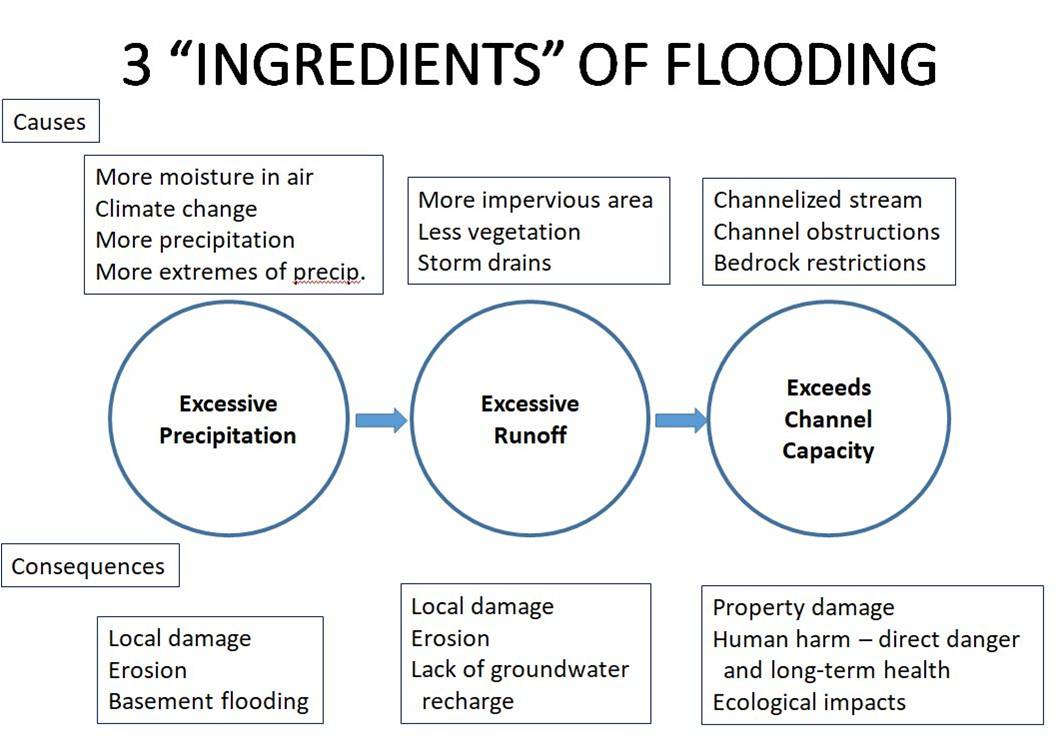
Making a conceptual model of a system. After being introduced to stories of local flooding events, students create conceptual diagrams to organize their personal knowledge of the causes and consequences of flooding. Teachers help students identify the pivotal roles that excessive precipitation and runoff play in riverine flooding, leading to the development of a class-level model (e.g., Figure 6). The student and class diagrams serve as initial conceptual models that students can expand upon and modify as they build toward more abstract, quantitative, and rule-based conceptualizations of flooding.
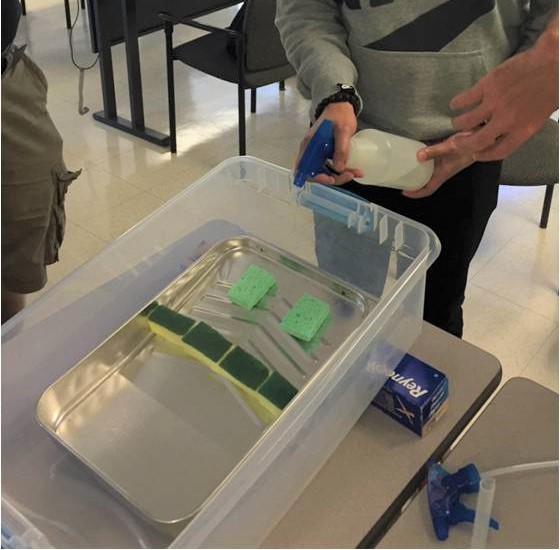
Using a physical model to explore system components and processes. Baltimore Floods engages students in making direct, physical observations in simplified systems to provide experiences analogous to data collection in larger, real-world systems. Students capture and measure simulated rainfall and translate between depth and volume measurements to interpret precipitation amount data (Raining on Tiny Town). Next, they qualitatively observe the relationship between topography and the motion and accumulation of water in the Watersheds on a Tarp Model. Finally, students quantify how water runoff that can contribute to flooding is affected by the presence of absorptive materials commensurate with groundwater infiltration using the Runoff in a Paint Tray Model.
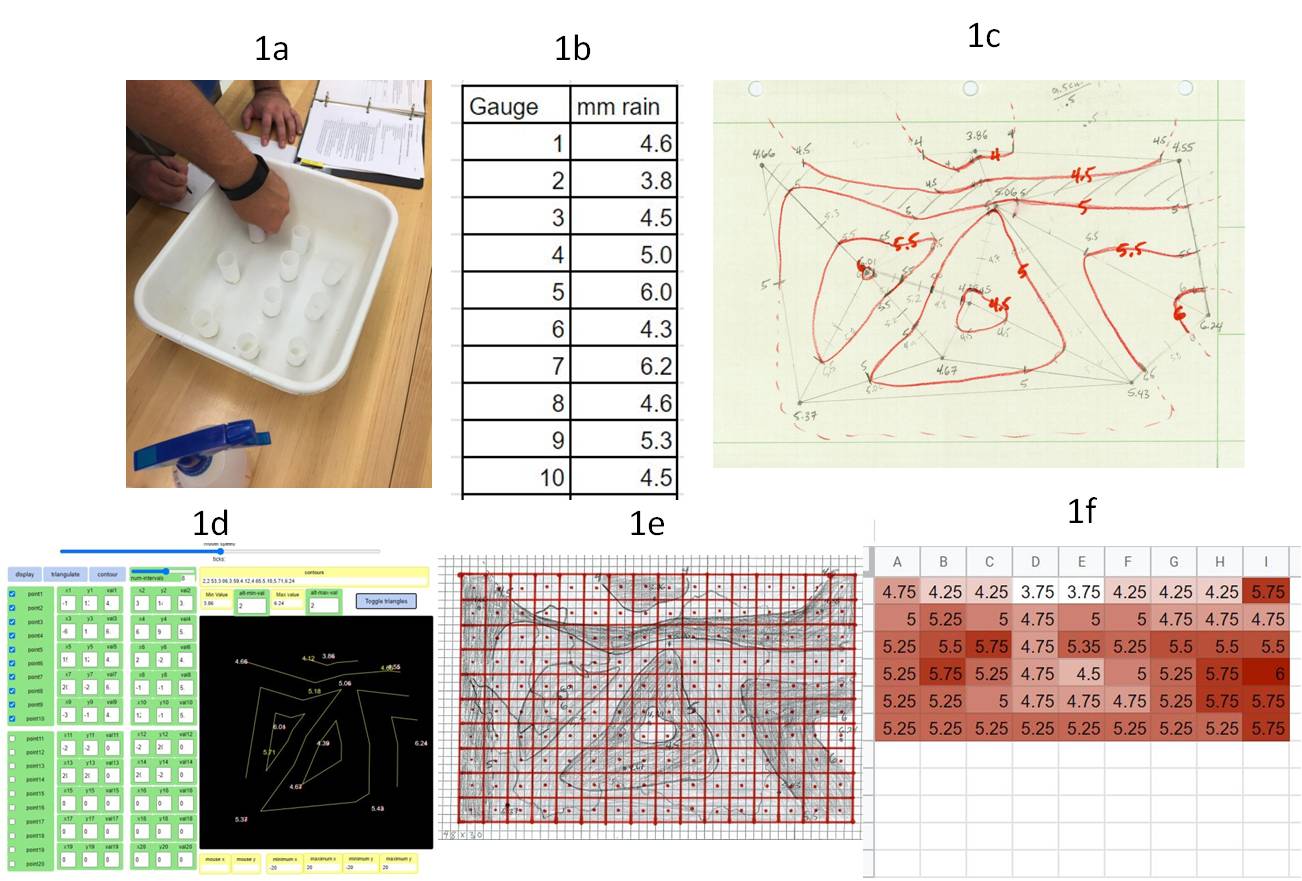
Using data from a physical model to quantify system behavior. Baltimore Floods provides opportunities for students to produce, manipulate, analyze, and visualize data with particular emphasis on considering how data can be used as input to a computational model and how to interpret data outputs generated by a computational model. Students gather precipitation data from small-scale rain gauges (Raining on Tiny Town), plot the data on a spatial map, and then generate a contour plot visualization using interpolation (Figure 1a-c). The map is then visualized in 3D using a Netlogo modeling tool (Figure 1d). Students also collect data by spraying water into a paint tray and measuring the water collected at the bottom of the tray under different scenarios (e.g., wet, dry, or no sponges). They use these data to calculate runoff rates, building evidence-based understanding of how land cover influences runoff and infiltration after a storm event.
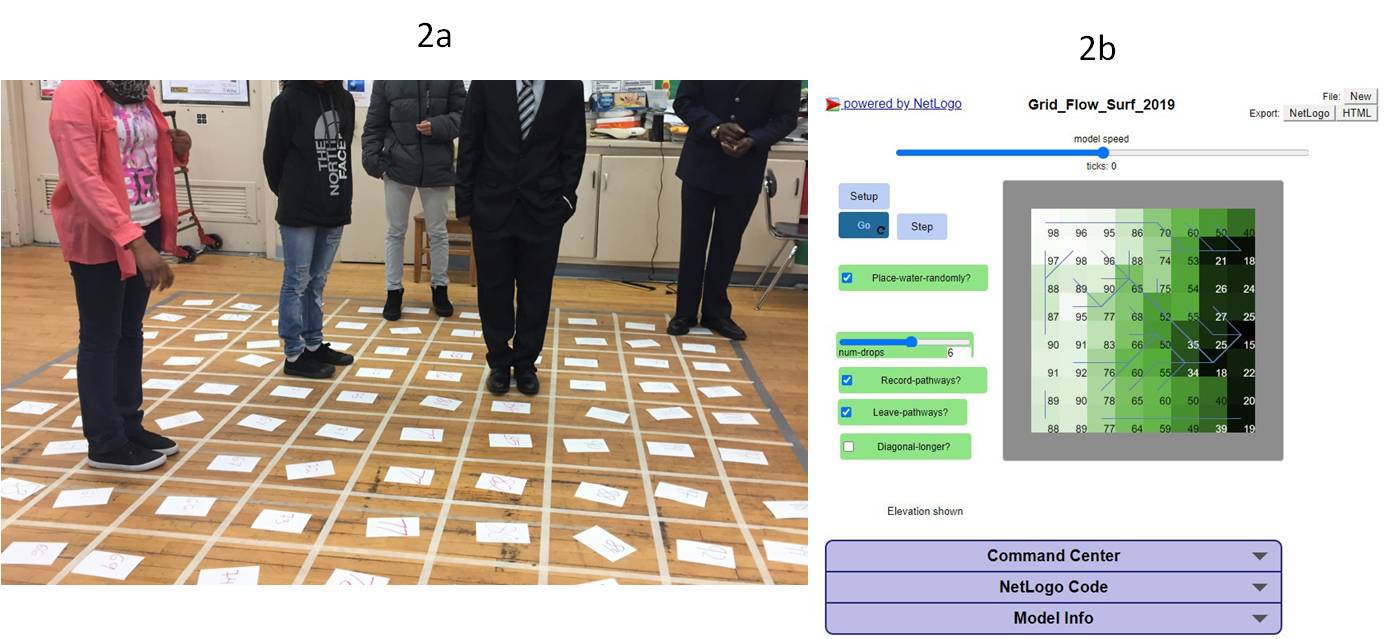
Representing a system in discrete time and space to identify relationships and define rules. Computational models represent systems as discretized elements in time and space. Time is represented by calculating change in small intervals or steps. Space is partitioned into areas or volumes that can be characterized by a single quantified value (e.g., temperature or rainfall). Physical forms can be represented as small independent entities like raindrops or grains of sand (sometimes labeled “agents” in computer models). Baltimore Floods introduces spatial discretization in Raining on Tiny Town, teaching students how to reinterpret contour data as a grid of raster values (Figure 1e-f). The unit introduces both discrete time-stepping and agent-based simulation with variations of the Floorlandia Model, which simulates the motion of multiple raindrop agents as they traverse the topography of a simplified landscape and accumulate in low-lying stream beds. Floorlandia Grid is an unplugged model in which students create rules for the overland flow of water (to lower elevation) and consider how those rules lead to behavior that can be interpreted as flooding. Once students develop the underlying rules or algorithms for water movement in the unplugged Floorlandia context, they shift to a NetLogo computer model version of Floorlandia. This introduces students to the idea that the behavior of real-world, physical systems can be represented and modeled using a computer.
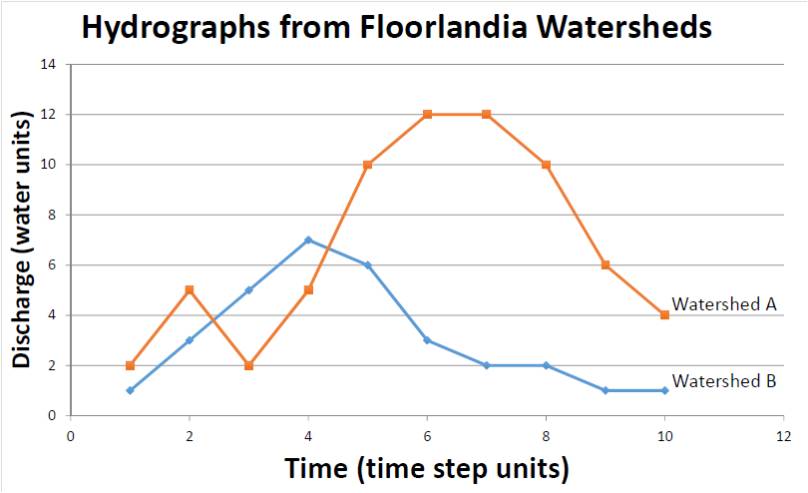
Using data from a discrete model to quantify system behavior. Students gather data from the unplugged Floorlandia Grid Model as counts of raindrops that reach the low (base) point of the watersheds in the model after each individual time step. They plot these data as amount versus time to create hydrographs of streamflow following the simulated rainfall (Figure 7). In this way, students convert spatial data inputs of precipitation, topography, and infiltration rates into time series output representing the time-dependent flow of water within a stream after a storm event.
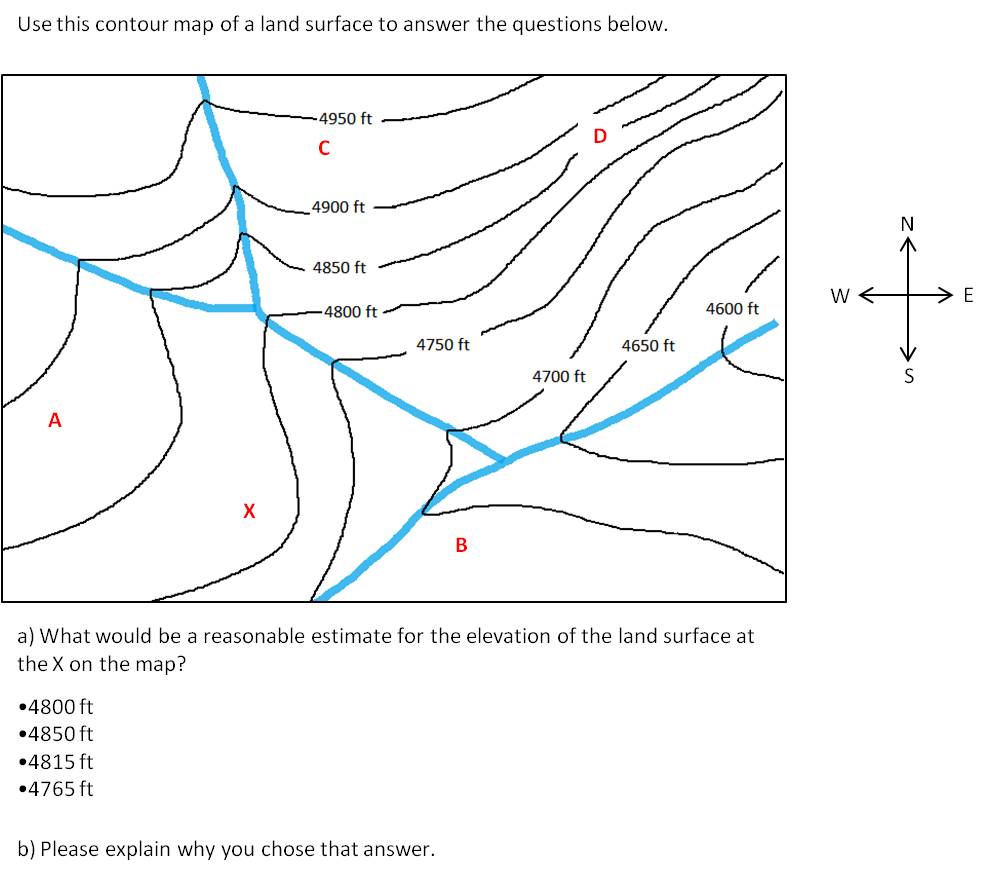
Validating models. A question asked of any model is “How do you know that it is valid?” For simplified models like those used in Baltimore Floods, this question can be difficult to answer quantitatively, as the tradeoffs made in functionality of the model (e.g., ability to compute in real time with classroom computers) limit accuracy and precision. However, students can still learn the basics of why they should or shouldn’t trust a model and how to evaluate when a model is valid. Students consider validity several times during the unit. For example, they compare their hand-computed results to computer-generated results for their contour plot in Raining on Tiny Town and for the Floorlandia simulation, judging how well the models represent events from the real world.
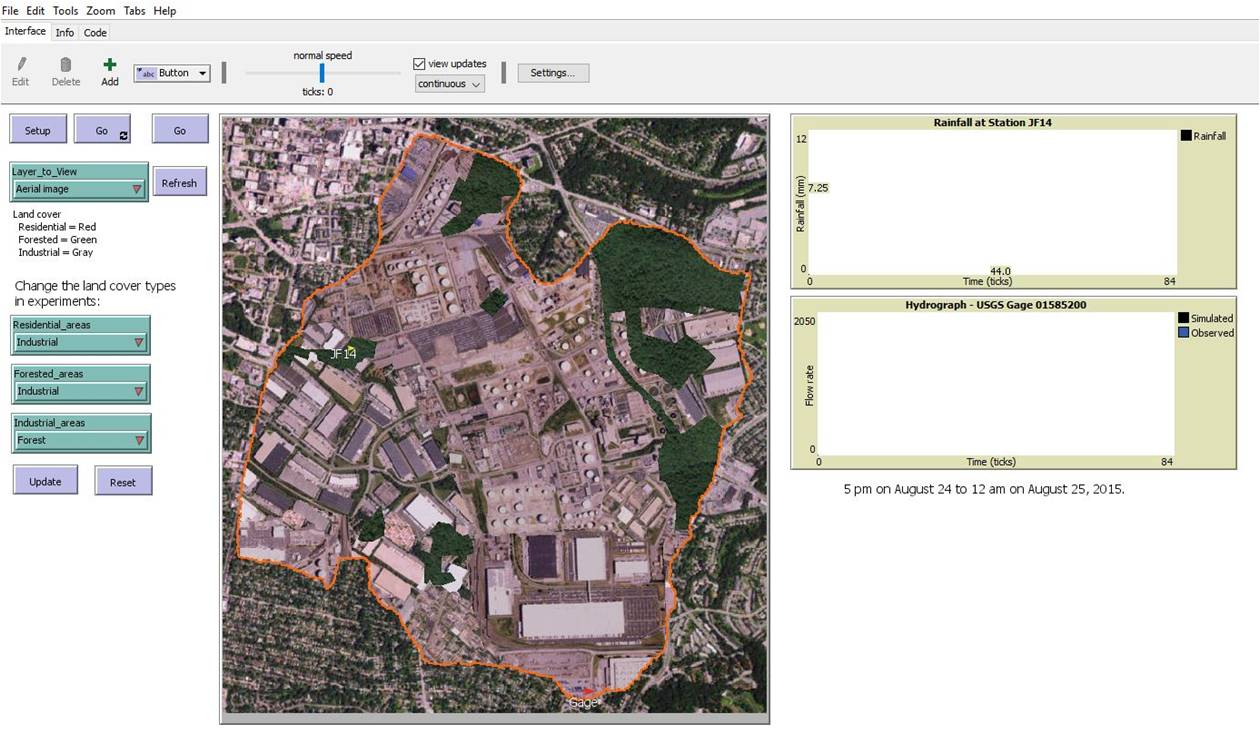
Testing solutions and making predictions. The Baltimore Floods unit culminates with a “what if” scenario that exemplifies the use of computational models for making predictions and evaluating solutions (Lesson 6). Students consider hypothetical solutions for flood mitigation by making changes to a watershed (e.g., changing surface cover and associated permeability) as represented in a NetLogo computational model. Students need to apply their knowledge of water movement, and their nascent computational thinking and data sense-making abilities as they develop, evaluate, and explain effective flood mitigation solutions using the model.
Conclusion of the Baltimore Floods Unit. By the end of the unit, students have engaged with a wide variety of representations and models to develop knowledge and practices they can apply to explain, predict, and respond to issues of flooding as water moves across and through connected water systems. The CT practices infused into the Baltimore Floods unit help students make sense of a complex system through simplifying it into smaller, quantitative components. Students also become more model literate, learning through experience that different models have different strengths and limitations for understanding, explaining, and predicting events and processes in complex systems. As one student described, “It is extremely important because these models and the acts of producing and refining them help to effectively understand problems and come to possible solutions.”
Lessons Learned
The CompHydro Baltimore partnership served as a powerful learning experience. As challenges arose, and as revisions and refinements were made, multiple ideas emerged, which may prove useful for other groups interested in integrating CT into high school STEM learning experiences. These ideas may be particularly relevant in contexts of large, urban districts like Baltimore City Schools.
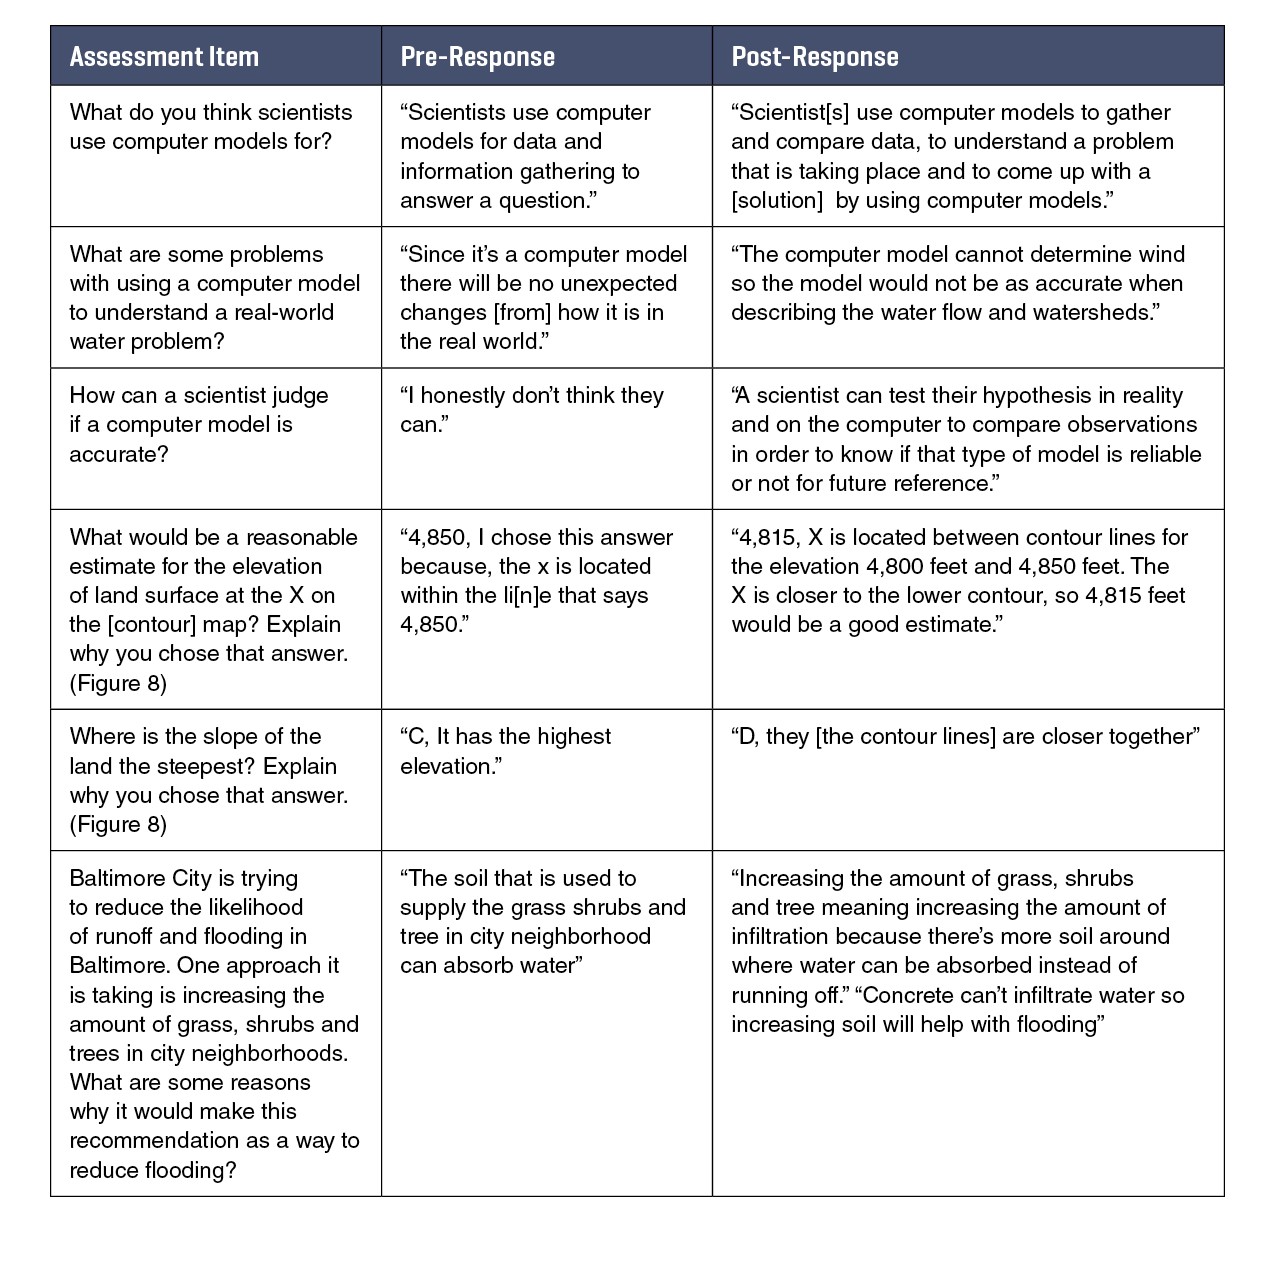
What worked well. The CompHydro Baltimore project demonstrated how broad partnerships can support the development and implementation of place-based, NGSS-aligned, and computationally sophisticated instruction at the high school level in schools that have little previous experience in this domain. Teachers shared that participating in CompHydro Baltimore helped them integrate CT into their instruction. To support teacher growth and efficacy in using CT and modeling, we created opportunities for extensive cross disciplinary teacher PD wherein science, computer science, and engineering teachers learned from and supported each other as they navigated new and challenging areas of instruction. Our experts in computer science education, ecology, and hydrology participated in collaborative planning sessions with teachers, improving the quality and usability of the curriculum while also supporting teacher learning and confidence. As a result of the project’s extensive and extended PD, teachers successfully implemented Baltimore Floods in their classes. Students actively engaged in the lessons, made connections to the real-world context of flooding in and around Baltimore, and learned about the benefits and limitations of models (Table 4). As one student suggested, the models “…help me get a better understanding of how water flows . . . in the different time spans and so helped me see things I couldn’t see from where I was standing.” One teacher shared, “[t]he skills they gain, using models and data are skills that they can apply to everyday life as well as other parts of education.” Table 4 provides representative examples of different individual students’ learning in the form of their pre- and post-responses to Baltimore Floods written assessment items. Using matched cumulative scores (77 students for the six items), students’ performances were lower on the pretest (M = 14.9, SD = 3.4) than on the posttest (M = 15.9, SD = 3.8). A repeated-measures t-test found this difference to be significant, t(76) = 3.68, p <0 .001.
Click here to enlarge
What was challenging. The CompHydro Baltimore project revealed challenges that are likely to arise in other districts tackling similar goals. Developing the unit required expertise that might be hard for some districts to replicate. The resultant curriculum could be difficult to modify and mold for different implementation settings without sustained involvement of these partners. In the case of CompHydro Baltimore, the involvement of biology, engineering, and computer science teachers was a great strength but also proved challenging for achieving consistency and completeness across implementation, which is important in the context of a unit with a storyline arc across lessons. One curriculum unit cannot easily address the instructional goals of the diversity of teachers without being modified, ideally with the support of a strong team of educators familiar with the curriculum and school system expectations.
Another challenge we addressed dealt with supporting participating schools’ access to computing resources and expertise. CompHydro Baltimore provided participating schools with classroom sets of supplies and access to laptop computers. Access to these resources and to CompHydro personnel providing in-school support was identified as critical to implementing Baltimore Floods. One teacher noted that “[r]esources are often limited and it would be impossible to even attempt to do a series of lessons like this without the support [of CompHydro].” While we were able to address the issue of access to computers and technological expertise in the project, we do know that this issue will continue to be a challenge for implementing CT projects at scale in districts that are resource limited with respect to technology.
Concluding Thoughts
The Framework (2012) and NGSS (NGSS Lead States 2013) have raised the expectations for curriculum by elevating computational thinking as a core science practice. Integrating CT into important science domains like water literacy is a promising but ambitious undertaking that school districts, schools, and teachers cannot be expected to figure out on their own. Successful integration of CT requires curriculum and PD that might best be provided by collaborations across formal and informal organizations (e.g., universities, nonprofits, schools). In this way, scientists, science education researchers, computer modelers, and teachers can work together to create robust learning opportunities for teachers and students. Achieving and sustaining meaningful integration of CT needed for science literacy in large and resource-limited district contexts, while eminently possible, is not easy. Important inputs include broad partnerships, development of high-quality curriculum materials, prioritization by districts and teachers, investment in technology resources and expertise, and extensive and extended PD and support.
To learn more about CompHydro Baltimore or to download our free Baltimore Floods curriculum visit www.baltimoreecosystemstudy.org. To view a video about the project, visit http://ibis-live1.nrel.colostate.edu/comphydro/.
Acknowledgments
This program is supported by the National Science Foundation, grant No. 1543228. Any opinions, findings, and conclusions or recommendations expressed in these materials are those of the author(s) and do not necessarily reflect the views of the National Science Foundation.
Bess Caplan (caplanb@caryinstitute.org) is the Education Program Leader for the Baltimore Ecosystem Study (BES), a project of the Cary Institute of Ecosystem Studies (Cary) in Baltimore, Maryland; Beth Covitt is Head of Science Education Research & Evaluation at spectrUM Discovery Area at University of Montana; Garrett Love is Chair, Department of Engineering and Computer Science at the North Carolina School of Science and Mathematics in Durham, North Carolina; Alan R. Berkowitz is Head of Education at Cary Institute of Ecosystem Studies in Millbrook, New York; Kristin L. Gunckel is a professor of science education at University of Arizona in Tucson, Arizona; Chelsea McClure is a Lecturer of Education at Towson University in Towson, Maryland; and John Moore is a Professor in the Department of Ecosystem Ecology and Sustainability, and Director of the Natural Resource Ecology Laboratory at Colorado State University in Fort Collins, Colorado.
citation: Caplan, B., B. Covitt, G. Love, A.R. Berkowitz, K.L. Gunckel, C. McClure, and J.C. Moore. 2021. Using computational thinking and modeling to build water and watershed literacy. Connected Science Learning 3 (2). https://www.nsta.org/connected-science-learning/connected-science-learning-march-april-2021/using-computational-thinking
Computer Science Environmental Science Interdisciplinary Phenomena STEM Three-Dimensional Learning High School Informal Education